

Key Insights
The global Property Restoration Services market is poised for substantial growth, projected to reach an estimated $15 billion in 2025. This expansion is driven by a confluence of factors including the increasing frequency and severity of natural disasters, a rising awareness of the importance of timely and professional restoration, and a growing need for specialized services to address fire, smoke, and water damage. As urban development continues and property values escalate, the economic imperative to restore damaged properties rather than replace them becomes more pronounced. Furthermore, an aging infrastructure in many developed regions contributes to a higher incidence of property damage requiring professional intervention. The market is segmented by application into Personal Property and Public Property, with the former likely dominating due to the sheer volume of individual homeowners and businesses requiring restoration services.
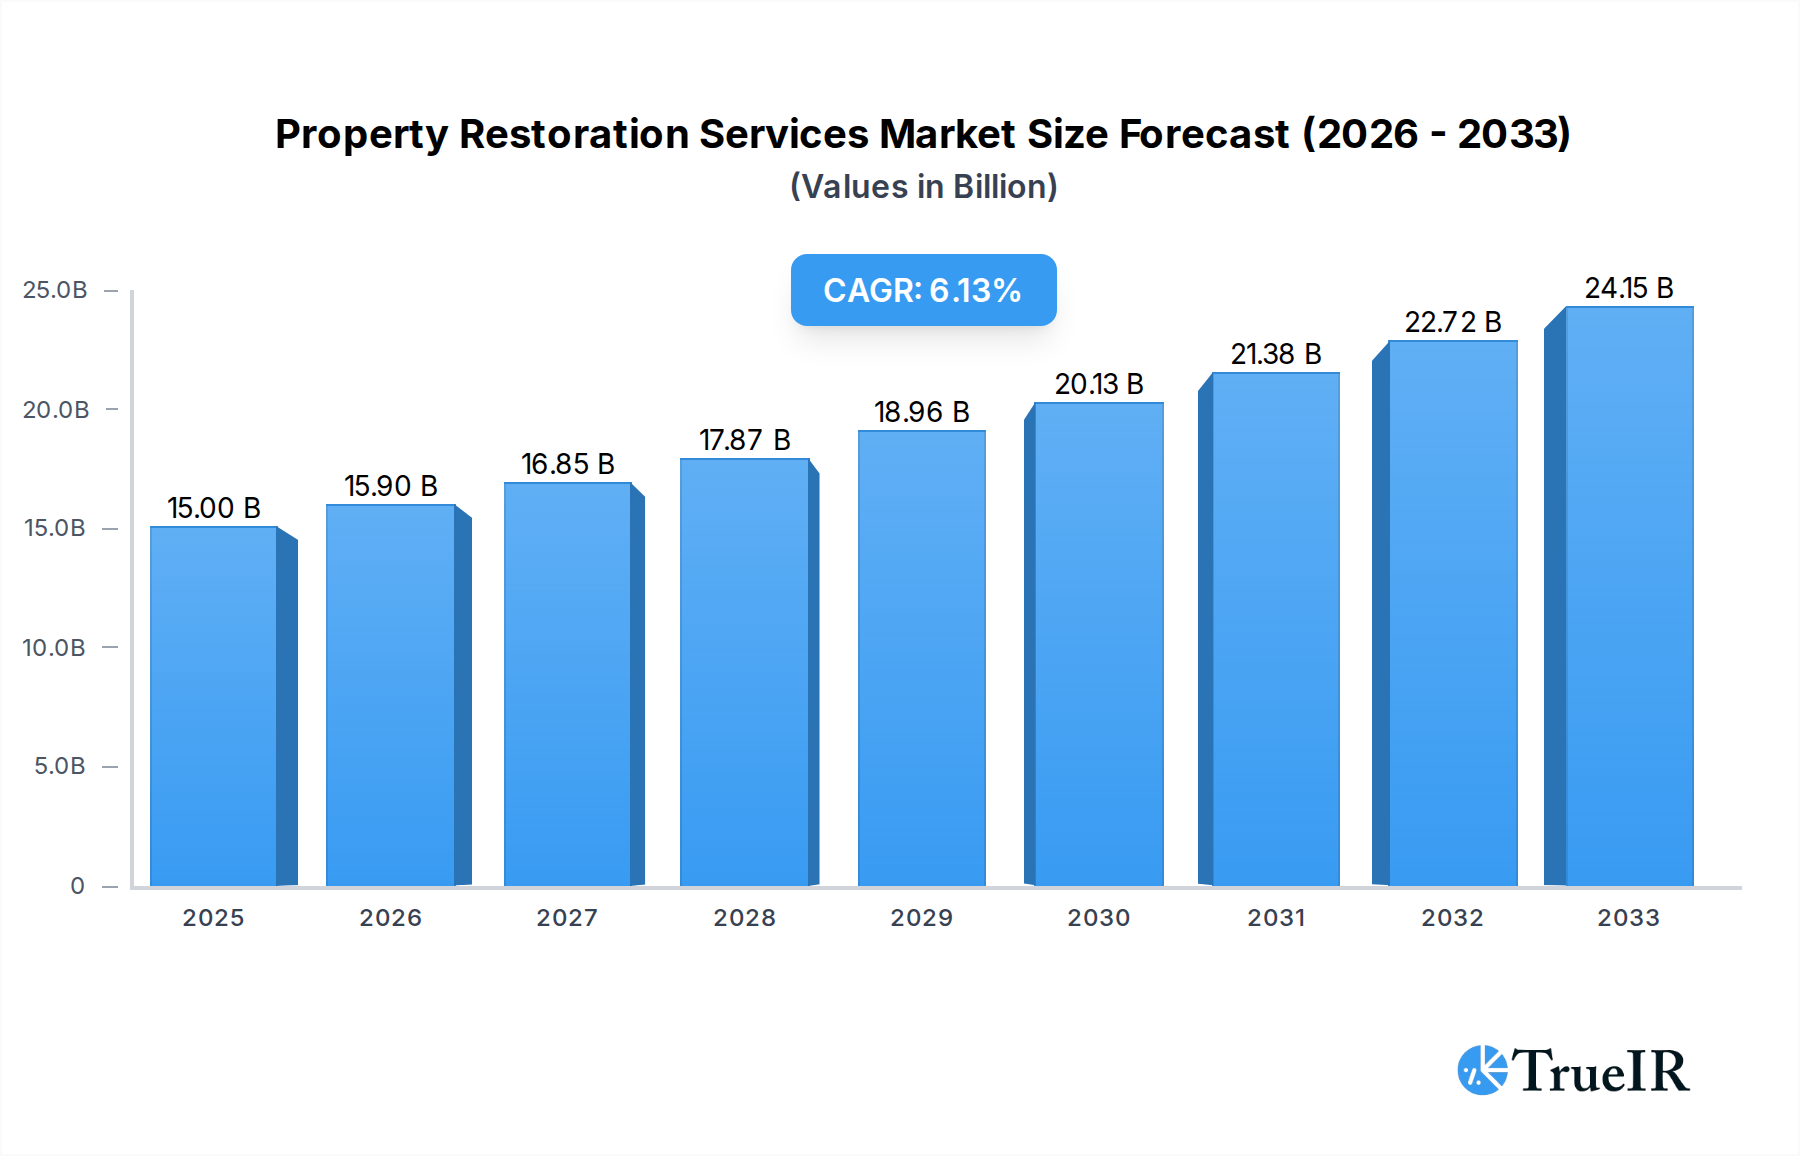
Property Restoration Services Market Size (In Billion)
The CAGR of 6% over the forecast period (2025-2033) indicates a robust and sustained upward trajectory for the property restoration industry. Key trends shaping this market include the adoption of advanced technologies for damage assessment and restoration, such as drone imaging and moisture detection tools, leading to more efficient and less invasive processes. An increasing emphasis on eco-friendly restoration methods and sustainable practices is also gaining traction. However, the market is not without its challenges. Restraints such as fluctuating insurance claim processing times, the high cost of specialized equipment and trained personnel, and intense competition among service providers can moderate the pace of growth in certain segments. Nevertheless, the overarching demand, coupled with innovation and a commitment to customer satisfaction, will ensure a dynamic and expanding market for property restoration services globally.

Property Restoration Services Company Market Share
Property Restoration Services Market Structure & Competitive Landscape
The property restoration services market, projected to reach over billion by 2033, exhibits a moderate to high degree of concentration, with key players like BELFOR, Servpro, and Rainbow Restoration holding significant market share. Innovation remains a primary driver, fueled by advancements in drying technologies, advanced material science for repairs, and sophisticated digital assessment tools. Regulatory impacts are substantial, with strict adherence to building codes, environmental regulations (e.g., mold remediation standards), and insurance claim processing protocols shaping operational strategies. The threat of product substitutes is relatively low for specialized damage restoration, though broader construction and general contracting services can compete in less complex scenarios.
End-user segmentation is critical, broadly categorized into Personal Property (residential homes) and Public Property (commercial buildings, government facilities, and infrastructure). The increasing frequency and severity of extreme weather events are escalating the demand for both, with public property restoration often involving larger-scale, complex projects. Mergers and acquisitions (M&A) are a persistent trend, with larger entities acquiring smaller, regional players to expand geographic reach and service offerings. For instance, recent M&A activity has seen companies like BMS CAT and GDI Integrated Facility Services strategically bolstering their portfolios. This consolidation is driven by the need for economies of scale, enhanced operational efficiency, and a broader service catalog to meet diverse client needs across fire, smoke, water, and wind damage restoration. Concentration ratios, while fluctuating, generally indicate that the top 5-10 companies control over billion in market revenue.
Property Restoration Services Market Trends & Opportunities
The property restoration services market is experiencing robust growth, projected to expand at a Compound Annual Growth Rate (CAGR) of approximately XX% during the forecast period of 2025–2033. This expansion is primarily propelled by the increasing frequency and intensity of extreme weather events, including hurricanes, floods, wildfires, and severe storms, which directly drive demand for emergency response and comprehensive restoration services. The market size, estimated at over billion in 2025, is expected to ascend to billion by 2033. Technological shifts are significantly impacting the industry, with the adoption of advanced drying technologies, such as desiccant dehumidification and infrared imaging, accelerating project timelines and improving outcomes for water damage restoration. Furthermore, the integration of AI-powered assessment tools, drone technology for damage surveying, and digital project management platforms are enhancing efficiency, accuracy, and client communication.
Consumer preferences are evolving, with an increasing emphasis on speed, reliability, and transparent communication throughout the restoration process. Homeowners and business owners alike expect seamless experiences, often facilitated by integrated service providers capable of handling all aspects of restoration, from initial mitigation to complete reconstruction. Competitive dynamics are intensifying, leading to a greater focus on service differentiation, specialized expertise (e.g., mold remediation, biohazard cleanup), and superior customer service. Companies are investing heavily in branding and marketing to build trust and establish themselves as preferred restoration partners. Market penetration rates are steadily increasing as awareness of professional restoration services grows, particularly in regions prone to natural disasters. The shift towards sustainable and eco-friendly restoration practices is also gaining traction, presenting an opportunity for companies that can offer environmentally conscious solutions. The growing demand for specialized restoration services, such as fire and smoke damage restoration and wind, hurricane, and tornado damage restorations, further contributes to market expansion. The "others" segment, encompassing biohazard cleanup, mold remediation, and structural repairs, is also witnessing significant growth due to rising health consciousness and aging infrastructure.
Dominant Markets & Segments in Property Restoration Services
The Water Damage Restoration segment emerges as a dominant force within the property restoration services market. This dominance is driven by a confluence of factors, including the pervasive nature of water-related incidents, from minor leaks to catastrophic flooding. The United States represents a leading country, with a substantial market share attributed to its diverse climate, susceptibility to natural disasters, and well-established insurance infrastructure that underpins the demand for professional restoration.
Key growth drivers for water damage restoration and its dominance include:
- Infrastructure Vulnerabilities: Aging plumbing systems in residential and commercial properties, coupled with inadequate drainage in urban areas, consistently lead to water ingress.
- Climate Change Impact: The increasing frequency of heavy rainfall, hurricanes, and coastal flooding directly escalates water damage incidents. For instance, the aftermath of major hurricanes like Ida and Ian has consistently driven billions in water damage restoration demand.
- Insurance Payouts: A robust insurance market that covers water damage claims encourages property owners to seek professional remediation services, contributing to market value.
- Health and Safety Concerns: The rapid growth of mold and bacteria in damp environments necessitates professional intervention to ensure indoor air quality and prevent long-term health issues.
Within the broader segmentation, Personal Property restoration services, specifically focusing on residential water damage, represent a significant portion of the market. This is due to the sheer volume of individual homes affected by plumbing failures, appliance malfunctions, and weather-related inundation. However, Public Property restoration, particularly in the wake of large-scale natural disasters like hurricanes and major floods, often involves much larger project values and longer recovery periods, significantly contributing to overall market size and growth.
The Fire and Smoke Damage Restoration segment also holds considerable importance, driven by accidental fires in homes and businesses. Advancements in smoke odor removal technology and fire damage repair techniques contribute to the segment's growth. Meanwhile, Wind, Hurricane, and Tornado Damage Restorations are highly cyclical but experience substantial spikes in demand following severe weather events, significantly impacting regional markets. The "Others" category, encompassing specialized services like mold remediation and biohazard cleanup, is a rapidly growing niche, propelled by increasing awareness of health risks and stringent environmental regulations, projecting over billion in value.
Property Restoration Services Product Analysis
Property restoration services are increasingly characterized by technological innovation and specialized application. Key product innovations include advanced drying equipment utilizing desiccant dehumidification and infrared imaging for rapid moisture removal, preventing secondary damage like mold growth. The application of antimicrobial coatings and HEPA filtration systems has become standard for fire and smoke damage restoration, ensuring a healthier environment post-incident. For water damage, advancements in non-invasive moisture detection and containment technologies minimize disruption. Competitive advantages are derived from rapid response times, specialized expertise in handling complex damages (e.g., biohazards, structural stabilization), and the integration of digital platforms for seamless communication and project management, offering clients a comprehensive and efficient recovery experience.
Key Drivers, Barriers & Challenges in Property Restoration Services
The property restoration services market is propelled by escalating natural disaster frequency, leading to surge in demand for emergency response and recovery. Technological advancements in drying, assessment, and remediation techniques enhance service efficiency and effectiveness. Stringent building codes and growing awareness of health risks associated with mold and biohazards also act as significant growth drivers. Economic recovery and infrastructure investment further fuel the need for property repairs and restoration.
Conversely, challenges impacting growth include the highly competitive landscape with numerous local and national players, leading to price pressures. Supply chain disruptions for essential materials and equipment can cause project delays. Regulatory complexities surrounding licensing, environmental compliance, and insurance claim processing can be burdensome. Skilled labor shortages also pose a significant restraint, impacting the ability to scale operations during peak demand periods.
Growth Drivers in the Property Restoration Services Market
Key growth drivers in the property restoration services market are multi-faceted. Technological advancements in drying, dehumidification, and air purification technologies are crucial for rapid and effective remediation, minimizing secondary damage. Economic factors, such as rising disposable incomes and property values, encourage investment in property maintenance and restoration. Regulatory frameworks, particularly those concerning mold remediation and indoor air quality, drive demand for specialized services. Furthermore, the increasing frequency and severity of natural disasters, including hurricanes, floods, and wildfires, are paramount, creating immediate and substantial demand for restoration services across affected regions.
Challenges Impacting Property Restoration Services Growth
Challenges impacting property restoration services growth are substantial and require strategic mitigation. Regulatory complexities surrounding environmental compliance (e.g., asbestos abatement, lead paint removal) and licensing requirements can create significant hurdles and increase operational costs. Supply chain issues, particularly for specialized equipment and materials, can lead to project delays and impact profitability, especially during periods of high demand following widespread disasters. Intense competitive pressures from both established national brands and smaller local contractors can lead to price wars and erode profit margins. The persistent shortage of skilled labor is a critical barrier, hindering the capacity of companies to effectively scale operations and respond to the growing demand, potentially impacting service quality and response times.
Key Players Shaping the Property Restoration Services Market
- BELFOR
- Servpro
- Rainbow Restoration
- PuroClean
- 911 Restoration
- Steamatic
- Paul Davis Restoration
- BMS CAT
- Duraclean
- Restoration 1
- GDI Integrated Facility Services
- DKI Restoration
- Blackmon Mooring
- Elite Disaster Restoration
Significant Property Restoration Services Industry Milestones
- 2019: Increased adoption of drone technology for faster and safer damage assessment post-disaster.
- 2020: Greater emphasis on advanced antimicrobial treatments and HEPA filtration for improved indoor air quality in restoration projects.
- 2021: Expansion of digital platforms for enhanced customer communication, project tracking, and virtual consultations.
- 2022: Growing investment in AI-powered diagnostic tools for more accurate damage identification and restoration planning.
- 2023: Rise of eco-friendly and sustainable restoration practices gaining traction among consumers and regulatory bodies.
- 2024: Consolidation trends intensify with strategic acquisitions aimed at expanding service offerings and geographic reach.
Future Outlook for Property Restoration Services Market
The future outlook for the property restoration services market is exceptionally positive, driven by enduring factors and emerging opportunities. The persistent threat of extreme weather events will continue to be a primary catalyst for demand, ensuring a steady need for emergency response and comprehensive restoration. Technological integration, from AI-driven diagnostics to advanced drying techniques, will further enhance operational efficiency and service quality. A growing emphasis on sustainability and health-conscious restoration practices presents a significant avenue for differentiation and market leadership. Strategic alliances, further consolidation through M&A, and a focus on building strong customer relationships based on trust and transparency will be critical for companies aiming to capture a larger share of this expanding market, projected to exceed billion in the coming years.
Property Restoration Services Segmentation
-
1. Application
- 1.1. Personal Property
- 1.2. Public Property
-
2. Types
- 2.1. Fire and Smoke Damage Restoration
- 2.2. Water Damage Damage Restoration
- 2.3. Wind, Hurricane, and Tornado Damage Restorations
- 2.4. Others
Property Restoration Services Segmentation By Geography
-
1. North America
- 1.1. United States
- 1.2. Canada
- 1.3. Mexico
-
2. South America
- 2.1. Brazil
- 2.2. Argentina
- 2.3. Rest of South America
-
3. Europe
- 3.1. United Kingdom
- 3.2. Germany
- 3.3. France
- 3.4. Italy
- 3.5. Spain
- 3.6. Russia
- 3.7. Benelux
- 3.8. Nordics
- 3.9. Rest of Europe
-
4. Middle East & Africa
- 4.1. Turkey
- 4.2. Israel
- 4.3. GCC
- 4.4. North Africa
- 4.5. South Africa
- 4.6. Rest of Middle East & Africa
-
5. Asia Pacific
- 5.1. China
- 5.2. India
- 5.3. Japan
- 5.4. South Korea
- 5.5. ASEAN
- 5.6. Oceania
- 5.7. Rest of Asia Pacific
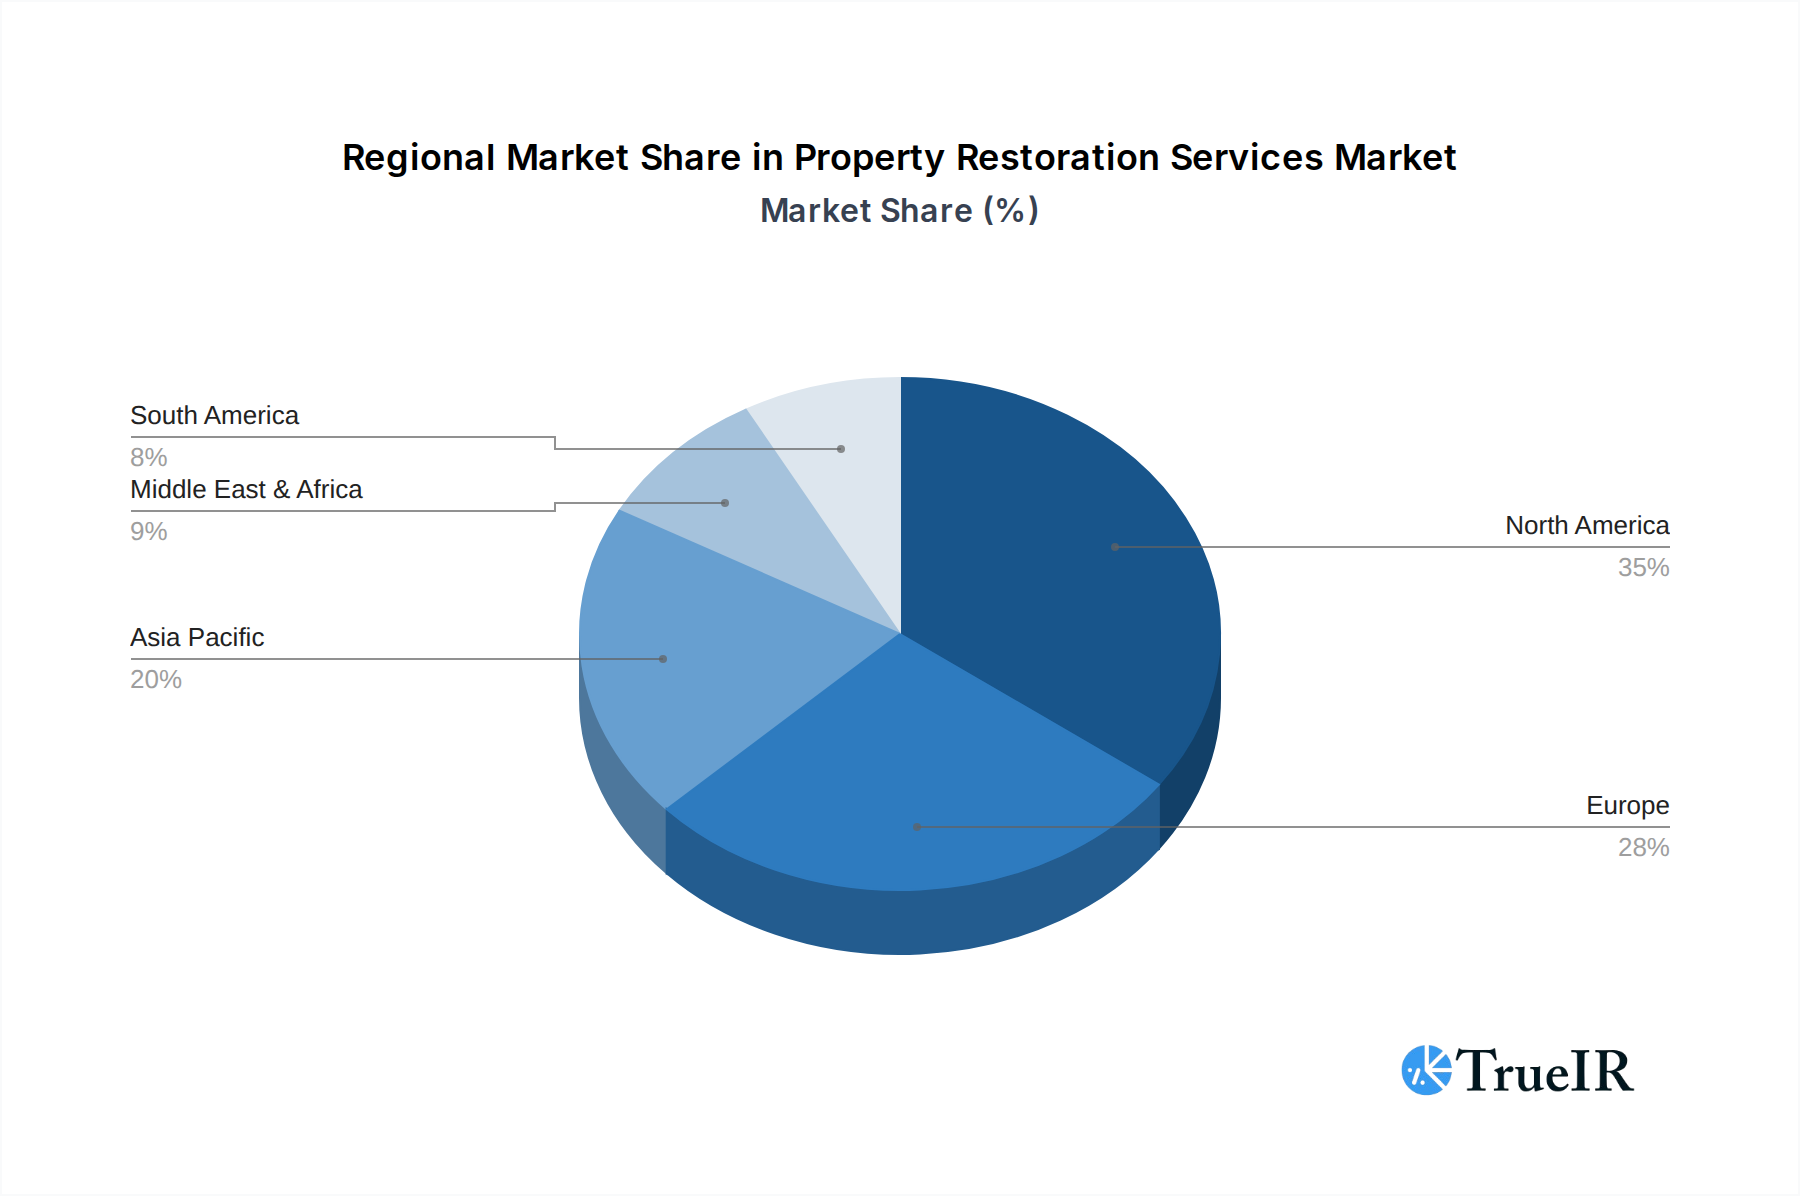
Property Restoration Services Regional Market Share
Geographic Coverage of Property Restoration Services
Property Restoration Services REPORT HIGHLIGHTS
| Aspects | Details |
|---|---|
| Study Period | 2020-2034 |
| Base Year | 2025 |
| Estimated Year | 2026 |
| Forecast Period | 2026-2034 |
| Historical Period | 2020-2025 |
| Growth Rate | CAGR of 6% from 2020-2034 |
| Segmentation |
|
Table of Contents
- 1. Introduction
- 1.1. Research Scope
- 1.2. Market Segmentation
- 1.3. Research Methodology
- 1.4. Definitions and Assumptions
- 2. Executive Summary
- 2.1. Introduction
- 3. Market Dynamics
- 3.1. Introduction
- 3.2. Market Drivers
- 3.3. Market Restrains
- 3.4. Market Trends
- 4. Market Factor Analysis
- 4.1. Porters Five Forces
- 4.2. Supply/Value Chain
- 4.3. PESTEL analysis
- 4.4. Market Entropy
- 4.5. Patent/Trademark Analysis
- 5. Global Property Restoration Services Analysis, Insights and Forecast, 2020-2032
- 5.1. Market Analysis, Insights and Forecast - by Application
- 5.1.1. Personal Property
- 5.1.2. Public Property
- 5.2. Market Analysis, Insights and Forecast - by Types
- 5.2.1. Fire and Smoke Damage Restoration
- 5.2.2. Water Damage Damage Restoration
- 5.2.3. Wind, Hurricane, and Tornado Damage Restorations
- 5.2.4. Others
- 5.3. Market Analysis, Insights and Forecast - by Region
- 5.3.1. North America
- 5.3.2. South America
- 5.3.3. Europe
- 5.3.4. Middle East & Africa
- 5.3.5. Asia Pacific
- 5.1. Market Analysis, Insights and Forecast - by Application
- 6. North America Property Restoration Services Analysis, Insights and Forecast, 2020-2032
- 6.1. Market Analysis, Insights and Forecast - by Application
- 6.1.1. Personal Property
- 6.1.2. Public Property
- 6.2. Market Analysis, Insights and Forecast - by Types
- 6.2.1. Fire and Smoke Damage Restoration
- 6.2.2. Water Damage Damage Restoration
- 6.2.3. Wind, Hurricane, and Tornado Damage Restorations
- 6.2.4. Others
- 6.1. Market Analysis, Insights and Forecast - by Application
- 7. South America Property Restoration Services Analysis, Insights and Forecast, 2020-2032
- 7.1. Market Analysis, Insights and Forecast - by Application
- 7.1.1. Personal Property
- 7.1.2. Public Property
- 7.2. Market Analysis, Insights and Forecast - by Types
- 7.2.1. Fire and Smoke Damage Restoration
- 7.2.2. Water Damage Damage Restoration
- 7.2.3. Wind, Hurricane, and Tornado Damage Restorations
- 7.2.4. Others
- 7.1. Market Analysis, Insights and Forecast - by Application
- 8. Europe Property Restoration Services Analysis, Insights and Forecast, 2020-2032
- 8.1. Market Analysis, Insights and Forecast - by Application
- 8.1.1. Personal Property
- 8.1.2. Public Property
- 8.2. Market Analysis, Insights and Forecast - by Types
- 8.2.1. Fire and Smoke Damage Restoration
- 8.2.2. Water Damage Damage Restoration
- 8.2.3. Wind, Hurricane, and Tornado Damage Restorations
- 8.2.4. Others
- 8.1. Market Analysis, Insights and Forecast - by Application
- 9. Middle East & Africa Property Restoration Services Analysis, Insights and Forecast, 2020-2032
- 9.1. Market Analysis, Insights and Forecast - by Application
- 9.1.1. Personal Property
- 9.1.2. Public Property
- 9.2. Market Analysis, Insights and Forecast - by Types
- 9.2.1. Fire and Smoke Damage Restoration
- 9.2.2. Water Damage Damage Restoration
- 9.2.3. Wind, Hurricane, and Tornado Damage Restorations
- 9.2.4. Others
- 9.1. Market Analysis, Insights and Forecast - by Application
- 10. Asia Pacific Property Restoration Services Analysis, Insights and Forecast, 2020-2032
- 10.1. Market Analysis, Insights and Forecast - by Application
- 10.1.1. Personal Property
- 10.1.2. Public Property
- 10.2. Market Analysis, Insights and Forecast - by Types
- 10.2.1. Fire and Smoke Damage Restoration
- 10.2.2. Water Damage Damage Restoration
- 10.2.3. Wind, Hurricane, and Tornado Damage Restorations
- 10.2.4. Others
- 10.1. Market Analysis, Insights and Forecast - by Application
- 11. Competitive Analysis
- 11.1. Global Market Share Analysis 2025
- 11.2. Company Profiles
- 11.2.1 Steamatic
- 11.2.1.1. Overview
- 11.2.1.2. Products
- 11.2.1.3. SWOT Analysis
- 11.2.1.4. Recent Developments
- 11.2.1.5. Financials (Based on Availability)
- 11.2.2 Rainbow Restoration
- 11.2.2.1. Overview
- 11.2.2.2. Products
- 11.2.2.3. SWOT Analysis
- 11.2.2.4. Recent Developments
- 11.2.2.5. Financials (Based on Availability)
- 11.2.3 Blackmon Mooring & BMS CAT
- 11.2.3.1. Overview
- 11.2.3.2. Products
- 11.2.3.3. SWOT Analysis
- 11.2.3.4. Recent Developments
- 11.2.3.5. Financials (Based on Availability)
- 11.2.4 BELFOR
- 11.2.4.1. Overview
- 11.2.4.2. Products
- 11.2.4.3. SWOT Analysis
- 11.2.4.4. Recent Developments
- 11.2.4.5. Financials (Based on Availability)
- 11.2.5 GDI Integrated Facility Services
- 11.2.5.1. Overview
- 11.2.5.2. Products
- 11.2.5.3. SWOT Analysis
- 11.2.5.4. Recent Developments
- 11.2.5.5. Financials (Based on Availability)
- 11.2.6 Servpro
- 11.2.6.1. Overview
- 11.2.6.2. Products
- 11.2.6.3. SWOT Analysis
- 11.2.6.4. Recent Developments
- 11.2.6.5. Financials (Based on Availability)
- 11.2.7 Duraclean
- 11.2.7.1. Overview
- 11.2.7.2. Products
- 11.2.7.3. SWOT Analysis
- 11.2.7.4. Recent Developments
- 11.2.7.5. Financials (Based on Availability)
- 11.2.8 Paul Davis Restoration
- 11.2.8.1. Overview
- 11.2.8.2. Products
- 11.2.8.3. SWOT Analysis
- 11.2.8.4. Recent Developments
- 11.2.8.5. Financials (Based on Availability)
- 11.2.9 PuroClean
- 11.2.9.1. Overview
- 11.2.9.2. Products
- 11.2.9.3. SWOT Analysis
- 11.2.9.4. Recent Developments
- 11.2.9.5. Financials (Based on Availability)
- 11.2.10 911 Restoration
- 11.2.10.1. Overview
- 11.2.10.2. Products
- 11.2.10.3. SWOT Analysis
- 11.2.10.4. Recent Developments
- 11.2.10.5. Financials (Based on Availability)
- 11.2.11 Restoration 1
- 11.2.11.1. Overview
- 11.2.11.2. Products
- 11.2.11.3. SWOT Analysis
- 11.2.11.4. Recent Developments
- 11.2.11.5. Financials (Based on Availability)
- 11.2.12 DKI Restoration
- 11.2.12.1. Overview
- 11.2.12.2. Products
- 11.2.12.3. SWOT Analysis
- 11.2.12.4. Recent Developments
- 11.2.12.5. Financials (Based on Availability)
- 11.2.13 Elite Disaster Restoration
- 11.2.13.1. Overview
- 11.2.13.2. Products
- 11.2.13.3. SWOT Analysis
- 11.2.13.4. Recent Developments
- 11.2.13.5. Financials (Based on Availability)
- 11.2.1 Steamatic
List of Figures
- Figure 1: Global Property Restoration Services Revenue Breakdown (undefined, %) by Region 2025 & 2033
- Figure 2: North America Property Restoration Services Revenue (undefined), by Application 2025 & 2033
- Figure 3: North America Property Restoration Services Revenue Share (%), by Application 2025 & 2033
- Figure 4: North America Property Restoration Services Revenue (undefined), by Types 2025 & 2033
- Figure 5: North America Property Restoration Services Revenue Share (%), by Types 2025 & 2033
- Figure 6: North America Property Restoration Services Revenue (undefined), by Country 2025 & 2033
- Figure 7: North America Property Restoration Services Revenue Share (%), by Country 2025 & 2033
- Figure 8: South America Property Restoration Services Revenue (undefined), by Application 2025 & 2033
- Figure 9: South America Property Restoration Services Revenue Share (%), by Application 2025 & 2033
- Figure 10: South America Property Restoration Services Revenue (undefined), by Types 2025 & 2033
- Figure 11: South America Property Restoration Services Revenue Share (%), by Types 2025 & 2033
- Figure 12: South America Property Restoration Services Revenue (undefined), by Country 2025 & 2033
- Figure 13: South America Property Restoration Services Revenue Share (%), by Country 2025 & 2033
- Figure 14: Europe Property Restoration Services Revenue (undefined), by Application 2025 & 2033
- Figure 15: Europe Property Restoration Services Revenue Share (%), by Application 2025 & 2033
- Figure 16: Europe Property Restoration Services Revenue (undefined), by Types 2025 & 2033
- Figure 17: Europe Property Restoration Services Revenue Share (%), by Types 2025 & 2033
- Figure 18: Europe Property Restoration Services Revenue (undefined), by Country 2025 & 2033
- Figure 19: Europe Property Restoration Services Revenue Share (%), by Country 2025 & 2033
- Figure 20: Middle East & Africa Property Restoration Services Revenue (undefined), by Application 2025 & 2033
- Figure 21: Middle East & Africa Property Restoration Services Revenue Share (%), by Application 2025 & 2033
- Figure 22: Middle East & Africa Property Restoration Services Revenue (undefined), by Types 2025 & 2033
- Figure 23: Middle East & Africa Property Restoration Services Revenue Share (%), by Types 2025 & 2033
- Figure 24: Middle East & Africa Property Restoration Services Revenue (undefined), by Country 2025 & 2033
- Figure 25: Middle East & Africa Property Restoration Services Revenue Share (%), by Country 2025 & 2033
- Figure 26: Asia Pacific Property Restoration Services Revenue (undefined), by Application 2025 & 2033
- Figure 27: Asia Pacific Property Restoration Services Revenue Share (%), by Application 2025 & 2033
- Figure 28: Asia Pacific Property Restoration Services Revenue (undefined), by Types 2025 & 2033
- Figure 29: Asia Pacific Property Restoration Services Revenue Share (%), by Types 2025 & 2033
- Figure 30: Asia Pacific Property Restoration Services Revenue (undefined), by Country 2025 & 2033
- Figure 31: Asia Pacific Property Restoration Services Revenue Share (%), by Country 2025 & 2033
List of Tables
- Table 1: Global Property Restoration Services Revenue undefined Forecast, by Application 2020 & 2033
- Table 2: Global Property Restoration Services Revenue undefined Forecast, by Types 2020 & 2033
- Table 3: Global Property Restoration Services Revenue undefined Forecast, by Region 2020 & 2033
- Table 4: Global Property Restoration Services Revenue undefined Forecast, by Application 2020 & 2033
- Table 5: Global Property Restoration Services Revenue undefined Forecast, by Types 2020 & 2033
- Table 6: Global Property Restoration Services Revenue undefined Forecast, by Country 2020 & 2033
- Table 7: United States Property Restoration Services Revenue (undefined) Forecast, by Application 2020 & 2033
- Table 8: Canada Property Restoration Services Revenue (undefined) Forecast, by Application 2020 & 2033
- Table 9: Mexico Property Restoration Services Revenue (undefined) Forecast, by Application 2020 & 2033
- Table 10: Global Property Restoration Services Revenue undefined Forecast, by Application 2020 & 2033
- Table 11: Global Property Restoration Services Revenue undefined Forecast, by Types 2020 & 2033
- Table 12: Global Property Restoration Services Revenue undefined Forecast, by Country 2020 & 2033
- Table 13: Brazil Property Restoration Services Revenue (undefined) Forecast, by Application 2020 & 2033
- Table 14: Argentina Property Restoration Services Revenue (undefined) Forecast, by Application 2020 & 2033
- Table 15: Rest of South America Property Restoration Services Revenue (undefined) Forecast, by Application 2020 & 2033
- Table 16: Global Property Restoration Services Revenue undefined Forecast, by Application 2020 & 2033
- Table 17: Global Property Restoration Services Revenue undefined Forecast, by Types 2020 & 2033
- Table 18: Global Property Restoration Services Revenue undefined Forecast, by Country 2020 & 2033
- Table 19: United Kingdom Property Restoration Services Revenue (undefined) Forecast, by Application 2020 & 2033
- Table 20: Germany Property Restoration Services Revenue (undefined) Forecast, by Application 2020 & 2033
- Table 21: France Property Restoration Services Revenue (undefined) Forecast, by Application 2020 & 2033
- Table 22: Italy Property Restoration Services Revenue (undefined) Forecast, by Application 2020 & 2033
- Table 23: Spain Property Restoration Services Revenue (undefined) Forecast, by Application 2020 & 2033
- Table 24: Russia Property Restoration Services Revenue (undefined) Forecast, by Application 2020 & 2033
- Table 25: Benelux Property Restoration Services Revenue (undefined) Forecast, by Application 2020 & 2033
- Table 26: Nordics Property Restoration Services Revenue (undefined) Forecast, by Application 2020 & 2033
- Table 27: Rest of Europe Property Restoration Services Revenue (undefined) Forecast, by Application 2020 & 2033
- Table 28: Global Property Restoration Services Revenue undefined Forecast, by Application 2020 & 2033
- Table 29: Global Property Restoration Services Revenue undefined Forecast, by Types 2020 & 2033
- Table 30: Global Property Restoration Services Revenue undefined Forecast, by Country 2020 & 2033
- Table 31: Turkey Property Restoration Services Revenue (undefined) Forecast, by Application 2020 & 2033
- Table 32: Israel Property Restoration Services Revenue (undefined) Forecast, by Application 2020 & 2033
- Table 33: GCC Property Restoration Services Revenue (undefined) Forecast, by Application 2020 & 2033
- Table 34: North Africa Property Restoration Services Revenue (undefined) Forecast, by Application 2020 & 2033
- Table 35: South Africa Property Restoration Services Revenue (undefined) Forecast, by Application 2020 & 2033
- Table 36: Rest of Middle East & Africa Property Restoration Services Revenue (undefined) Forecast, by Application 2020 & 2033
- Table 37: Global Property Restoration Services Revenue undefined Forecast, by Application 2020 & 2033
- Table 38: Global Property Restoration Services Revenue undefined Forecast, by Types 2020 & 2033
- Table 39: Global Property Restoration Services Revenue undefined Forecast, by Country 2020 & 2033
- Table 40: China Property Restoration Services Revenue (undefined) Forecast, by Application 2020 & 2033
- Table 41: India Property Restoration Services Revenue (undefined) Forecast, by Application 2020 & 2033
- Table 42: Japan Property Restoration Services Revenue (undefined) Forecast, by Application 2020 & 2033
- Table 43: South Korea Property Restoration Services Revenue (undefined) Forecast, by Application 2020 & 2033
- Table 44: ASEAN Property Restoration Services Revenue (undefined) Forecast, by Application 2020 & 2033
- Table 45: Oceania Property Restoration Services Revenue (undefined) Forecast, by Application 2020 & 2033
- Table 46: Rest of Asia Pacific Property Restoration Services Revenue (undefined) Forecast, by Application 2020 & 2033
Frequently Asked Questions
1. What is the projected Compound Annual Growth Rate (CAGR) of the Property Restoration Services?
The projected CAGR is approximately 6%.
2. Which companies are prominent players in the Property Restoration Services?
Key companies in the market include Steamatic, Rainbow Restoration, Blackmon Mooring & BMS CAT, BELFOR, GDI Integrated Facility Services, Servpro, Duraclean, Paul Davis Restoration, PuroClean, 911 Restoration, Restoration 1, DKI Restoration, Elite Disaster Restoration.
3. What are the main segments of the Property Restoration Services?
The market segments include Application, Types.
4. Can you provide details about the market size?
The market size is estimated to be USD XXX N/A as of 2022.
5. What are some drivers contributing to market growth?
N/A
6. What are the notable trends driving market growth?
N/A
7. Are there any restraints impacting market growth?
N/A
8. Can you provide examples of recent developments in the market?
N/A
9. What pricing options are available for accessing the report?
Pricing options include single-user, multi-user, and enterprise licenses priced at USD 4900.00, USD 7350.00, and USD 9800.00 respectively.
10. Is the market size provided in terms of value or volume?
The market size is provided in terms of value, measured in N/A.
11. Are there any specific market keywords associated with the report?
Yes, the market keyword associated with the report is "Property Restoration Services," which aids in identifying and referencing the specific market segment covered.
12. How do I determine which pricing option suits my needs best?
The pricing options vary based on user requirements and access needs. Individual users may opt for single-user licenses, while businesses requiring broader access may choose multi-user or enterprise licenses for cost-effective access to the report.
13. Are there any additional resources or data provided in the Property Restoration Services report?
While the report offers comprehensive insights, it's advisable to review the specific contents or supplementary materials provided to ascertain if additional resources or data are available.
14. How can I stay updated on further developments or reports in the Property Restoration Services?
To stay informed about further developments, trends, and reports in the Property Restoration Services, consider subscribing to industry newsletters, following relevant companies and organizations, or regularly checking reputable industry news sources and publications.
Methodology
Step 1 - Identification of Relevant Samples Size from Population Database


Step 2 - Approaches for Defining Global Market Size (Value, Volume* & Price*)

Note*: In applicable scenarios
Step 3 - Data Sources
Primary Research
- Web Analytics
- Survey Reports
- Research Institute
- Latest Research Reports
- Opinion Leaders
Secondary Research
- Annual Reports
- White Paper
- Latest Press Release
- Industry Association
- Paid Database
- Investor Presentations

Step 4 - Data Triangulation
Involves using different sources of information in order to increase the validity of a study
These sources are likely to be stakeholders in a program - participants, other researchers, program staff, other community members, and so on.
Then we put all data in single framework & apply various statistical tools to find out the dynamic on the market.
During the analysis stage, feedback from the stakeholder groups would be compared to determine areas of agreement as well as areas of divergence