

Key Insights
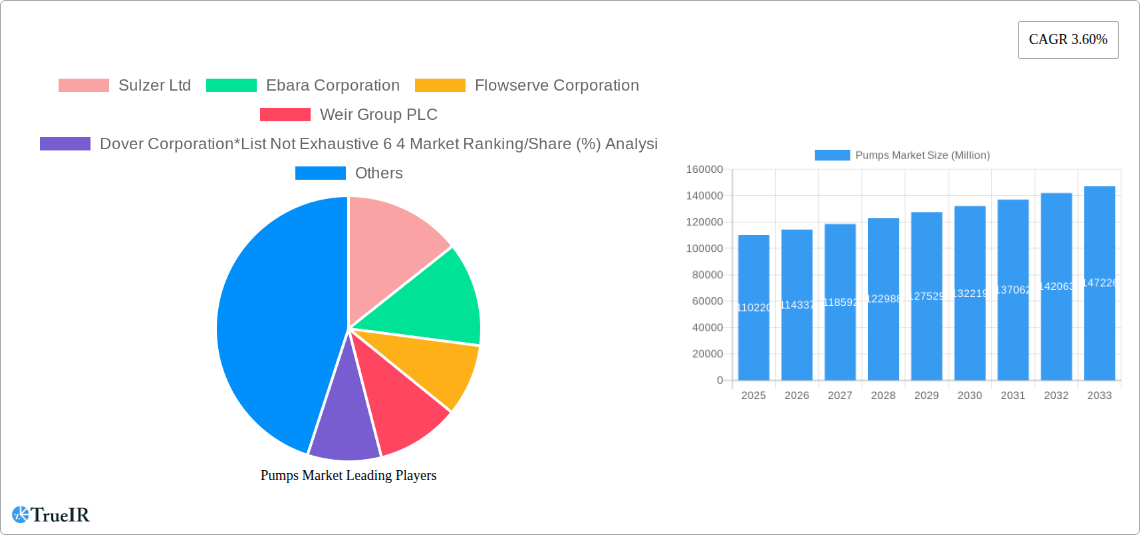
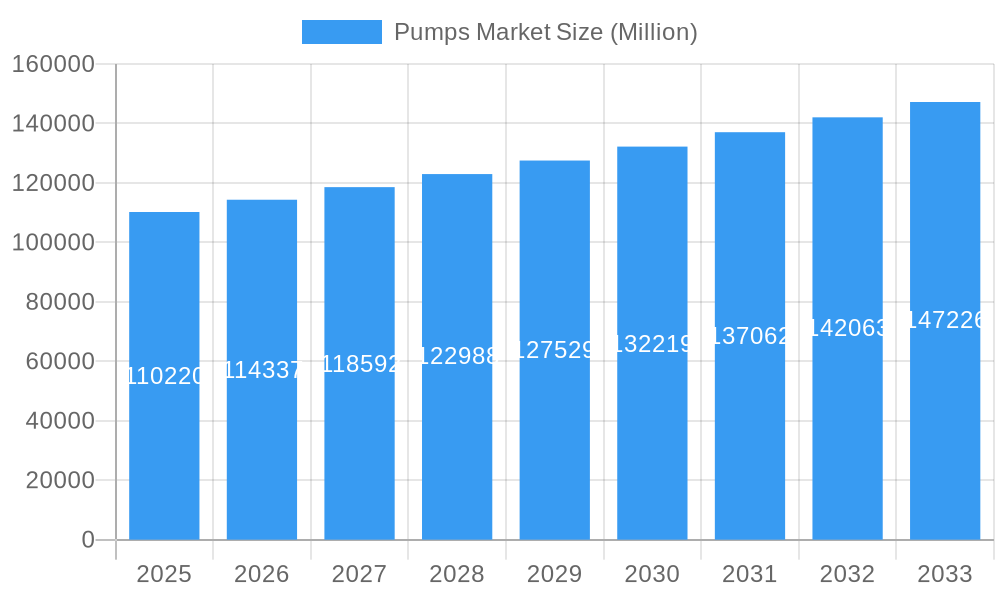
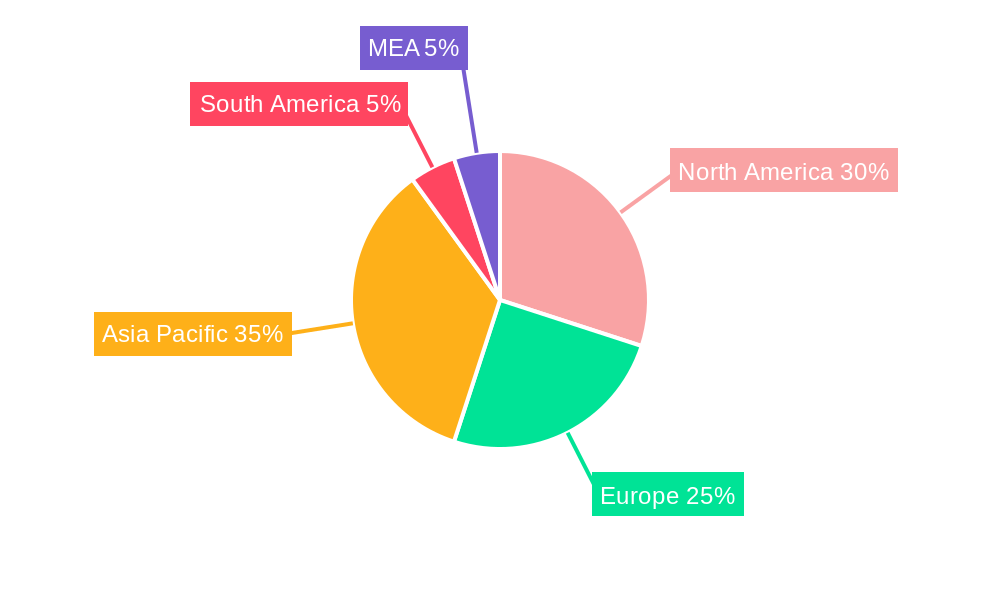
The global pumps market, valued at $110.22 billion in 2025, is projected to experience steady growth, driven by increasing industrialization, infrastructure development, and rising demand across diverse sectors. A compound annual growth rate (CAGR) of 3.60% from 2025 to 2033 indicates a substantial market expansion. Key drivers include the burgeoning oil and gas industry, the need for efficient water and wastewater management solutions, and the growth of the chemical and petrochemical sectors. Furthermore, rising investments in renewable energy sources, particularly power generation, are fueling demand for specialized pumps. Market segmentation reveals significant contributions from centrifugal pumps and positive displacement pumps, catering to the specific needs of various end-users. Geographic analysis shows strong growth potential across North America, Europe, and the Asia-Pacific region, driven by robust economic activity and infrastructural projects in these areas. Competitive dynamics are shaped by major players like Sulzer Ltd, Ebara Corporation, and Flowserve Corporation, among others, which are actively investing in research and development to enhance pump efficiency and introduce innovative solutions. However, fluctuating raw material prices and stringent environmental regulations pose potential challenges to market growth.
Pumps Market Market Size (In Billion)
The continued expansion of the pumps market is expected to be influenced by several factors. Technological advancements, such as the development of smart pumps with improved energy efficiency and remote monitoring capabilities, are expected to drive demand. Furthermore, increasing focus on sustainable practices within industries will lead to greater adoption of eco-friendly pumps. The market will likely witness consolidation through mergers and acquisitions, as companies strive to expand their market share and product portfolios. Regional variations in growth will depend on factors such as economic conditions, government regulations, and infrastructure development plans. The increasing adoption of digital technologies and Industry 4.0 principles is likely to enhance the efficiency and productivity of pump manufacturing and operations, further impacting the market's trajectory. Understanding these dynamics is crucial for businesses seeking to navigate the complexities and capitalize on the growth opportunities within this vital sector.
Pumps Market Company Market Share
Pumps Market: A Comprehensive Market Analysis Report (2019-2033)
This dynamic report provides a detailed analysis of the global Pumps Market, offering invaluable insights for businesses, investors, and industry stakeholders. Leveraging extensive data from 2019 to 2024 (Historical Period), with a focus on the Base Year 2025 and a forecast extending to 2033 (Forecast Period), this study unveils the market's current state and future trajectory. The report covers a market valued at xx Million in 2025, projected to reach xx Million by 2033, exhibiting a robust CAGR of xx%.
Pumps Market Structure & Competitive Landscape
The Pumps Market is characterized by a moderately concentrated landscape, with a few dominant players controlling a significant market share. The top 6 players – Sulzer Ltd, Ebara Corporation, Flowserve Corporation, Weir Group PLC, Dover Corporation, and Grundfos Holding AS – collectively account for approximately xx% of the global market share in 2025, as per our analysis. This concentration is influenced by factors such as high capital expenditure requirements for R&D, manufacturing, and global distribution networks.
Market Concentration: The Herfindahl-Hirschman Index (HHI) for the market is estimated at xx, suggesting a moderately concentrated market structure. This concentration is expected to slightly decrease over the forecast period due to the entry of new players and increased competition, especially in niche segments.
Innovation Drivers: Continuous technological advancements, specifically in materials science, automation, and digitalization, are key drivers. The development of energy-efficient pumps and smart pumps with predictive maintenance capabilities is transforming the industry.
Regulatory Impacts: Stringent environmental regulations concerning energy efficiency and emissions are shaping product development and market dynamics, pushing manufacturers to innovate and adopt sustainable practices.
Product Substitutes: While direct substitutes are limited, alternative technologies such as air-powered pumps and other fluid handling methods pose some level of competitive pressure, depending on the specific application.
End-User Segmentation: The market is broadly segmented into Oil and Gas, Water and Wastewater, Chemicals and Petrochemicals, Mining Industry, Power Generation, and Other End Users. Each segment presents unique growth opportunities driven by specific industry-related factors.
M&A Trends: The market has witnessed significant M&A activity in recent years, with several companies acquiring smaller players to expand their product portfolio and geographical reach. The volume of M&A deals is estimated to have reached xx Million USD in 2024.
Pumps Market Trends & Opportunities
The Pumps Market is poised for substantial growth driven by several key trends. Increasing industrialization and urbanization across emerging economies are fueling demand for pumps across various sectors. The global shift towards sustainable energy sources is also driving demand for energy-efficient pumps. Technological advancements, particularly in smart pumps and IoT-enabled systems, are further enhancing market growth potential.
Market size growth is projected to be fueled by rising investments in infrastructure development, particularly in water management and energy sectors. The increasing adoption of centrifugal pumps in various industrial applications further contributes to the market's growth trajectory. Technological shifts towards higher efficiency, smart functionalities and digitalization are creating lucrative opportunities for market players. The report also identifies changing consumer preferences, specifically for sustainable and energy-efficient products, as another significant growth driver.
Competitive dynamics are influencing market share gains and technological advancements. Established players are focused on innovation, strategic partnerships, and geographic expansion to maintain their market positions, while smaller players are leveraging niche expertise and technological innovation to compete effectively. The market penetration rate for smart pumps is predicted to increase significantly during the forecast period, exceeding xx% by 2033.
Dominant Markets & Segments in Pumps Market
Dominant Regions: The [Region Name] region currently holds the largest market share, driven by robust infrastructure development and industrial growth. Other regions, such as [Region Name] and [Region Name], are also exhibiting strong growth potential, creating a geographically diverse market landscape.
Dominant End-User Segments:
- Oil and Gas: High demand for pumps in upstream, midstream, and downstream operations, driven by increasing global energy demand.
- Water and Wastewater: Expanding investments in water infrastructure and treatment facilities contribute significantly to this segment's growth.
- Chemicals and Petrochemicals: The need for efficient fluid handling in chemical processing plants and refineries fuels the demand for specialized pumps.
Dominant Pump Types:
- Centrifugal Pumps: Their versatility and cost-effectiveness contribute to their high market share across various applications.
- Positive Displacement Pumps: The need for precise fluid handling in specific applications, such as chemical processing and pharmaceuticals, drives growth in this segment.
Key Growth Drivers:
- Increased government investments in water and wastewater infrastructure projects.
- Growing demand for energy-efficient pumps due to rising environmental concerns.
- Expansion of chemical and petrochemical industries in emerging economies.
- Technological advancements in pump design and manufacturing leading to improved efficiency and reliability.
Pumps Market Product Analysis
Recent innovations in pumps focus on enhancing energy efficiency, reducing maintenance needs, and improving reliability. The integration of smart technologies, such as sensors and data analytics, allows for predictive maintenance and real-time monitoring of pump performance. These advancements cater to the increasing demand for reliable, cost-effective, and environmentally friendly solutions across various industries. The market increasingly favors pumps with enhanced durability, improved material selection for specific applications, and advanced control systems for optimized operation.
Key Drivers, Barriers & Challenges in Pumps Market
Key Drivers: Rising industrialization, increased demand for water treatment solutions, and advancements in automation and digitalization are major catalysts for market growth. Government initiatives promoting energy efficiency and sustainable development further propel the market. For example, the recent [Specific Policy/Initiative Name] in [Country Name] has significantly boosted demand for energy-efficient pumps.
Challenges: Supply chain disruptions, especially in the procurement of raw materials, pose a significant challenge to market expansion. Furthermore, stringent regulatory compliance requirements, particularly environmental regulations, increase production costs and impact profitability. Intense competition from established and emerging players further complicates market dynamics. For instance, xx% of manufacturers reported significant supply chain delays in 2024, resulting in xx Million USD of lost revenue.
Growth Drivers in the Pumps Market Market
Several factors contribute to the robust growth of the pumps market. The rising demand across diverse industries, coupled with technological innovation, drives market expansion. Governments' emphasis on infrastructure development and water management also plays a significant role. Finally, increasing environmental concerns, which are leading to stricter regulations, are shaping the demand for energy-efficient pump technologies.
Challenges Impacting Pumps Market Growth
The pumps market faces challenges like fluctuating raw material prices, intensifying competition, and the need for continuous technological upgrades. Moreover, supply chain disruptions, particularly after the [Event leading to disruption], remain a significant concern for many manufacturers. Additionally, compliance with stringent environmental regulations adds to the operational costs.
Key Players Shaping the Pumps Market Market
- Sulzer Ltd
- Ebara Corporation
- Flowserve Corporation
- Weir Group PLC
- Dover Corporation
- Clyde Union Inc
- Schlumberger Ltd
- KSB SE & Co KGaA
- ITT Inc
- Grundfos Holding AS
- Baker Hughes Company
Significant Pumps Market Industry Milestones
- December 2023: The Packo Pumps website merged with the Verder Liquids website, expanding the product portfolio and market reach.
- May 2023: ClydeUnion Pumps secured a significant service agreement with ONGC in India, boosting its service business.
- February 2023: Motion & Control Enterprises acquired Precision Pump & Valve, enhancing its capabilities in the oil and gas sector.
Future Outlook for Pumps Market Market
The Pumps Market is poised for continued growth, fueled by ongoing industrialization, rising infrastructure investments, and the increasing adoption of energy-efficient and smart pump technologies. Strategic partnerships, technological advancements, and expansion into emerging markets represent key opportunities for market players to enhance their competitiveness and capture significant market share. The market is expected to witness a steady rise in demand for customized and specialized pump solutions, further driving growth and innovation.
Pumps Market Segmentation
-
1. Type
- 1.1. Centrifugal Pump
- 1.2. Positive Displacement Pump
-
2. End User
- 2.1. Oil and Gas
- 2.2. Water and Wastewater
- 2.3. Chemicals and Petrochemicals
- 2.4. Mining Industry
- 2.5. Power Generation
- 2.6. Other End Users
Pumps Market Segmentation By Geography
-
1. North America
- 1.1. United States
- 1.2. Canada
- 1.3. Rest of North America
-
2. Europe
- 2.1. Germany
- 2.2. France
- 2.3. Spain
- 2.4. United Kingdom
- 2.5. Russia
- 2.6. NORDIC
- 2.7. Italy
- 2.8. Turkey
- 2.9. Rest of Europe
-
3. Asia Pacific
- 3.1. China
- 3.2. India
- 3.3. Japan
- 3.4. South Korea
- 3.5. Australia
- 3.6. Malaysia
- 3.7. Thailand
- 3.8. Indonesia
- 3.9. Vietnam
- 3.10. Rest of Asia Pacific
-
4. South America
- 4.1. Brazil
- 4.2. Argentina
- 4.3. Colombia
- 4.4. Rest of South America
-
5. Middle East and Africa
- 5.1. Saudi Arabia
- 5.2. United Arab Emirates
- 5.3. South Africa
- 5.4. Nigeria
- 5.5. Qatar
- 5.6. Egypt
- 5.7. Rest of the Middle East and Africa
Pumps Market Regional Market Share
Geographic Coverage of Pumps Market
Pumps Market REPORT HIGHLIGHTS
| Aspects | Details |
|---|---|
| Study Period | 2020-2034 |
| Base Year | 2025 |
| Estimated Year | 2026 |
| Forecast Period | 2026-2034 |
| Historical Period | 2020-2025 |
| Growth Rate | CAGR of 3.60% from 2020-2034 |
| Segmentation |
|
Table of Contents
- 1. Introduction
- 1.1. Research Scope
- 1.2. Market Segmentation
- 1.3. Research Objective
- 1.4. Definitions and Assumptions
- 2. Executive Summary
- 2.1. Market Snapshot
- 3. Market Dynamics
- 3.1. Market Drivers
- 3.2. Market Restrains
- 3.3. Market Trends
- 3.4. Market Opportunities
- 4. Market Factor Analysis
- 4.1. Porters Five Forces
- 4.1.1. Bargaining Power of Suppliers
- 4.1.2. Bargaining Power of Buyers
- 4.1.3. Threat of New Entrants
- 4.1.4. Threat of Substitutes
- 4.1.5. Competitive Rivalry
- 4.2. PESTEL analysis
- 4.3. BCG Analysis
- 4.3.1. Stars (High Growth, High Market Share)
- 4.3.2. Cash Cows (Low Growth, High Market Share)
- 4.3.3. Question Mark (High Growth, Low Market Share)
- 4.3.4. Dogs (Low Growth, Low Market Share)
- 4.4. Ansoff Matrix Analysis
- 4.5. Supply Chain Analysis
- 4.6. Regulatory Landscape
- 4.7. Current Market Potential and Opportunity Assessment (TAM–SAM–SOM Framework)
- 4.8. TIR Analyst Note
- 4.1. Porters Five Forces
- 5. Market Analysis, Insights and Forecast 2021-2033
- 5.1. Market Analysis, Insights and Forecast - by Type
- 5.1.1. Centrifugal Pump
- 5.1.2. Positive Displacement Pump
- 5.2. Market Analysis, Insights and Forecast - by End User
- 5.2.1. Oil and Gas
- 5.2.2. Water and Wastewater
- 5.2.3. Chemicals and Petrochemicals
- 5.2.4. Mining Industry
- 5.2.5. Power Generation
- 5.2.6. Other End Users
- 5.3. Market Analysis, Insights and Forecast - by Region
- 5.3.1. North America
- 5.3.2. Europe
- 5.3.3. Asia Pacific
- 5.3.4. South America
- 5.3.5. Middle East and Africa
- 5.1. Market Analysis, Insights and Forecast - by Type
- 6. Global Pumps Market Analysis, Insights and Forecast, 2021-2033
- 6.1. Market Analysis, Insights and Forecast - by Type
- 6.1.1. Centrifugal Pump
- 6.1.2. Positive Displacement Pump
- 6.2. Market Analysis, Insights and Forecast - by End User
- 6.2.1. Oil and Gas
- 6.2.2. Water and Wastewater
- 6.2.3. Chemicals and Petrochemicals
- 6.2.4. Mining Industry
- 6.2.5. Power Generation
- 6.2.6. Other End Users
- 6.1. Market Analysis, Insights and Forecast - by Type
- 7. North America Pumps Market Analysis, Insights and Forecast, 2020-2032
- 7.1. Market Analysis, Insights and Forecast - by Type
- 7.1.1. Centrifugal Pump
- 7.1.2. Positive Displacement Pump
- 7.2. Market Analysis, Insights and Forecast - by End User
- 7.2.1. Oil and Gas
- 7.2.2. Water and Wastewater
- 7.2.3. Chemicals and Petrochemicals
- 7.2.4. Mining Industry
- 7.2.5. Power Generation
- 7.2.6. Other End Users
- 7.1. Market Analysis, Insights and Forecast - by Type
- 8. Europe Pumps Market Analysis, Insights and Forecast, 2020-2032
- 8.1. Market Analysis, Insights and Forecast - by Type
- 8.1.1. Centrifugal Pump
- 8.1.2. Positive Displacement Pump
- 8.2. Market Analysis, Insights and Forecast - by End User
- 8.2.1. Oil and Gas
- 8.2.2. Water and Wastewater
- 8.2.3. Chemicals and Petrochemicals
- 8.2.4. Mining Industry
- 8.2.5. Power Generation
- 8.2.6. Other End Users
- 8.1. Market Analysis, Insights and Forecast - by Type
- 9. Asia Pacific Pumps Market Analysis, Insights and Forecast, 2020-2032
- 9.1. Market Analysis, Insights and Forecast - by Type
- 9.1.1. Centrifugal Pump
- 9.1.2. Positive Displacement Pump
- 9.2. Market Analysis, Insights and Forecast - by End User
- 9.2.1. Oil and Gas
- 9.2.2. Water and Wastewater
- 9.2.3. Chemicals and Petrochemicals
- 9.2.4. Mining Industry
- 9.2.5. Power Generation
- 9.2.6. Other End Users
- 9.1. Market Analysis, Insights and Forecast - by Type
- 10. South America Pumps Market Analysis, Insights and Forecast, 2020-2032
- 10.1. Market Analysis, Insights and Forecast - by Type
- 10.1.1. Centrifugal Pump
- 10.1.2. Positive Displacement Pump
- 10.2. Market Analysis, Insights and Forecast - by End User
- 10.2.1. Oil and Gas
- 10.2.2. Water and Wastewater
- 10.2.3. Chemicals and Petrochemicals
- 10.2.4. Mining Industry
- 10.2.5. Power Generation
- 10.2.6. Other End Users
- 10.1. Market Analysis, Insights and Forecast - by Type
- 11. Middle East and Africa Pumps Market Analysis, Insights and Forecast, 2020-2032
- 11.1. Market Analysis, Insights and Forecast - by Type
- 11.1.1. Centrifugal Pump
- 11.1.2. Positive Displacement Pump
- 11.2. Market Analysis, Insights and Forecast - by End User
- 11.2.1. Oil and Gas
- 11.2.2. Water and Wastewater
- 11.2.3. Chemicals and Petrochemicals
- 11.2.4. Mining Industry
- 11.2.5. Power Generation
- 11.2.6. Other End Users
- 11.1. Market Analysis, Insights and Forecast - by Type
- 12. Competitive Analysis
- 12.1. Company Profiles
- 12.1.1 Sulzer Ltd
- 12.1.1.1. Company Overview
- 12.1.1.2. Products
- 12.1.1.3. Company Financials
- 12.1.1.4. SWOT Analysis
- 12.1.2 Ebara Corporation
- 12.1.2.1. Company Overview
- 12.1.2.2. Products
- 12.1.2.3. Company Financials
- 12.1.2.4. SWOT Analysis
- 12.1.3 Flowserve Corporation
- 12.1.3.1. Company Overview
- 12.1.3.2. Products
- 12.1.3.3. Company Financials
- 12.1.3.4. SWOT Analysis
- 12.1.4 Weir Group PLC
- 12.1.4.1. Company Overview
- 12.1.4.2. Products
- 12.1.4.3. Company Financials
- 12.1.4.4. SWOT Analysis
- 12.1.5 Dover Corporation*List Not Exhaustive 6 4 Market Ranking/Share (%) Analysi
- 12.1.5.1. Company Overview
- 12.1.5.2. Products
- 12.1.5.3. Company Financials
- 12.1.5.4. SWOT Analysis
- 12.1.6 Clyde Union Inc
- 12.1.6.1. Company Overview
- 12.1.6.2. Products
- 12.1.6.3. Company Financials
- 12.1.6.4. SWOT Analysis
- 12.1.7 Schlumberger Ltd
- 12.1.7.1. Company Overview
- 12.1.7.2. Products
- 12.1.7.3. Company Financials
- 12.1.7.4. SWOT Analysis
- 12.1.8 KSB SE & Co KGaA
- 12.1.8.1. Company Overview
- 12.1.8.2. Products
- 12.1.8.3. Company Financials
- 12.1.8.4. SWOT Analysis
- 12.1.9 ITT Inc
- 12.1.9.1. Company Overview
- 12.1.9.2. Products
- 12.1.9.3. Company Financials
- 12.1.9.4. SWOT Analysis
- 12.1.10 Grundfos Holding AS
- 12.1.10.1. Company Overview
- 12.1.10.2. Products
- 12.1.10.3. Company Financials
- 12.1.10.4. SWOT Analysis
- 12.1.11 Baker Hughes Company
- 12.1.11.1. Company Overview
- 12.1.11.2. Products
- 12.1.11.3. Company Financials
- 12.1.11.4. SWOT Analysis
- 12.1.1 Sulzer Ltd
- 12.2. Market Entropy
- 12.2.1 Company's Key Areas Served
- 12.2.2 Recent Developments
- 12.3. Company Market Share Analysis 2025
- 12.3.1 Top 5 Companies Market Share Analysis
- 12.3.2 Top 3 Companies Market Share Analysis
- 12.4. List of Potential Customers
- 13. Research Methodology
List of Figures
- Figure 1: Global Pumps Market Revenue Breakdown (Million, %) by Region 2025 & 2033
- Figure 2: Global Pumps Market Volume Breakdown (K Unit, %) by Region 2025 & 2033
- Figure 3: North America Pumps Market Revenue (Million), by Type 2025 & 2033
- Figure 4: North America Pumps Market Volume (K Unit), by Type 2025 & 2033
- Figure 5: North America Pumps Market Revenue Share (%), by Type 2025 & 2033
- Figure 6: North America Pumps Market Volume Share (%), by Type 2025 & 2033
- Figure 7: North America Pumps Market Revenue (Million), by End User 2025 & 2033
- Figure 8: North America Pumps Market Volume (K Unit), by End User 2025 & 2033
- Figure 9: North America Pumps Market Revenue Share (%), by End User 2025 & 2033
- Figure 10: North America Pumps Market Volume Share (%), by End User 2025 & 2033
- Figure 11: North America Pumps Market Revenue (Million), by Country 2025 & 2033
- Figure 12: North America Pumps Market Volume (K Unit), by Country 2025 & 2033
- Figure 13: North America Pumps Market Revenue Share (%), by Country 2025 & 2033
- Figure 14: North America Pumps Market Volume Share (%), by Country 2025 & 2033
- Figure 15: Europe Pumps Market Revenue (Million), by Type 2025 & 2033
- Figure 16: Europe Pumps Market Volume (K Unit), by Type 2025 & 2033
- Figure 17: Europe Pumps Market Revenue Share (%), by Type 2025 & 2033
- Figure 18: Europe Pumps Market Volume Share (%), by Type 2025 & 2033
- Figure 19: Europe Pumps Market Revenue (Million), by End User 2025 & 2033
- Figure 20: Europe Pumps Market Volume (K Unit), by End User 2025 & 2033
- Figure 21: Europe Pumps Market Revenue Share (%), by End User 2025 & 2033
- Figure 22: Europe Pumps Market Volume Share (%), by End User 2025 & 2033
- Figure 23: Europe Pumps Market Revenue (Million), by Country 2025 & 2033
- Figure 24: Europe Pumps Market Volume (K Unit), by Country 2025 & 2033
- Figure 25: Europe Pumps Market Revenue Share (%), by Country 2025 & 2033
- Figure 26: Europe Pumps Market Volume Share (%), by Country 2025 & 2033
- Figure 27: Asia Pacific Pumps Market Revenue (Million), by Type 2025 & 2033
- Figure 28: Asia Pacific Pumps Market Volume (K Unit), by Type 2025 & 2033
- Figure 29: Asia Pacific Pumps Market Revenue Share (%), by Type 2025 & 2033
- Figure 30: Asia Pacific Pumps Market Volume Share (%), by Type 2025 & 2033
- Figure 31: Asia Pacific Pumps Market Revenue (Million), by End User 2025 & 2033
- Figure 32: Asia Pacific Pumps Market Volume (K Unit), by End User 2025 & 2033
- Figure 33: Asia Pacific Pumps Market Revenue Share (%), by End User 2025 & 2033
- Figure 34: Asia Pacific Pumps Market Volume Share (%), by End User 2025 & 2033
- Figure 35: Asia Pacific Pumps Market Revenue (Million), by Country 2025 & 2033
- Figure 36: Asia Pacific Pumps Market Volume (K Unit), by Country 2025 & 2033
- Figure 37: Asia Pacific Pumps Market Revenue Share (%), by Country 2025 & 2033
- Figure 38: Asia Pacific Pumps Market Volume Share (%), by Country 2025 & 2033
- Figure 39: South America Pumps Market Revenue (Million), by Type 2025 & 2033
- Figure 40: South America Pumps Market Volume (K Unit), by Type 2025 & 2033
- Figure 41: South America Pumps Market Revenue Share (%), by Type 2025 & 2033
- Figure 42: South America Pumps Market Volume Share (%), by Type 2025 & 2033
- Figure 43: South America Pumps Market Revenue (Million), by End User 2025 & 2033
- Figure 44: South America Pumps Market Volume (K Unit), by End User 2025 & 2033
- Figure 45: South America Pumps Market Revenue Share (%), by End User 2025 & 2033
- Figure 46: South America Pumps Market Volume Share (%), by End User 2025 & 2033
- Figure 47: South America Pumps Market Revenue (Million), by Country 2025 & 2033
- Figure 48: South America Pumps Market Volume (K Unit), by Country 2025 & 2033
- Figure 49: South America Pumps Market Revenue Share (%), by Country 2025 & 2033
- Figure 50: South America Pumps Market Volume Share (%), by Country 2025 & 2033
- Figure 51: Middle East and Africa Pumps Market Revenue (Million), by Type 2025 & 2033
- Figure 52: Middle East and Africa Pumps Market Volume (K Unit), by Type 2025 & 2033
- Figure 53: Middle East and Africa Pumps Market Revenue Share (%), by Type 2025 & 2033
- Figure 54: Middle East and Africa Pumps Market Volume Share (%), by Type 2025 & 2033
- Figure 55: Middle East and Africa Pumps Market Revenue (Million), by End User 2025 & 2033
- Figure 56: Middle East and Africa Pumps Market Volume (K Unit), by End User 2025 & 2033
- Figure 57: Middle East and Africa Pumps Market Revenue Share (%), by End User 2025 & 2033
- Figure 58: Middle East and Africa Pumps Market Volume Share (%), by End User 2025 & 2033
- Figure 59: Middle East and Africa Pumps Market Revenue (Million), by Country 2025 & 2033
- Figure 60: Middle East and Africa Pumps Market Volume (K Unit), by Country 2025 & 2033
- Figure 61: Middle East and Africa Pumps Market Revenue Share (%), by Country 2025 & 2033
- Figure 62: Middle East and Africa Pumps Market Volume Share (%), by Country 2025 & 2033
List of Tables
- Table 1: Global Pumps Market Revenue Million Forecast, by Type 2020 & 2033
- Table 2: Global Pumps Market Volume K Unit Forecast, by Type 2020 & 2033
- Table 3: Global Pumps Market Revenue Million Forecast, by End User 2020 & 2033
- Table 4: Global Pumps Market Volume K Unit Forecast, by End User 2020 & 2033
- Table 5: Global Pumps Market Revenue Million Forecast, by Region 2020 & 2033
- Table 6: Global Pumps Market Volume K Unit Forecast, by Region 2020 & 2033
- Table 7: Global Pumps Market Revenue Million Forecast, by Type 2020 & 2033
- Table 8: Global Pumps Market Volume K Unit Forecast, by Type 2020 & 2033
- Table 9: Global Pumps Market Revenue Million Forecast, by End User 2020 & 2033
- Table 10: Global Pumps Market Volume K Unit Forecast, by End User 2020 & 2033
- Table 11: Global Pumps Market Revenue Million Forecast, by Country 2020 & 2033
- Table 12: Global Pumps Market Volume K Unit Forecast, by Country 2020 & 2033
- Table 13: United States Pumps Market Revenue (Million) Forecast, by Application 2020 & 2033
- Table 14: United States Pumps Market Volume (K Unit) Forecast, by Application 2020 & 2033
- Table 15: Canada Pumps Market Revenue (Million) Forecast, by Application 2020 & 2033
- Table 16: Canada Pumps Market Volume (K Unit) Forecast, by Application 2020 & 2033
- Table 17: Rest of North America Pumps Market Revenue (Million) Forecast, by Application 2020 & 2033
- Table 18: Rest of North America Pumps Market Volume (K Unit) Forecast, by Application 2020 & 2033
- Table 19: Global Pumps Market Revenue Million Forecast, by Type 2020 & 2033
- Table 20: Global Pumps Market Volume K Unit Forecast, by Type 2020 & 2033
- Table 21: Global Pumps Market Revenue Million Forecast, by End User 2020 & 2033
- Table 22: Global Pumps Market Volume K Unit Forecast, by End User 2020 & 2033
- Table 23: Global Pumps Market Revenue Million Forecast, by Country 2020 & 2033
- Table 24: Global Pumps Market Volume K Unit Forecast, by Country 2020 & 2033
- Table 25: Germany Pumps Market Revenue (Million) Forecast, by Application 2020 & 2033
- Table 26: Germany Pumps Market Volume (K Unit) Forecast, by Application 2020 & 2033
- Table 27: France Pumps Market Revenue (Million) Forecast, by Application 2020 & 2033
- Table 28: France Pumps Market Volume (K Unit) Forecast, by Application 2020 & 2033
- Table 29: Spain Pumps Market Revenue (Million) Forecast, by Application 2020 & 2033
- Table 30: Spain Pumps Market Volume (K Unit) Forecast, by Application 2020 & 2033
- Table 31: United Kingdom Pumps Market Revenue (Million) Forecast, by Application 2020 & 2033
- Table 32: United Kingdom Pumps Market Volume (K Unit) Forecast, by Application 2020 & 2033
- Table 33: Russia Pumps Market Revenue (Million) Forecast, by Application 2020 & 2033
- Table 34: Russia Pumps Market Volume (K Unit) Forecast, by Application 2020 & 2033
- Table 35: NORDIC Pumps Market Revenue (Million) Forecast, by Application 2020 & 2033
- Table 36: NORDIC Pumps Market Volume (K Unit) Forecast, by Application 2020 & 2033
- Table 37: Italy Pumps Market Revenue (Million) Forecast, by Application 2020 & 2033
- Table 38: Italy Pumps Market Volume (K Unit) Forecast, by Application 2020 & 2033
- Table 39: Turkey Pumps Market Revenue (Million) Forecast, by Application 2020 & 2033
- Table 40: Turkey Pumps Market Volume (K Unit) Forecast, by Application 2020 & 2033
- Table 41: Rest of Europe Pumps Market Revenue (Million) Forecast, by Application 2020 & 2033
- Table 42: Rest of Europe Pumps Market Volume (K Unit) Forecast, by Application 2020 & 2033
- Table 43: Global Pumps Market Revenue Million Forecast, by Type 2020 & 2033
- Table 44: Global Pumps Market Volume K Unit Forecast, by Type 2020 & 2033
- Table 45: Global Pumps Market Revenue Million Forecast, by End User 2020 & 2033
- Table 46: Global Pumps Market Volume K Unit Forecast, by End User 2020 & 2033
- Table 47: Global Pumps Market Revenue Million Forecast, by Country 2020 & 2033
- Table 48: Global Pumps Market Volume K Unit Forecast, by Country 2020 & 2033
- Table 49: China Pumps Market Revenue (Million) Forecast, by Application 2020 & 2033
- Table 50: China Pumps Market Volume (K Unit) Forecast, by Application 2020 & 2033
- Table 51: India Pumps Market Revenue (Million) Forecast, by Application 2020 & 2033
- Table 52: India Pumps Market Volume (K Unit) Forecast, by Application 2020 & 2033
- Table 53: Japan Pumps Market Revenue (Million) Forecast, by Application 2020 & 2033
- Table 54: Japan Pumps Market Volume (K Unit) Forecast, by Application 2020 & 2033
- Table 55: South Korea Pumps Market Revenue (Million) Forecast, by Application 2020 & 2033
- Table 56: South Korea Pumps Market Volume (K Unit) Forecast, by Application 2020 & 2033
- Table 57: Australia Pumps Market Revenue (Million) Forecast, by Application 2020 & 2033
- Table 58: Australia Pumps Market Volume (K Unit) Forecast, by Application 2020 & 2033
- Table 59: Malaysia Pumps Market Revenue (Million) Forecast, by Application 2020 & 2033
- Table 60: Malaysia Pumps Market Volume (K Unit) Forecast, by Application 2020 & 2033
- Table 61: Thailand Pumps Market Revenue (Million) Forecast, by Application 2020 & 2033
- Table 62: Thailand Pumps Market Volume (K Unit) Forecast, by Application 2020 & 2033
- Table 63: Indonesia Pumps Market Revenue (Million) Forecast, by Application 2020 & 2033
- Table 64: Indonesia Pumps Market Volume (K Unit) Forecast, by Application 2020 & 2033
- Table 65: Vietnam Pumps Market Revenue (Million) Forecast, by Application 2020 & 2033
- Table 66: Vietnam Pumps Market Volume (K Unit) Forecast, by Application 2020 & 2033
- Table 67: Rest of Asia Pacific Pumps Market Revenue (Million) Forecast, by Application 2020 & 2033
- Table 68: Rest of Asia Pacific Pumps Market Volume (K Unit) Forecast, by Application 2020 & 2033
- Table 69: Global Pumps Market Revenue Million Forecast, by Type 2020 & 2033
- Table 70: Global Pumps Market Volume K Unit Forecast, by Type 2020 & 2033
- Table 71: Global Pumps Market Revenue Million Forecast, by End User 2020 & 2033
- Table 72: Global Pumps Market Volume K Unit Forecast, by End User 2020 & 2033
- Table 73: Global Pumps Market Revenue Million Forecast, by Country 2020 & 2033
- Table 74: Global Pumps Market Volume K Unit Forecast, by Country 2020 & 2033
- Table 75: Brazil Pumps Market Revenue (Million) Forecast, by Application 2020 & 2033
- Table 76: Brazil Pumps Market Volume (K Unit) Forecast, by Application 2020 & 2033
- Table 77: Argentina Pumps Market Revenue (Million) Forecast, by Application 2020 & 2033
- Table 78: Argentina Pumps Market Volume (K Unit) Forecast, by Application 2020 & 2033
- Table 79: Colombia Pumps Market Revenue (Million) Forecast, by Application 2020 & 2033
- Table 80: Colombia Pumps Market Volume (K Unit) Forecast, by Application 2020 & 2033
- Table 81: Rest of South America Pumps Market Revenue (Million) Forecast, by Application 2020 & 2033
- Table 82: Rest of South America Pumps Market Volume (K Unit) Forecast, by Application 2020 & 2033
- Table 83: Global Pumps Market Revenue Million Forecast, by Type 2020 & 2033
- Table 84: Global Pumps Market Volume K Unit Forecast, by Type 2020 & 2033
- Table 85: Global Pumps Market Revenue Million Forecast, by End User 2020 & 2033
- Table 86: Global Pumps Market Volume K Unit Forecast, by End User 2020 & 2033
- Table 87: Global Pumps Market Revenue Million Forecast, by Country 2020 & 2033
- Table 88: Global Pumps Market Volume K Unit Forecast, by Country 2020 & 2033
- Table 89: Saudi Arabia Pumps Market Revenue (Million) Forecast, by Application 2020 & 2033
- Table 90: Saudi Arabia Pumps Market Volume (K Unit) Forecast, by Application 2020 & 2033
- Table 91: United Arab Emirates Pumps Market Revenue (Million) Forecast, by Application 2020 & 2033
- Table 92: United Arab Emirates Pumps Market Volume (K Unit) Forecast, by Application 2020 & 2033
- Table 93: South Africa Pumps Market Revenue (Million) Forecast, by Application 2020 & 2033
- Table 94: South Africa Pumps Market Volume (K Unit) Forecast, by Application 2020 & 2033
- Table 95: Nigeria Pumps Market Revenue (Million) Forecast, by Application 2020 & 2033
- Table 96: Nigeria Pumps Market Volume (K Unit) Forecast, by Application 2020 & 2033
- Table 97: Qatar Pumps Market Revenue (Million) Forecast, by Application 2020 & 2033
- Table 98: Qatar Pumps Market Volume (K Unit) Forecast, by Application 2020 & 2033
- Table 99: Egypt Pumps Market Revenue (Million) Forecast, by Application 2020 & 2033
- Table 100: Egypt Pumps Market Volume (K Unit) Forecast, by Application 2020 & 2033
- Table 101: Rest of the Middle East and Africa Pumps Market Revenue (Million) Forecast, by Application 2020 & 2033
- Table 102: Rest of the Middle East and Africa Pumps Market Volume (K Unit) Forecast, by Application 2020 & 2033
Frequently Asked Questions
1. What is the projected Compound Annual Growth Rate (CAGR) of the Pumps Market?
The projected CAGR is approximately 3.60%.
2. Which companies are prominent players in the Pumps Market?
Key companies in the market include Sulzer Ltd, Ebara Corporation, Flowserve Corporation, Weir Group PLC, Dover Corporation*List Not Exhaustive 6 4 Market Ranking/Share (%) Analysi, Clyde Union Inc, Schlumberger Ltd, KSB SE & Co KGaA, ITT Inc, Grundfos Holding AS, Baker Hughes Company.
3. What are the main segments of the Pumps Market?
The market segments include Type, End User.
4. Can you provide details about the market size?
The market size is estimated to be USD 110.22 Million as of 2022.
5. What are some drivers contributing to market growth?
Increasing Infrastructure Development4.; Rising Emphasis Water and Wastewater Management.
6. What are the notable trends driving market growth?
Oil and Gas Sector Expected to Witness Significant Growth.
7. Are there any restraints impacting market growth?
Volatility in Raw Material Prices.
8. Can you provide examples of recent developments in the market?
December 2023: The Packo Pumps website merged with the Verder Liquids website. The collaboration aims to reinforce the relationship between Verder and Packo and provide customers with a broader range of pump technologies.
9. What pricing options are available for accessing the report?
Pricing options include single-user, multi-user, and enterprise licenses priced at USD 4750, USD 5250, and USD 8750 respectively.
10. Is the market size provided in terms of value or volume?
The market size is provided in terms of value, measured in Million and volume, measured in K Unit.
11. Are there any specific market keywords associated with the report?
Yes, the market keyword associated with the report is "Pumps Market," which aids in identifying and referencing the specific market segment covered.
12. How do I determine which pricing option suits my needs best?
The pricing options vary based on user requirements and access needs. Individual users may opt for single-user licenses, while businesses requiring broader access may choose multi-user or enterprise licenses for cost-effective access to the report.
13. Are there any additional resources or data provided in the Pumps Market report?
While the report offers comprehensive insights, it's advisable to review the specific contents or supplementary materials provided to ascertain if additional resources or data are available.
14. How can I stay updated on further developments or reports in the Pumps Market?
To stay informed about further developments, trends, and reports in the Pumps Market, consider subscribing to industry newsletters, following relevant companies and organizations, or regularly checking reputable industry news sources and publications.
Methodology
Step 1 - Identification of Relevant Samples Size from Population Database


Step 2 - Approaches for Defining Global Market Size (Value, Volume* & Price*)

Note*: In applicable scenarios
Step 3 - Data Sources
Primary Research
- Web Analytics
- Survey Reports
- Research Institute
- Latest Research Reports
- Opinion Leaders
Secondary Research
- Annual Reports
- White Paper
- Latest Press Release
- Industry Association
- Paid Database
- Investor Presentations

Step 4 - Data Triangulation
Involves using different sources of information in order to increase the validity of a study
These sources are likely to be stakeholders in a program - participants, other researchers, program staff, other community members, and so on.
Then we put all data in single framework & apply various statistical tools to find out the dynamic on the market.
During the analysis stage, feedback from the stakeholder groups would be compared to determine areas of agreement as well as areas of divergence