

Key Insights
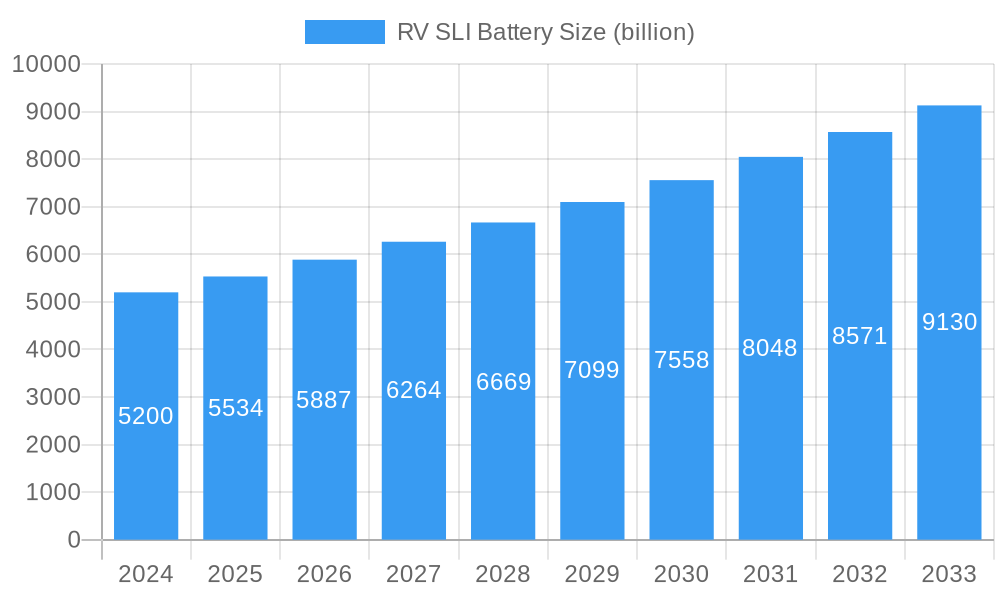
The global RV SLI battery market is poised for significant expansion, projected to reach an estimated $5.2 billion in 2024, with a robust Compound Annual Growth Rate (CAGR) of 6.5% anticipated from 2025 to 2033. This growth is primarily fueled by the burgeoning recreational vehicle (RV) industry, driven by increasing disposable incomes, a growing preference for outdoor leisure activities, and a subsequent rise in RV ownership. The convenience and freedom associated with RV travel continue to attract a wider demographic, from young families to retirees, directly translating into sustained demand for reliable SLI (Starting, Lighting, and Ignition) batteries essential for RV functionality. Furthermore, advancements in battery technology, particularly the increasing adoption of Lithium-ion batteries alongside traditional lead-acid variants, are contributing to market value. Lithium batteries offer advantages such as lighter weight, longer lifespan, and faster charging, making them increasingly attractive for modern RV applications.
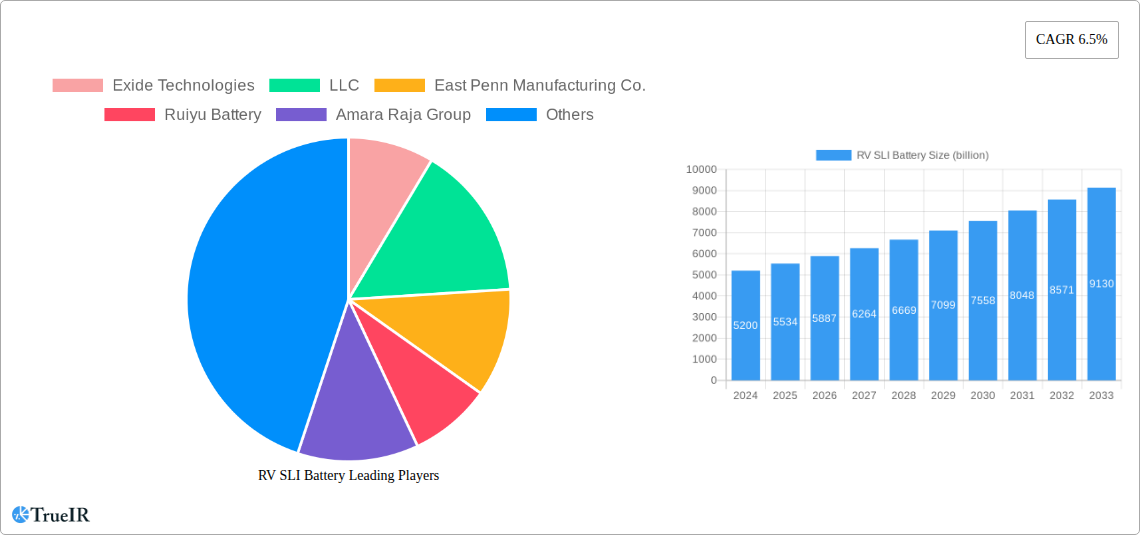
RV SLI Battery Market Size (In Billion)
The market's trajectory is also shaped by evolving consumer expectations for enhanced performance and durability in RV components. This is pushing manufacturers to innovate and offer batteries that can withstand the rigors of travel and prolonged use, supporting not just engine starting but also powering auxiliary systems like lights, appliances, and entertainment. While the market benefits from strong demand, potential restraints include the initial higher cost of advanced battery technologies and the ongoing global supply chain complexities that can affect component availability and pricing. Nevertheless, the overarching trend of a growing RV lifestyle, coupled with technological progress in battery solutions, ensures a dynamic and upwardly mobile market for RV SLI batteries in the coming years. Key players are actively investing in research and development to cater to these evolving demands and maintain a competitive edge.
RV SLI Battery Company Market Share
RV SLI Battery Market Structure & Competitive Landscape
The global RV SLI (Starting, Lighting, and Ignition) battery market exhibits a moderate level of concentration, with leading players like Exide Technologies, LLC, East Penn Manufacturing Co., Ruiyu Battery, Amara Raja Group, GS Yuasa, Fengfan Co., Ltd., PT Nipress Tbk, Camel Group Co., Hitachi, Storage Battery JSC, and Hankook Atlas BX America Corp holding significant market share. Innovation is a key driver, fueled by ongoing research and development in battery chemistry and energy density, particularly for lithium battery technologies. Regulatory impacts, such as evolving emission standards and battery recycling mandates, are shaping manufacturing processes and product lifecycle management. Product substitutes, primarily advanced lead-acid batteries and emerging solid-state batteries, present a competitive threat, necessitating continuous improvement in performance and cost-effectiveness.
End-user segmentation reveals a dual demand from Passenger Vehicle and Commercial Vehicle applications, with increasing electrification in both sectors influencing battery requirements. Mergers and acquisitions (M&A) trends, while not consistently high in volume, represent strategic moves by key players to consolidate market position, acquire new technologies, and expand geographical reach. For instance, during the historical period of 2019–2024, an estimated XX billion in M&A deals were observed. Concentration ratios among the top five players are estimated to be around XX%, indicating a competitive yet consolidated landscape. The interplay of technological advancements, regulatory pressures, and strategic corporate actions will continue to define the competitive dynamics in the coming forecast period of 2025–2033.
RV SLI Battery Market Trends & Opportunities
The RV SLI battery market is poised for substantial growth, projected to expand at a Compound Annual Growth Rate (CAGR) of approximately XX% from 2025 to 2033. This robust expansion is underpinned by several converging trends and emerging opportunities that are reshaping the automotive and recreational vehicle sectors. The increasing global demand for vehicles, both passenger and commercial, directly translates into a higher demand for reliable SLI batteries. Furthermore, the ongoing shift towards vehicle electrification, even in traditional internal combustion engine vehicles where SLI batteries remain crucial for auxiliary systems and startups, is driving innovation and adoption of more advanced battery technologies.
Technological shifts are a paramount trend, with lithium battery chemistries gaining traction due to their superior energy density, lighter weight, and longer lifespan compared to traditional lead storage batteries. While lead storage batteries will continue to hold a significant share due to their cost-effectiveness and established infrastructure, the market penetration of lithium batteries for SLI applications is expected to rise significantly, particularly in premium and performance-oriented vehicles. This technological evolution presents opportunities for battery manufacturers to invest in research and development, optimize production processes for lithium-ion technologies, and cater to the growing demand for lighter and more efficient automotive components.
Consumer preferences are also evolving. Drivers are increasingly seeking batteries that offer greater reliability, longer service life, and faster charging capabilities. The growing awareness of environmental sustainability is also influencing purchasing decisions, with a preference for batteries produced through more eco-friendly manufacturing processes and those with better recyclability. This creates opportunities for companies that can demonstrate strong environmental credentials and offer batteries with a reduced carbon footprint.
The competitive dynamics within the RV SLI battery market are intensifying. Established players are facing competition from new entrants and technology developers, leading to a race for innovation and cost optimization. Strategic partnerships and collaborations between battery manufacturers, automotive OEMs, and technology providers are becoming more common, aimed at accelerating product development and market penetration. The overall market size is estimated to reach over $XX billion by 2033, a testament to the sustained demand and the transformative impact of these trends. The market penetration of advanced battery technologies, while still in its nascent stages for SLI applications, is projected to reach XX% by the end of the forecast period, opening up significant revenue streams and market share opportunities for agile and innovative companies.
Dominant Markets & Segments in RV SLI Battery
The RV SLI battery market is characterized by distinct dominant regions and segments, each driven by unique growth catalysts. Regionally, Asia-Pacific is projected to remain the largest and fastest-growing market, driven by the sheer volume of vehicle production and sales in countries like China and India. The presence of major battery manufacturers, coupled with supportive government policies promoting automotive manufacturing and technological advancement, solidifies Asia-Pacific's dominance.
From an application perspective, the Passenger Vehicle segment is the primary revenue generator and is expected to continue its dominance throughout the forecast period. The escalating global demand for passenger cars, coupled with the increasing adoption of advanced automotive technologies and electrification features that still rely on robust SLI systems, fuels this segment's growth. Furthermore, evolving automotive designs necessitate lighter and more efficient battery solutions, aligning with the advancements in battery technology. Key growth drivers in this segment include:
- Increasing Vehicle Production: Global automotive production continues to expand, directly impacting the demand for SLI batteries for new vehicle installations.
- Technological Advancements in Vehicles: Integration of sophisticated infotainment systems, advanced driver-assistance systems (ADAS), and smart functionalities in passenger vehicles necessitates reliable and high-performance SLI batteries.
- Replacement Market Demand: The substantial existing fleet of passenger vehicles requires regular battery replacements, creating a consistent demand in the aftermarket.
- Evolving Regulatory Standards: Stricter emission norms and fuel efficiency standards indirectly encourage the use of optimized electrical systems, which are supported by advanced SLI batteries.
In terms of battery types, while Lead Storage Battery currently holds the largest market share due to its established infrastructure, cost-effectiveness, and proven reliability for traditional applications, the Lithium Battery segment is exhibiting the most significant growth trajectory. The increasing demand for lighter, more energy-dense, and longer-lasting batteries in modern vehicles is a key driver for lithium-ion adoption. Key growth drivers in the Lithium Battery segment include:
- Weight Reduction Initiatives: Automotive manufacturers are actively seeking to reduce vehicle weight to improve fuel efficiency and performance, making lighter lithium batteries an attractive option.
- Enhanced Performance Characteristics: Lithium batteries offer superior cranking power, faster charging capabilities, and a wider operating temperature range compared to lead-acid batteries.
- Longer Lifespan and Durability: The extended cycle life and robustness of lithium batteries reduce the frequency of replacements, offering long-term cost benefits.
- Integration with Electrified Powertrains: As hybrid and electric vehicles become more prevalent, the integration and compatibility of lithium-ion battery technologies for both propulsion and auxiliary systems are becoming increasingly important.
The Commercial Vehicle segment, though smaller in volume compared to passenger vehicles, is also a significant contributor and is expected to witness steady growth. Factors such as the expansion of logistics and transportation networks, coupled with the increasing adoption of advanced telematics and onboard electronics in commercial fleets, drive the demand for reliable SLI batteries in this segment.
RV SLI Battery Product Analysis
The RV SLI battery market is characterized by continuous product innovation aimed at enhancing performance, longevity, and efficiency. Key advancements include the development of advanced lead-acid battery technologies like Absorbed Glass Mat (AGM) and Enhanced Flooded Battery (EFB) that offer improved deep cycling capabilities and vibration resistance. Concurrently, the rise of lithium-ion battery chemistries, such as Lithium Iron Phosphate (LiFePO4), is revolutionizing the market with their superior energy density, lighter weight, faster charging, and extended lifespan. These innovations provide competitive advantages by catering to the evolving needs of modern vehicles, from enhanced starting power in extreme temperatures to supporting complex electronic systems and contributing to overall vehicle weight reduction.
Key Drivers, Barriers & Challenges in RV SLI Battery
The RV SLI battery market is propelled by several key drivers. Technological innovation in battery chemistry, leading to lighter, more powerful, and longer-lasting batteries, is a primary force. The increasing global vehicle production and a substantial replacement market for existing vehicles ensure sustained demand. Furthermore, the growing adoption of advanced automotive technologies and the gradual integration of electrification, even in traditional vehicles, necessitate more sophisticated SLI solutions. Supportive government policies promoting automotive manufacturing and battery research also play a crucial role.
However, significant challenges impact RV SLI battery growth. Raw material price volatility for key components like lithium, cobalt, and lead can impact manufacturing costs and profitability. Complex supply chains and potential disruptions, as witnessed in recent years, pose a considerable risk. Stringent environmental regulations concerning battery production, disposal, and recycling, while ultimately beneficial, require significant investment in compliance and infrastructure. Intense competition from established players and new entrants, driving down prices, also presents a challenge.
Growth Drivers in the RV SLI Battery Market
The RV SLI battery market is experiencing robust growth driven by several pivotal factors. Technological advancements in battery chemistry, particularly the increasing adoption of lithium-ion batteries, are offering enhanced performance, lighter weight, and longer lifespans. This aligns with the automotive industry's drive for fuel efficiency and advanced features. The escalating global vehicle production across both passenger and commercial segments directly translates to higher demand for SLI batteries. Furthermore, the substantial aftermarket demand from the vast existing vehicle fleet requiring regular battery replacements provides a consistent revenue stream. Supportive government initiatives promoting electric vehicle infrastructure and battery manufacturing also indirectly fuel innovation and demand for advanced battery solutions.
Challenges Impacting RV SLI Battery Growth
Several barriers and restraints are impacting the growth trajectory of the RV SLI battery market. Raw material price volatility for key components such as lithium, cobalt, nickel, and lead can significantly affect manufacturing costs and profit margins, creating uncertainty for producers. Supply chain complexities and disruptions, as observed globally, can lead to shortages and production delays, impacting timely delivery to automotive manufacturers and aftermarket distributors. Stringent regulatory landscapes concerning battery production, recycling, and disposal necessitate substantial investment in compliance and sustainable practices, adding to operational costs. Intense competitive pressures from numerous established and emerging players, leading to price erosion, also pose a significant challenge for maintaining profitability.
Key Players Shaping the RV SLI Battery Market
- Exide Technologies, LLC
- East Penn Manufacturing Co.
- Ruiyu Battery
- Amara Raja Group
- GS Yuasa
- Fengfan Co., Ltd.
- PT Nipress Tbk
- Camel Group Co.
- Hitachi
- Storage Battery JSC
- Hankook Atlas BX America Corp
Significant RV SLI Battery Industry Milestones
- 2019: Increased investment in R&D for advanced lead-acid battery technologies (e.g., AGM, EFB) to meet evolving automotive demands.
- 2020: Growing emphasis on supply chain diversification and resilience due to global geopolitical events.
- 2021: Significant uptick in patent filings related to lithium-ion battery chemistries for automotive applications.
- 2022: Introduction of new battery management systems (BMS) for enhanced performance and safety in lithium SLI batteries.
- 2023: Strategic partnerships between battery manufacturers and automotive OEMs to co-develop next-generation SLI solutions.
- 2024: Increased focus on battery recycling technologies and sustainable manufacturing processes across the industry.
Future Outlook for RV SLI Battery Market
The future outlook for the RV SLI battery market is exceptionally positive, driven by continued technological innovation and sustained demand from the automotive sector. The projected dominance of lithium battery technologies in the coming years, owing to their superior performance characteristics and lightweight properties, presents a significant growth catalyst. Strategic opportunities lie in further developing cost-effective lithium battery solutions and expanding production capacities to meet the burgeoning global demand. The increasing integration of advanced vehicle electronics and the ongoing transition towards electrified powertrains will continue to necessitate reliable and high-performance SLI batteries, solidifying the market's growth potential and offering substantial returns for forward-thinking industry participants.
RV SLI Battery Segmentation
-
1. Application
- 1.1. Passenger Vehicle
- 1.2. Commercial Vehicle
-
2. Types
- 2.1. Lithium Battery
- 2.2. Lead Storage Battery
RV SLI Battery Segmentation By Geography
-
1. North America
- 1.1. United States
- 1.2. Canada
- 1.3. Mexico
-
2. South America
- 2.1. Brazil
- 2.2. Argentina
- 2.3. Rest of South America
-
3. Europe
- 3.1. United Kingdom
- 3.2. Germany
- 3.3. France
- 3.4. Italy
- 3.5. Spain
- 3.6. Russia
- 3.7. Benelux
- 3.8. Nordics
- 3.9. Rest of Europe
-
4. Middle East & Africa
- 4.1. Turkey
- 4.2. Israel
- 4.3. GCC
- 4.4. North Africa
- 4.5. South Africa
- 4.6. Rest of Middle East & Africa
-
5. Asia Pacific
- 5.1. China
- 5.2. India
- 5.3. Japan
- 5.4. South Korea
- 5.5. ASEAN
- 5.6. Oceania
- 5.7. Rest of Asia Pacific
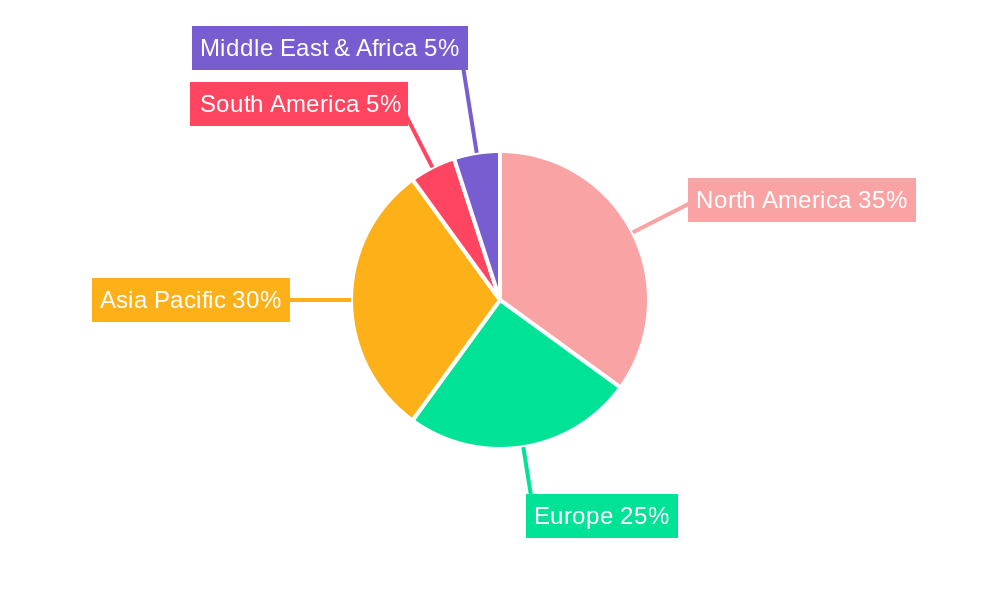
RV SLI Battery Regional Market Share
Geographic Coverage of RV SLI Battery
RV SLI Battery REPORT HIGHLIGHTS
| Aspects | Details |
|---|---|
| Study Period | 2020-2034 |
| Base Year | 2025 |
| Estimated Year | 2026 |
| Forecast Period | 2026-2034 |
| Historical Period | 2020-2025 |
| Growth Rate | CAGR of 6.5% from 2020-2034 |
| Segmentation |
|
Table of Contents
- 1. Introduction
- 1.1. Research Scope
- 1.2. Market Segmentation
- 1.3. Research Methodology
- 1.4. Definitions and Assumptions
- 2. Executive Summary
- 2.1. Introduction
- 3. Market Dynamics
- 3.1. Introduction
- 3.2. Market Drivers
- 3.3. Market Restrains
- 3.4. Market Trends
- 4. Market Factor Analysis
- 4.1. Porters Five Forces
- 4.2. Supply/Value Chain
- 4.3. PESTEL analysis
- 4.4. Market Entropy
- 4.5. Patent/Trademark Analysis
- 5. Global RV SLI Battery Analysis, Insights and Forecast, 2020-2032
- 5.1. Market Analysis, Insights and Forecast - by Application
- 5.1.1. Passenger Vehicle
- 5.1.2. Commercial Vehicle
- 5.2. Market Analysis, Insights and Forecast - by Types
- 5.2.1. Lithium Battery
- 5.2.2. Lead Storage Battery
- 5.3. Market Analysis, Insights and Forecast - by Region
- 5.3.1. North America
- 5.3.2. South America
- 5.3.3. Europe
- 5.3.4. Middle East & Africa
- 5.3.5. Asia Pacific
- 5.1. Market Analysis, Insights and Forecast - by Application
- 6. North America RV SLI Battery Analysis, Insights and Forecast, 2020-2032
- 6.1. Market Analysis, Insights and Forecast - by Application
- 6.1.1. Passenger Vehicle
- 6.1.2. Commercial Vehicle
- 6.2. Market Analysis, Insights and Forecast - by Types
- 6.2.1. Lithium Battery
- 6.2.2. Lead Storage Battery
- 6.1. Market Analysis, Insights and Forecast - by Application
- 7. South America RV SLI Battery Analysis, Insights and Forecast, 2020-2032
- 7.1. Market Analysis, Insights and Forecast - by Application
- 7.1.1. Passenger Vehicle
- 7.1.2. Commercial Vehicle
- 7.2. Market Analysis, Insights and Forecast - by Types
- 7.2.1. Lithium Battery
- 7.2.2. Lead Storage Battery
- 7.1. Market Analysis, Insights and Forecast - by Application
- 8. Europe RV SLI Battery Analysis, Insights and Forecast, 2020-2032
- 8.1. Market Analysis, Insights and Forecast - by Application
- 8.1.1. Passenger Vehicle
- 8.1.2. Commercial Vehicle
- 8.2. Market Analysis, Insights and Forecast - by Types
- 8.2.1. Lithium Battery
- 8.2.2. Lead Storage Battery
- 8.1. Market Analysis, Insights and Forecast - by Application
- 9. Middle East & Africa RV SLI Battery Analysis, Insights and Forecast, 2020-2032
- 9.1. Market Analysis, Insights and Forecast - by Application
- 9.1.1. Passenger Vehicle
- 9.1.2. Commercial Vehicle
- 9.2. Market Analysis, Insights and Forecast - by Types
- 9.2.1. Lithium Battery
- 9.2.2. Lead Storage Battery
- 9.1. Market Analysis, Insights and Forecast - by Application
- 10. Asia Pacific RV SLI Battery Analysis, Insights and Forecast, 2020-2032
- 10.1. Market Analysis, Insights and Forecast - by Application
- 10.1.1. Passenger Vehicle
- 10.1.2. Commercial Vehicle
- 10.2. Market Analysis, Insights and Forecast - by Types
- 10.2.1. Lithium Battery
- 10.2.2. Lead Storage Battery
- 10.1. Market Analysis, Insights and Forecast - by Application
- 11. Competitive Analysis
- 11.1. Global Market Share Analysis 2025
- 11.2. Company Profiles
- 11.2.1 Exide Technologies
- 11.2.1.1. Overview
- 11.2.1.2. Products
- 11.2.1.3. SWOT Analysis
- 11.2.1.4. Recent Developments
- 11.2.1.5. Financials (Based on Availability)
- 11.2.2 LLC
- 11.2.2.1. Overview
- 11.2.2.2. Products
- 11.2.2.3. SWOT Analysis
- 11.2.2.4. Recent Developments
- 11.2.2.5. Financials (Based on Availability)
- 11.2.3 East Penn Manufacturing Co.
- 11.2.3.1. Overview
- 11.2.3.2. Products
- 11.2.3.3. SWOT Analysis
- 11.2.3.4. Recent Developments
- 11.2.3.5. Financials (Based on Availability)
- 11.2.4 Ruiyu Battery
- 11.2.4.1. Overview
- 11.2.4.2. Products
- 11.2.4.3. SWOT Analysis
- 11.2.4.4. Recent Developments
- 11.2.4.5. Financials (Based on Availability)
- 11.2.5 Amara Raja Group
- 11.2.5.1. Overview
- 11.2.5.2. Products
- 11.2.5.3. SWOT Analysis
- 11.2.5.4. Recent Developments
- 11.2.5.5. Financials (Based on Availability)
- 11.2.6 GS Yuasa
- 11.2.6.1. Overview
- 11.2.6.2. Products
- 11.2.6.3. SWOT Analysis
- 11.2.6.4. Recent Developments
- 11.2.6.5. Financials (Based on Availability)
- 11.2.7 Fengfan Co.
- 11.2.7.1. Overview
- 11.2.7.2. Products
- 11.2.7.3. SWOT Analysis
- 11.2.7.4. Recent Developments
- 11.2.7.5. Financials (Based on Availability)
- 11.2.8 Ltd.
- 11.2.8.1. Overview
- 11.2.8.2. Products
- 11.2.8.3. SWOT Analysis
- 11.2.8.4. Recent Developments
- 11.2.8.5. Financials (Based on Availability)
- 11.2.9 PT Nipress Tbk
- 11.2.9.1. Overview
- 11.2.9.2. Products
- 11.2.9.3. SWOT Analysis
- 11.2.9.4. Recent Developments
- 11.2.9.5. Financials (Based on Availability)
- 11.2.10 Camel Group Co.
- 11.2.10.1. Overview
- 11.2.10.2. Products
- 11.2.10.3. SWOT Analysis
- 11.2.10.4. Recent Developments
- 11.2.10.5. Financials (Based on Availability)
- 11.2.11 Hitachi
- 11.2.11.1. Overview
- 11.2.11.2. Products
- 11.2.11.3. SWOT Analysis
- 11.2.11.4. Recent Developments
- 11.2.11.5. Financials (Based on Availability)
- 11.2.12 Storage Battery JSC
- 11.2.12.1. Overview
- 11.2.12.2. Products
- 11.2.12.3. SWOT Analysis
- 11.2.12.4. Recent Developments
- 11.2.12.5. Financials (Based on Availability)
- 11.2.13 Hankook Atlas BX America Corp
- 11.2.13.1. Overview
- 11.2.13.2. Products
- 11.2.13.3. SWOT Analysis
- 11.2.13.4. Recent Developments
- 11.2.13.5. Financials (Based on Availability)
- 11.2.1 Exide Technologies
List of Figures
- Figure 1: Global RV SLI Battery Revenue Breakdown (billion, %) by Region 2025 & 2033
- Figure 2: North America RV SLI Battery Revenue (billion), by Application 2025 & 2033
- Figure 3: North America RV SLI Battery Revenue Share (%), by Application 2025 & 2033
- Figure 4: North America RV SLI Battery Revenue (billion), by Types 2025 & 2033
- Figure 5: North America RV SLI Battery Revenue Share (%), by Types 2025 & 2033
- Figure 6: North America RV SLI Battery Revenue (billion), by Country 2025 & 2033
- Figure 7: North America RV SLI Battery Revenue Share (%), by Country 2025 & 2033
- Figure 8: South America RV SLI Battery Revenue (billion), by Application 2025 & 2033
- Figure 9: South America RV SLI Battery Revenue Share (%), by Application 2025 & 2033
- Figure 10: South America RV SLI Battery Revenue (billion), by Types 2025 & 2033
- Figure 11: South America RV SLI Battery Revenue Share (%), by Types 2025 & 2033
- Figure 12: South America RV SLI Battery Revenue (billion), by Country 2025 & 2033
- Figure 13: South America RV SLI Battery Revenue Share (%), by Country 2025 & 2033
- Figure 14: Europe RV SLI Battery Revenue (billion), by Application 2025 & 2033
- Figure 15: Europe RV SLI Battery Revenue Share (%), by Application 2025 & 2033
- Figure 16: Europe RV SLI Battery Revenue (billion), by Types 2025 & 2033
- Figure 17: Europe RV SLI Battery Revenue Share (%), by Types 2025 & 2033
- Figure 18: Europe RV SLI Battery Revenue (billion), by Country 2025 & 2033
- Figure 19: Europe RV SLI Battery Revenue Share (%), by Country 2025 & 2033
- Figure 20: Middle East & Africa RV SLI Battery Revenue (billion), by Application 2025 & 2033
- Figure 21: Middle East & Africa RV SLI Battery Revenue Share (%), by Application 2025 & 2033
- Figure 22: Middle East & Africa RV SLI Battery Revenue (billion), by Types 2025 & 2033
- Figure 23: Middle East & Africa RV SLI Battery Revenue Share (%), by Types 2025 & 2033
- Figure 24: Middle East & Africa RV SLI Battery Revenue (billion), by Country 2025 & 2033
- Figure 25: Middle East & Africa RV SLI Battery Revenue Share (%), by Country 2025 & 2033
- Figure 26: Asia Pacific RV SLI Battery Revenue (billion), by Application 2025 & 2033
- Figure 27: Asia Pacific RV SLI Battery Revenue Share (%), by Application 2025 & 2033
- Figure 28: Asia Pacific RV SLI Battery Revenue (billion), by Types 2025 & 2033
- Figure 29: Asia Pacific RV SLI Battery Revenue Share (%), by Types 2025 & 2033
- Figure 30: Asia Pacific RV SLI Battery Revenue (billion), by Country 2025 & 2033
- Figure 31: Asia Pacific RV SLI Battery Revenue Share (%), by Country 2025 & 2033
List of Tables
- Table 1: Global RV SLI Battery Revenue billion Forecast, by Application 2020 & 2033
- Table 2: Global RV SLI Battery Revenue billion Forecast, by Types 2020 & 2033
- Table 3: Global RV SLI Battery Revenue billion Forecast, by Region 2020 & 2033
- Table 4: Global RV SLI Battery Revenue billion Forecast, by Application 2020 & 2033
- Table 5: Global RV SLI Battery Revenue billion Forecast, by Types 2020 & 2033
- Table 6: Global RV SLI Battery Revenue billion Forecast, by Country 2020 & 2033
- Table 7: United States RV SLI Battery Revenue (billion) Forecast, by Application 2020 & 2033
- Table 8: Canada RV SLI Battery Revenue (billion) Forecast, by Application 2020 & 2033
- Table 9: Mexico RV SLI Battery Revenue (billion) Forecast, by Application 2020 & 2033
- Table 10: Global RV SLI Battery Revenue billion Forecast, by Application 2020 & 2033
- Table 11: Global RV SLI Battery Revenue billion Forecast, by Types 2020 & 2033
- Table 12: Global RV SLI Battery Revenue billion Forecast, by Country 2020 & 2033
- Table 13: Brazil RV SLI Battery Revenue (billion) Forecast, by Application 2020 & 2033
- Table 14: Argentina RV SLI Battery Revenue (billion) Forecast, by Application 2020 & 2033
- Table 15: Rest of South America RV SLI Battery Revenue (billion) Forecast, by Application 2020 & 2033
- Table 16: Global RV SLI Battery Revenue billion Forecast, by Application 2020 & 2033
- Table 17: Global RV SLI Battery Revenue billion Forecast, by Types 2020 & 2033
- Table 18: Global RV SLI Battery Revenue billion Forecast, by Country 2020 & 2033
- Table 19: United Kingdom RV SLI Battery Revenue (billion) Forecast, by Application 2020 & 2033
- Table 20: Germany RV SLI Battery Revenue (billion) Forecast, by Application 2020 & 2033
- Table 21: France RV SLI Battery Revenue (billion) Forecast, by Application 2020 & 2033
- Table 22: Italy RV SLI Battery Revenue (billion) Forecast, by Application 2020 & 2033
- Table 23: Spain RV SLI Battery Revenue (billion) Forecast, by Application 2020 & 2033
- Table 24: Russia RV SLI Battery Revenue (billion) Forecast, by Application 2020 & 2033
- Table 25: Benelux RV SLI Battery Revenue (billion) Forecast, by Application 2020 & 2033
- Table 26: Nordics RV SLI Battery Revenue (billion) Forecast, by Application 2020 & 2033
- Table 27: Rest of Europe RV SLI Battery Revenue (billion) Forecast, by Application 2020 & 2033
- Table 28: Global RV SLI Battery Revenue billion Forecast, by Application 2020 & 2033
- Table 29: Global RV SLI Battery Revenue billion Forecast, by Types 2020 & 2033
- Table 30: Global RV SLI Battery Revenue billion Forecast, by Country 2020 & 2033
- Table 31: Turkey RV SLI Battery Revenue (billion) Forecast, by Application 2020 & 2033
- Table 32: Israel RV SLI Battery Revenue (billion) Forecast, by Application 2020 & 2033
- Table 33: GCC RV SLI Battery Revenue (billion) Forecast, by Application 2020 & 2033
- Table 34: North Africa RV SLI Battery Revenue (billion) Forecast, by Application 2020 & 2033
- Table 35: South Africa RV SLI Battery Revenue (billion) Forecast, by Application 2020 & 2033
- Table 36: Rest of Middle East & Africa RV SLI Battery Revenue (billion) Forecast, by Application 2020 & 2033
- Table 37: Global RV SLI Battery Revenue billion Forecast, by Application 2020 & 2033
- Table 38: Global RV SLI Battery Revenue billion Forecast, by Types 2020 & 2033
- Table 39: Global RV SLI Battery Revenue billion Forecast, by Country 2020 & 2033
- Table 40: China RV SLI Battery Revenue (billion) Forecast, by Application 2020 & 2033
- Table 41: India RV SLI Battery Revenue (billion) Forecast, by Application 2020 & 2033
- Table 42: Japan RV SLI Battery Revenue (billion) Forecast, by Application 2020 & 2033
- Table 43: South Korea RV SLI Battery Revenue (billion) Forecast, by Application 2020 & 2033
- Table 44: ASEAN RV SLI Battery Revenue (billion) Forecast, by Application 2020 & 2033
- Table 45: Oceania RV SLI Battery Revenue (billion) Forecast, by Application 2020 & 2033
- Table 46: Rest of Asia Pacific RV SLI Battery Revenue (billion) Forecast, by Application 2020 & 2033
Frequently Asked Questions
1. What is the projected Compound Annual Growth Rate (CAGR) of the RV SLI Battery?
The projected CAGR is approximately 6.5%.
2. Which companies are prominent players in the RV SLI Battery?
Key companies in the market include Exide Technologies, LLC, East Penn Manufacturing Co., Ruiyu Battery, Amara Raja Group, GS Yuasa, Fengfan Co., Ltd., PT Nipress Tbk, Camel Group Co., Hitachi, Storage Battery JSC, Hankook Atlas BX America Corp.
3. What are the main segments of the RV SLI Battery?
The market segments include Application, Types.
4. Can you provide details about the market size?
The market size is estimated to be USD 5.2 billion as of 2022.
5. What are some drivers contributing to market growth?
N/A
6. What are the notable trends driving market growth?
N/A
7. Are there any restraints impacting market growth?
N/A
8. Can you provide examples of recent developments in the market?
N/A
9. What pricing options are available for accessing the report?
Pricing options include single-user, multi-user, and enterprise licenses priced at USD 5600.00, USD 8400.00, and USD 11200.00 respectively.
10. Is the market size provided in terms of value or volume?
The market size is provided in terms of value, measured in billion.
11. Are there any specific market keywords associated with the report?
Yes, the market keyword associated with the report is "RV SLI Battery," which aids in identifying and referencing the specific market segment covered.
12. How do I determine which pricing option suits my needs best?
The pricing options vary based on user requirements and access needs. Individual users may opt for single-user licenses, while businesses requiring broader access may choose multi-user or enterprise licenses for cost-effective access to the report.
13. Are there any additional resources or data provided in the RV SLI Battery report?
While the report offers comprehensive insights, it's advisable to review the specific contents or supplementary materials provided to ascertain if additional resources or data are available.
14. How can I stay updated on further developments or reports in the RV SLI Battery?
To stay informed about further developments, trends, and reports in the RV SLI Battery, consider subscribing to industry newsletters, following relevant companies and organizations, or regularly checking reputable industry news sources and publications.
Methodology
Step 1 - Identification of Relevant Samples Size from Population Database


Step 2 - Approaches for Defining Global Market Size (Value, Volume* & Price*)

Note*: In applicable scenarios
Step 3 - Data Sources
Primary Research
- Web Analytics
- Survey Reports
- Research Institute
- Latest Research Reports
- Opinion Leaders
Secondary Research
- Annual Reports
- White Paper
- Latest Press Release
- Industry Association
- Paid Database
- Investor Presentations

Step 4 - Data Triangulation
Involves using different sources of information in order to increase the validity of a study
These sources are likely to be stakeholders in a program - participants, other researchers, program staff, other community members, and so on.
Then we put all data in single framework & apply various statistical tools to find out the dynamic on the market.
During the analysis stage, feedback from the stakeholder groups would be compared to determine areas of agreement as well as areas of divergence