

Key Insights
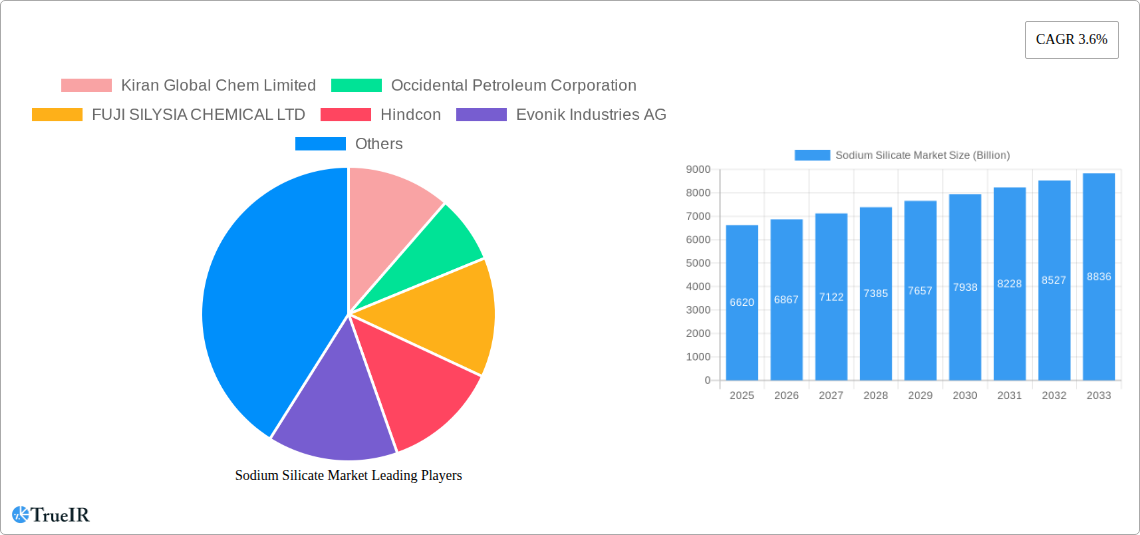
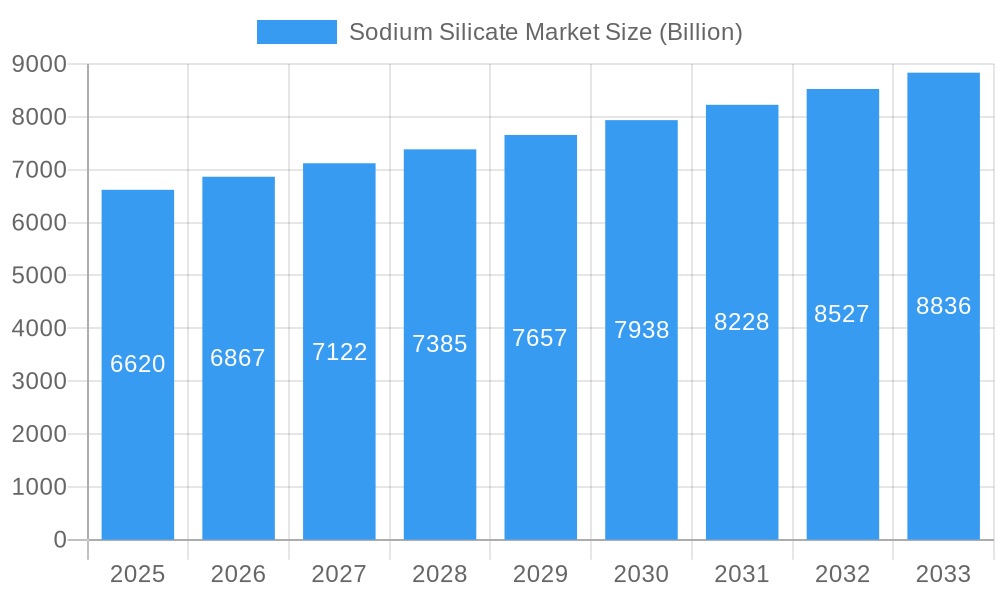
The global sodium silicate market, valued at $6.62 billion in 2025, is projected to experience steady growth, driven by its diverse applications across various industries. A compound annual growth rate (CAGR) of 3.6% from 2025 to 2033 indicates a robust market outlook. Key drivers include the increasing demand for construction materials (particularly in developing economies), the expanding adhesives and paints industry, and the growing need for effective water treatment solutions. The market is segmented by type (solid and liquid) and application (adhesives & paints, detergents, food preservation, precipitated silica, paper production, water treatment, and other applications like construction and metal casting). The solid form is expected to maintain a significant market share due to its cost-effectiveness and wide applicability. Among applications, adhesives and paints currently dominate, fueled by the construction boom and rising demand for durable coatings. However, growth in water treatment and food preservation segments is anticipated to contribute significantly to the overall market expansion in the coming years. Competitive dynamics are shaped by established players like BASF SE, Evonik Industries AG, and PQ Corporation, alongside regional manufacturers. Geographic growth is expected to be strong across Asia-Pacific, driven by rapid industrialization and urbanization in countries like China and India. North America and Europe are also expected to maintain consistent growth due to the presence of established industries and a strong focus on sustainable solutions.
Sodium Silicate Market Market Size (In Billion)
The market's growth trajectory will be influenced by factors such as fluctuating raw material prices (silica and caustic soda), environmental regulations concerning silica dust emissions, and the development of alternative binding agents. Despite these potential restraints, the versatility of sodium silicate and its crucial role in various essential industries ensures sustained market expansion. The increasing focus on sustainable and eco-friendly solutions is likely to drive innovation within the market, leading to the development of new formulations with enhanced performance characteristics and reduced environmental impact. The market is ripe for innovative solutions that focus on enhanced sustainability and improved efficiency across various applications. This includes development of bio-based alternatives, reduced emissions, and enhanced product performance. The continued expansion of construction, the growing demand for higher-quality consumer goods, and a push for efficient water treatment will ultimately drive market growth.
Sodium Silicate Market Company Market Share
Sodium Silicate Market: A Comprehensive Report (2019-2033)
This dynamic report provides a deep dive into the Sodium Silicate market, offering invaluable insights for stakeholders across the value chain. From market size and segmentation analysis to competitive landscape assessment and future outlook projections, this report is a must-have for businesses seeking to navigate this growing sector. The study period covers 2019-2033, with a focus on the estimated year 2025 and a forecast period of 2025-2033. The market is projected to reach a value exceeding xx Billion by 2033, driven by key trends outlined in this comprehensive analysis.
Sodium Silicate Market Market Structure & Competitive Landscape
The Sodium Silicate market exhibits a moderately consolidated structure, with a handful of multinational corporations commanding significant market share. Key players like Evonik Industries AG, BASF SE, and PQ Corporation are prominent due to their extensive production capabilities and global reach. However, regional players like Kiran Global Chem Limited and FUJI SILYSIA CHEMICAL LTD also contribute significantly, particularly within their respective geographic areas. The market concentration ratio (CR4) is estimated at xx%, indicating moderate consolidation.
Key aspects of the competitive landscape include:
- Innovation Drivers: Continuous R&D efforts are focused on enhancing product properties like purity, viscosity, and reactivity to cater to evolving application demands.
- Regulatory Impacts: Environmental regulations related to chemical handling and waste disposal are significant factors impacting manufacturing processes and operational costs.
- Product Substitutes: Alternative binding agents and dispersants are posing some competitive pressure, although Sodium Silicate's versatility remains a key advantage.
- End-User Segmentation: The market is diverse, with significant demand from the Adhesives & Paints, Detergents, and Water Treatment sectors.
- M&A Trends: Over the historical period (2019-2024), the M&A activity within the Sodium Silicate market was relatively low, with approximately xx deals recorded, mostly involving smaller players. Consolidation is expected to increase in the coming years.
Sodium Silicate Market Market Trends & Opportunities
The global Sodium Silicate market is experiencing robust growth, driven by rising demand from diverse industries. The market size is projected to expand at a CAGR of xx% during the forecast period (2025-2033), reaching xx Billion by 2033. This growth is fueled by multiple factors:
- Technological advancements: Innovations in production processes have led to higher purity and customized Sodium Silicate products, expanding application possibilities.
- Increasing demand in key application segments: Growth is particularly strong in Adhesives & Paints, fueled by the construction boom, and Water Treatment, driven by stringent regulations regarding water purification.
- Shifting consumer preferences: Consumers are increasingly demanding eco-friendly solutions, leading to a push for sustainable production methods within the Sodium Silicate industry.
- Competitive dynamics: The competitive landscape is evolving, with established players focusing on enhancing product portfolios and expanding geographic reach while new entrants explore niche market segments. This dynamic competition is stimulating innovation and driving down prices.
- Market penetration rates: While the market penetration rate is high in developed regions, there’s significant potential for growth in emerging economies due to rising infrastructure development and industrialization.
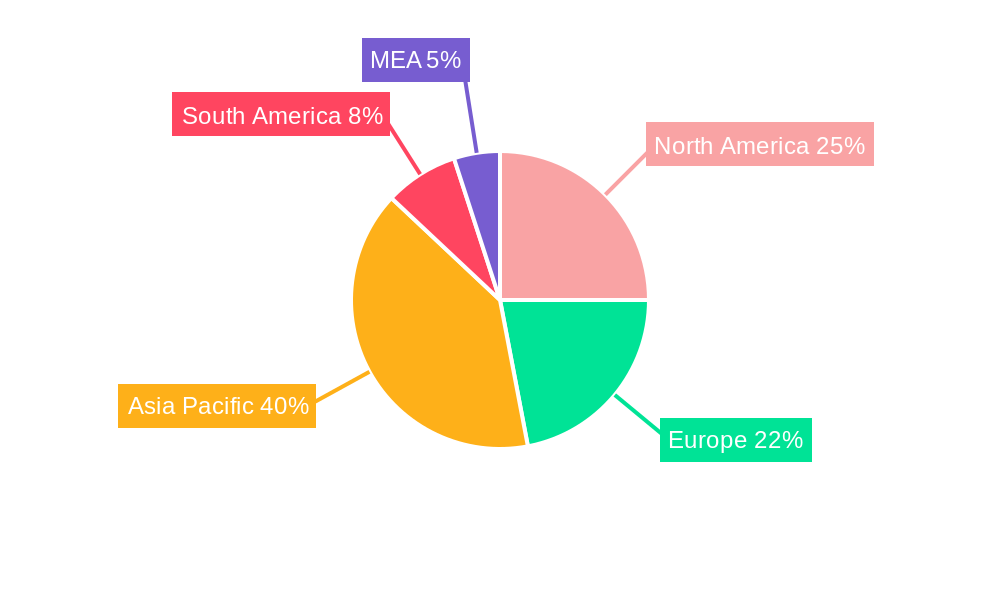
Dominant Markets & Segments in Sodium Silicate Market
The Adhesives and Paints application segment currently holds the largest market share, driven by the robust growth of the construction industry globally. The Liquid form of Sodium Silicate dominates the type segment due to its ease of handling and versatility in various applications. Geographically, the Asia-Pacific region is currently the leading market for Sodium Silicate, driven by factors including:
- Rapid infrastructure development: Significant investments in construction and industrial projects are boosting demand for Sodium Silicate in this region.
- Growing manufacturing sector: Expansion of various industries including detergents and paper production is creating a substantial market for Sodium Silicate.
- Favorable government policies: Policies aimed at promoting industrial growth and infrastructure development are further driving the market.
Other key regional markets include North America and Europe, with steady growth observed despite market maturity.
Sodium Silicate Market Product Analysis
Sodium Silicate products are continuously being improved, with a focus on enhancing purity, reducing viscosity for easier application, and tailoring properties to specific applications. This includes the development of specialized grades for high-performance applications in industries such as construction, water treatment, and food preservation. The market sees competitive advantages through proprietary formulations and specialized production processes, aiming to create highly efficient and sustainable products.
Key Drivers, Barriers & Challenges in Sodium Silicate Market
Key Drivers: The market is propelled by rising construction activity, escalating demand for detergents, and increasing focus on effective water treatment solutions. The ongoing development of sustainable and cost-effective production methods also plays a crucial role. Government regulations favoring environmentally friendly products also push market growth.
Key Challenges & Restraints: Fluctuations in raw material prices, stringent environmental regulations, and intense competition from substitute products present significant challenges. Supply chain disruptions can also cause production delays and impact market stability. The overall impact of these restraints is estimated to decrease the market CAGR by approximately xx% by 2033.
Growth Drivers in the Sodium Silicate Market Market
The key drivers for market growth include increasing industrialization in developing countries, the surge in construction activities worldwide, the rise in demand for eco-friendly detergents, and the growing necessity for efficient water treatment solutions. Technological advancements resulting in improved product quality and wider applications are also important growth drivers.
Challenges Impacting Sodium Silicate Market Growth
Major challenges include volatility in raw material costs, the stringent environmental regulations impacting manufacturing processes, and intense competition from substitute materials. Supply chain disruptions and the potential for trade wars further complicate market stability and growth projections.
Key Players Shaping the Sodium Silicate Market Market
- Kiran Global Chem Limited
- Occidental Petroleum Corporation
- FUJI SILYSIA CHEMICAL LTD
- Hindcon
- Evonik Industries AG
- Silmaco
- BASF SE
- PQ Corporation
- Z Ch Rudniki S A
- C THAI GROUP
- Alumina doo Zvornik
- W R Grace & Co -Conn
- CIECH Group
Significant Sodium Silicate Market Industry Milestones
- September 2022: Evonik's strategic cooperation with the Porner Group and Phichit Bio Power Co., Ltd. to supply sustainable ULTRASIL precipitated silica to tire manufacturers highlights the industry's focus on sustainability and innovation. This partnership significantly broadens Evonik's reach within the precipitated silica market, a key segment within the wider sodium silicate industry.
Future Outlook for Sodium Silicate Market Market
The Sodium Silicate market is poised for continued growth, driven by expanding industrial applications, increasing infrastructure development, and the growing adoption of sustainable solutions. Strategic partnerships, technological advancements, and the exploration of new applications will further shape the market dynamics, presenting lucrative opportunities for both established players and new entrants. The market is projected to witness robust growth exceeding xx Billion by 2033, with significant potential in emerging economies.
Sodium Silicate Market Segmentation
-
1. Type
- 1.1. Solid
- 1.2. Liquid
-
2. Application
- 2.1. Adhesives and Paints
- 2.2. Detergents
- 2.3. Food Preservation
- 2.4. Precipitated Silica
- 2.5. Paper Production
- 2.6. Water Treatment
- 2.7. Other Applications (Construction, Metal Casting)
Sodium Silicate Market Segmentation By Geography
-
1. Asia Pacific
- 1.1. China
- 1.2. India
- 1.3. Japan
- 1.4. South Korea
- 1.5. Rest of Asia Pacific
-
2. North America
- 2.1. United States
- 2.2. Canada
- 2.3. Mexico
-
3. Europe
- 3.1. Germany
- 3.2. United Kingdom
- 3.3. Italy
- 3.4. France
- 3.5. Rest of Europe
-
4. South America
- 4.1. Brazil
- 4.2. Argentina
- 4.3. Rest of South America
-
5. Middle East and Africa
- 5.1. Saudi Arabia
- 5.2. South Africa
- 5.3. Rest of Middle East and Africa
Sodium Silicate Market Regional Market Share
Geographic Coverage of Sodium Silicate Market
Sodium Silicate Market REPORT HIGHLIGHTS
| Aspects | Details |
|---|---|
| Study Period | 2020-2034 |
| Base Year | 2025 |
| Estimated Year | 2026 |
| Forecast Period | 2026-2034 |
| Historical Period | 2020-2025 |
| Growth Rate | CAGR of 3.6% from 2020-2034 |
| Segmentation |
|
Table of Contents
- 1. Introduction
- 1.1. Research Scope
- 1.2. Market Segmentation
- 1.3. Research Objective
- 1.4. Definitions and Assumptions
- 2. Executive Summary
- 2.1. Market Snapshot
- 3. Market Dynamics
- 3.1. Market Drivers
- 3.2. Market Restrains
- 3.3. Market Trends
- 3.4. Market Opportunities
- 4. Market Factor Analysis
- 4.1. Porters Five Forces
- 4.1.1. Bargaining Power of Suppliers
- 4.1.2. Bargaining Power of Buyers
- 4.1.3. Threat of New Entrants
- 4.1.4. Threat of Substitutes
- 4.1.5. Competitive Rivalry
- 4.2. PESTEL analysis
- 4.3. BCG Analysis
- 4.3.1. Stars (High Growth, High Market Share)
- 4.3.2. Cash Cows (Low Growth, High Market Share)
- 4.3.3. Question Mark (High Growth, Low Market Share)
- 4.3.4. Dogs (Low Growth, Low Market Share)
- 4.4. Ansoff Matrix Analysis
- 4.5. Supply Chain Analysis
- 4.6. Regulatory Landscape
- 4.7. Current Market Potential and Opportunity Assessment (TAM–SAM–SOM Framework)
- 4.8. TIR Analyst Note
- 4.1. Porters Five Forces
- 5. Market Analysis, Insights and Forecast 2021-2033
- 5.1. Market Analysis, Insights and Forecast - by Type
- 5.1.1. Solid
- 5.1.2. Liquid
- 5.2. Market Analysis, Insights and Forecast - by Application
- 5.2.1. Adhesives and Paints
- 5.2.2. Detergents
- 5.2.3. Food Preservation
- 5.2.4. Precipitated Silica
- 5.2.5. Paper Production
- 5.2.6. Water Treatment
- 5.2.7. Other Applications (Construction, Metal Casting)
- 5.3. Market Analysis, Insights and Forecast - by Region
- 5.3.1. Asia Pacific
- 5.3.2. North America
- 5.3.3. Europe
- 5.3.4. South America
- 5.3.5. Middle East and Africa
- 5.1. Market Analysis, Insights and Forecast - by Type
- 6. Global Sodium Silicate Market Analysis, Insights and Forecast, 2021-2033
- 6.1. Market Analysis, Insights and Forecast - by Type
- 6.1.1. Solid
- 6.1.2. Liquid
- 6.2. Market Analysis, Insights and Forecast - by Application
- 6.2.1. Adhesives and Paints
- 6.2.2. Detergents
- 6.2.3. Food Preservation
- 6.2.4. Precipitated Silica
- 6.2.5. Paper Production
- 6.2.6. Water Treatment
- 6.2.7. Other Applications (Construction, Metal Casting)
- 6.1. Market Analysis, Insights and Forecast - by Type
- 7. Asia Pacific Sodium Silicate Market Analysis, Insights and Forecast, 2020-2032
- 7.1. Market Analysis, Insights and Forecast - by Type
- 7.1.1. Solid
- 7.1.2. Liquid
- 7.2. Market Analysis, Insights and Forecast - by Application
- 7.2.1. Adhesives and Paints
- 7.2.2. Detergents
- 7.2.3. Food Preservation
- 7.2.4. Precipitated Silica
- 7.2.5. Paper Production
- 7.2.6. Water Treatment
- 7.2.7. Other Applications (Construction, Metal Casting)
- 7.1. Market Analysis, Insights and Forecast - by Type
- 8. North America Sodium Silicate Market Analysis, Insights and Forecast, 2020-2032
- 8.1. Market Analysis, Insights and Forecast - by Type
- 8.1.1. Solid
- 8.1.2. Liquid
- 8.2. Market Analysis, Insights and Forecast - by Application
- 8.2.1. Adhesives and Paints
- 8.2.2. Detergents
- 8.2.3. Food Preservation
- 8.2.4. Precipitated Silica
- 8.2.5. Paper Production
- 8.2.6. Water Treatment
- 8.2.7. Other Applications (Construction, Metal Casting)
- 8.1. Market Analysis, Insights and Forecast - by Type
- 9. Europe Sodium Silicate Market Analysis, Insights and Forecast, 2020-2032
- 9.1. Market Analysis, Insights and Forecast - by Type
- 9.1.1. Solid
- 9.1.2. Liquid
- 9.2. Market Analysis, Insights and Forecast - by Application
- 9.2.1. Adhesives and Paints
- 9.2.2. Detergents
- 9.2.3. Food Preservation
- 9.2.4. Precipitated Silica
- 9.2.5. Paper Production
- 9.2.6. Water Treatment
- 9.2.7. Other Applications (Construction, Metal Casting)
- 9.1. Market Analysis, Insights and Forecast - by Type
- 10. South America Sodium Silicate Market Analysis, Insights and Forecast, 2020-2032
- 10.1. Market Analysis, Insights and Forecast - by Type
- 10.1.1. Solid
- 10.1.2. Liquid
- 10.2. Market Analysis, Insights and Forecast - by Application
- 10.2.1. Adhesives and Paints
- 10.2.2. Detergents
- 10.2.3. Food Preservation
- 10.2.4. Precipitated Silica
- 10.2.5. Paper Production
- 10.2.6. Water Treatment
- 10.2.7. Other Applications (Construction, Metal Casting)
- 10.1. Market Analysis, Insights and Forecast - by Type
- 11. Middle East and Africa Sodium Silicate Market Analysis, Insights and Forecast, 2020-2032
- 11.1. Market Analysis, Insights and Forecast - by Type
- 11.1.1. Solid
- 11.1.2. Liquid
- 11.2. Market Analysis, Insights and Forecast - by Application
- 11.2.1. Adhesives and Paints
- 11.2.2. Detergents
- 11.2.3. Food Preservation
- 11.2.4. Precipitated Silica
- 11.2.5. Paper Production
- 11.2.6. Water Treatment
- 11.2.7. Other Applications (Construction, Metal Casting)
- 11.1. Market Analysis, Insights and Forecast - by Type
- 12. Competitive Analysis
- 12.1. Company Profiles
- 12.1.1 Kiran Global Chem Limited
- 12.1.1.1. Company Overview
- 12.1.1.2. Products
- 12.1.1.3. Company Financials
- 12.1.1.4. SWOT Analysis
- 12.1.2 Occidental Petroleum Corporation
- 12.1.2.1. Company Overview
- 12.1.2.2. Products
- 12.1.2.3. Company Financials
- 12.1.2.4. SWOT Analysis
- 12.1.3 FUJI SILYSIA CHEMICAL LTD
- 12.1.3.1. Company Overview
- 12.1.3.2. Products
- 12.1.3.3. Company Financials
- 12.1.3.4. SWOT Analysis
- 12.1.4 Hindcon
- 12.1.4.1. Company Overview
- 12.1.4.2. Products
- 12.1.4.3. Company Financials
- 12.1.4.4. SWOT Analysis
- 12.1.5 Evonik Industries AG
- 12.1.5.1. Company Overview
- 12.1.5.2. Products
- 12.1.5.3. Company Financials
- 12.1.5.4. SWOT Analysis
- 12.1.6 Silmaco
- 12.1.6.1. Company Overview
- 12.1.6.2. Products
- 12.1.6.3. Company Financials
- 12.1.6.4. SWOT Analysis
- 12.1.7 BASF SE
- 12.1.7.1. Company Overview
- 12.1.7.2. Products
- 12.1.7.3. Company Financials
- 12.1.7.4. SWOT Analysis
- 12.1.8 PQ Corporation
- 12.1.8.1. Company Overview
- 12.1.8.2. Products
- 12.1.8.3. Company Financials
- 12.1.8.4. SWOT Analysis
- 12.1.9 Z Ch Rudniki S A
- 12.1.9.1. Company Overview
- 12.1.9.2. Products
- 12.1.9.3. Company Financials
- 12.1.9.4. SWOT Analysis
- 12.1.10 C THAI GROUP
- 12.1.10.1. Company Overview
- 12.1.10.2. Products
- 12.1.10.3. Company Financials
- 12.1.10.4. SWOT Analysis
- 12.1.11 Alumina doo Zvornik
- 12.1.11.1. Company Overview
- 12.1.11.2. Products
- 12.1.11.3. Company Financials
- 12.1.11.4. SWOT Analysis
- 12.1.12 W R Grace & Co -Conn
- 12.1.12.1. Company Overview
- 12.1.12.2. Products
- 12.1.12.3. Company Financials
- 12.1.12.4. SWOT Analysis
- 12.1.13 CIECH Group
- 12.1.13.1. Company Overview
- 12.1.13.2. Products
- 12.1.13.3. Company Financials
- 12.1.13.4. SWOT Analysis
- 12.1.1 Kiran Global Chem Limited
- 12.2. Market Entropy
- 12.2.1 Company's Key Areas Served
- 12.2.2 Recent Developments
- 12.3. Company Market Share Analysis 2025
- 12.3.1 Top 5 Companies Market Share Analysis
- 12.3.2 Top 3 Companies Market Share Analysis
- 12.4. List of Potential Customers
- 13. Research Methodology
List of Figures
- Figure 1: Global Sodium Silicate Market Revenue Breakdown (Billion, %) by Region 2025 & 2033
- Figure 2: Global Sodium Silicate Market Volume Breakdown (K Tons, %) by Region 2025 & 2033
- Figure 3: Asia Pacific Sodium Silicate Market Revenue (Billion), by Type 2025 & 2033
- Figure 4: Asia Pacific Sodium Silicate Market Volume (K Tons), by Type 2025 & 2033
- Figure 5: Asia Pacific Sodium Silicate Market Revenue Share (%), by Type 2025 & 2033
- Figure 6: Asia Pacific Sodium Silicate Market Volume Share (%), by Type 2025 & 2033
- Figure 7: Asia Pacific Sodium Silicate Market Revenue (Billion), by Application 2025 & 2033
- Figure 8: Asia Pacific Sodium Silicate Market Volume (K Tons), by Application 2025 & 2033
- Figure 9: Asia Pacific Sodium Silicate Market Revenue Share (%), by Application 2025 & 2033
- Figure 10: Asia Pacific Sodium Silicate Market Volume Share (%), by Application 2025 & 2033
- Figure 11: Asia Pacific Sodium Silicate Market Revenue (Billion), by Country 2025 & 2033
- Figure 12: Asia Pacific Sodium Silicate Market Volume (K Tons), by Country 2025 & 2033
- Figure 13: Asia Pacific Sodium Silicate Market Revenue Share (%), by Country 2025 & 2033
- Figure 14: Asia Pacific Sodium Silicate Market Volume Share (%), by Country 2025 & 2033
- Figure 15: North America Sodium Silicate Market Revenue (Billion), by Type 2025 & 2033
- Figure 16: North America Sodium Silicate Market Volume (K Tons), by Type 2025 & 2033
- Figure 17: North America Sodium Silicate Market Revenue Share (%), by Type 2025 & 2033
- Figure 18: North America Sodium Silicate Market Volume Share (%), by Type 2025 & 2033
- Figure 19: North America Sodium Silicate Market Revenue (Billion), by Application 2025 & 2033
- Figure 20: North America Sodium Silicate Market Volume (K Tons), by Application 2025 & 2033
- Figure 21: North America Sodium Silicate Market Revenue Share (%), by Application 2025 & 2033
- Figure 22: North America Sodium Silicate Market Volume Share (%), by Application 2025 & 2033
- Figure 23: North America Sodium Silicate Market Revenue (Billion), by Country 2025 & 2033
- Figure 24: North America Sodium Silicate Market Volume (K Tons), by Country 2025 & 2033
- Figure 25: North America Sodium Silicate Market Revenue Share (%), by Country 2025 & 2033
- Figure 26: North America Sodium Silicate Market Volume Share (%), by Country 2025 & 2033
- Figure 27: Europe Sodium Silicate Market Revenue (Billion), by Type 2025 & 2033
- Figure 28: Europe Sodium Silicate Market Volume (K Tons), by Type 2025 & 2033
- Figure 29: Europe Sodium Silicate Market Revenue Share (%), by Type 2025 & 2033
- Figure 30: Europe Sodium Silicate Market Volume Share (%), by Type 2025 & 2033
- Figure 31: Europe Sodium Silicate Market Revenue (Billion), by Application 2025 & 2033
- Figure 32: Europe Sodium Silicate Market Volume (K Tons), by Application 2025 & 2033
- Figure 33: Europe Sodium Silicate Market Revenue Share (%), by Application 2025 & 2033
- Figure 34: Europe Sodium Silicate Market Volume Share (%), by Application 2025 & 2033
- Figure 35: Europe Sodium Silicate Market Revenue (Billion), by Country 2025 & 2033
- Figure 36: Europe Sodium Silicate Market Volume (K Tons), by Country 2025 & 2033
- Figure 37: Europe Sodium Silicate Market Revenue Share (%), by Country 2025 & 2033
- Figure 38: Europe Sodium Silicate Market Volume Share (%), by Country 2025 & 2033
- Figure 39: South America Sodium Silicate Market Revenue (Billion), by Type 2025 & 2033
- Figure 40: South America Sodium Silicate Market Volume (K Tons), by Type 2025 & 2033
- Figure 41: South America Sodium Silicate Market Revenue Share (%), by Type 2025 & 2033
- Figure 42: South America Sodium Silicate Market Volume Share (%), by Type 2025 & 2033
- Figure 43: South America Sodium Silicate Market Revenue (Billion), by Application 2025 & 2033
- Figure 44: South America Sodium Silicate Market Volume (K Tons), by Application 2025 & 2033
- Figure 45: South America Sodium Silicate Market Revenue Share (%), by Application 2025 & 2033
- Figure 46: South America Sodium Silicate Market Volume Share (%), by Application 2025 & 2033
- Figure 47: South America Sodium Silicate Market Revenue (Billion), by Country 2025 & 2033
- Figure 48: South America Sodium Silicate Market Volume (K Tons), by Country 2025 & 2033
- Figure 49: South America Sodium Silicate Market Revenue Share (%), by Country 2025 & 2033
- Figure 50: South America Sodium Silicate Market Volume Share (%), by Country 2025 & 2033
- Figure 51: Middle East and Africa Sodium Silicate Market Revenue (Billion), by Type 2025 & 2033
- Figure 52: Middle East and Africa Sodium Silicate Market Volume (K Tons), by Type 2025 & 2033
- Figure 53: Middle East and Africa Sodium Silicate Market Revenue Share (%), by Type 2025 & 2033
- Figure 54: Middle East and Africa Sodium Silicate Market Volume Share (%), by Type 2025 & 2033
- Figure 55: Middle East and Africa Sodium Silicate Market Revenue (Billion), by Application 2025 & 2033
- Figure 56: Middle East and Africa Sodium Silicate Market Volume (K Tons), by Application 2025 & 2033
- Figure 57: Middle East and Africa Sodium Silicate Market Revenue Share (%), by Application 2025 & 2033
- Figure 58: Middle East and Africa Sodium Silicate Market Volume Share (%), by Application 2025 & 2033
- Figure 59: Middle East and Africa Sodium Silicate Market Revenue (Billion), by Country 2025 & 2033
- Figure 60: Middle East and Africa Sodium Silicate Market Volume (K Tons), by Country 2025 & 2033
- Figure 61: Middle East and Africa Sodium Silicate Market Revenue Share (%), by Country 2025 & 2033
- Figure 62: Middle East and Africa Sodium Silicate Market Volume Share (%), by Country 2025 & 2033
List of Tables
- Table 1: Global Sodium Silicate Market Revenue Billion Forecast, by Type 2020 & 2033
- Table 2: Global Sodium Silicate Market Volume K Tons Forecast, by Type 2020 & 2033
- Table 3: Global Sodium Silicate Market Revenue Billion Forecast, by Application 2020 & 2033
- Table 4: Global Sodium Silicate Market Volume K Tons Forecast, by Application 2020 & 2033
- Table 5: Global Sodium Silicate Market Revenue Billion Forecast, by Region 2020 & 2033
- Table 6: Global Sodium Silicate Market Volume K Tons Forecast, by Region 2020 & 2033
- Table 7: Global Sodium Silicate Market Revenue Billion Forecast, by Type 2020 & 2033
- Table 8: Global Sodium Silicate Market Volume K Tons Forecast, by Type 2020 & 2033
- Table 9: Global Sodium Silicate Market Revenue Billion Forecast, by Application 2020 & 2033
- Table 10: Global Sodium Silicate Market Volume K Tons Forecast, by Application 2020 & 2033
- Table 11: Global Sodium Silicate Market Revenue Billion Forecast, by Country 2020 & 2033
- Table 12: Global Sodium Silicate Market Volume K Tons Forecast, by Country 2020 & 2033
- Table 13: China Sodium Silicate Market Revenue (Billion) Forecast, by Application 2020 & 2033
- Table 14: China Sodium Silicate Market Volume (K Tons) Forecast, by Application 2020 & 2033
- Table 15: India Sodium Silicate Market Revenue (Billion) Forecast, by Application 2020 & 2033
- Table 16: India Sodium Silicate Market Volume (K Tons) Forecast, by Application 2020 & 2033
- Table 17: Japan Sodium Silicate Market Revenue (Billion) Forecast, by Application 2020 & 2033
- Table 18: Japan Sodium Silicate Market Volume (K Tons) Forecast, by Application 2020 & 2033
- Table 19: South Korea Sodium Silicate Market Revenue (Billion) Forecast, by Application 2020 & 2033
- Table 20: South Korea Sodium Silicate Market Volume (K Tons) Forecast, by Application 2020 & 2033
- Table 21: Rest of Asia Pacific Sodium Silicate Market Revenue (Billion) Forecast, by Application 2020 & 2033
- Table 22: Rest of Asia Pacific Sodium Silicate Market Volume (K Tons) Forecast, by Application 2020 & 2033
- Table 23: Global Sodium Silicate Market Revenue Billion Forecast, by Type 2020 & 2033
- Table 24: Global Sodium Silicate Market Volume K Tons Forecast, by Type 2020 & 2033
- Table 25: Global Sodium Silicate Market Revenue Billion Forecast, by Application 2020 & 2033
- Table 26: Global Sodium Silicate Market Volume K Tons Forecast, by Application 2020 & 2033
- Table 27: Global Sodium Silicate Market Revenue Billion Forecast, by Country 2020 & 2033
- Table 28: Global Sodium Silicate Market Volume K Tons Forecast, by Country 2020 & 2033
- Table 29: United States Sodium Silicate Market Revenue (Billion) Forecast, by Application 2020 & 2033
- Table 30: United States Sodium Silicate Market Volume (K Tons) Forecast, by Application 2020 & 2033
- Table 31: Canada Sodium Silicate Market Revenue (Billion) Forecast, by Application 2020 & 2033
- Table 32: Canada Sodium Silicate Market Volume (K Tons) Forecast, by Application 2020 & 2033
- Table 33: Mexico Sodium Silicate Market Revenue (Billion) Forecast, by Application 2020 & 2033
- Table 34: Mexico Sodium Silicate Market Volume (K Tons) Forecast, by Application 2020 & 2033
- Table 35: Global Sodium Silicate Market Revenue Billion Forecast, by Type 2020 & 2033
- Table 36: Global Sodium Silicate Market Volume K Tons Forecast, by Type 2020 & 2033
- Table 37: Global Sodium Silicate Market Revenue Billion Forecast, by Application 2020 & 2033
- Table 38: Global Sodium Silicate Market Volume K Tons Forecast, by Application 2020 & 2033
- Table 39: Global Sodium Silicate Market Revenue Billion Forecast, by Country 2020 & 2033
- Table 40: Global Sodium Silicate Market Volume K Tons Forecast, by Country 2020 & 2033
- Table 41: Germany Sodium Silicate Market Revenue (Billion) Forecast, by Application 2020 & 2033
- Table 42: Germany Sodium Silicate Market Volume (K Tons) Forecast, by Application 2020 & 2033
- Table 43: United Kingdom Sodium Silicate Market Revenue (Billion) Forecast, by Application 2020 & 2033
- Table 44: United Kingdom Sodium Silicate Market Volume (K Tons) Forecast, by Application 2020 & 2033
- Table 45: Italy Sodium Silicate Market Revenue (Billion) Forecast, by Application 2020 & 2033
- Table 46: Italy Sodium Silicate Market Volume (K Tons) Forecast, by Application 2020 & 2033
- Table 47: France Sodium Silicate Market Revenue (Billion) Forecast, by Application 2020 & 2033
- Table 48: France Sodium Silicate Market Volume (K Tons) Forecast, by Application 2020 & 2033
- Table 49: Rest of Europe Sodium Silicate Market Revenue (Billion) Forecast, by Application 2020 & 2033
- Table 50: Rest of Europe Sodium Silicate Market Volume (K Tons) Forecast, by Application 2020 & 2033
- Table 51: Global Sodium Silicate Market Revenue Billion Forecast, by Type 2020 & 2033
- Table 52: Global Sodium Silicate Market Volume K Tons Forecast, by Type 2020 & 2033
- Table 53: Global Sodium Silicate Market Revenue Billion Forecast, by Application 2020 & 2033
- Table 54: Global Sodium Silicate Market Volume K Tons Forecast, by Application 2020 & 2033
- Table 55: Global Sodium Silicate Market Revenue Billion Forecast, by Country 2020 & 2033
- Table 56: Global Sodium Silicate Market Volume K Tons Forecast, by Country 2020 & 2033
- Table 57: Brazil Sodium Silicate Market Revenue (Billion) Forecast, by Application 2020 & 2033
- Table 58: Brazil Sodium Silicate Market Volume (K Tons) Forecast, by Application 2020 & 2033
- Table 59: Argentina Sodium Silicate Market Revenue (Billion) Forecast, by Application 2020 & 2033
- Table 60: Argentina Sodium Silicate Market Volume (K Tons) Forecast, by Application 2020 & 2033
- Table 61: Rest of South America Sodium Silicate Market Revenue (Billion) Forecast, by Application 2020 & 2033
- Table 62: Rest of South America Sodium Silicate Market Volume (K Tons) Forecast, by Application 2020 & 2033
- Table 63: Global Sodium Silicate Market Revenue Billion Forecast, by Type 2020 & 2033
- Table 64: Global Sodium Silicate Market Volume K Tons Forecast, by Type 2020 & 2033
- Table 65: Global Sodium Silicate Market Revenue Billion Forecast, by Application 2020 & 2033
- Table 66: Global Sodium Silicate Market Volume K Tons Forecast, by Application 2020 & 2033
- Table 67: Global Sodium Silicate Market Revenue Billion Forecast, by Country 2020 & 2033
- Table 68: Global Sodium Silicate Market Volume K Tons Forecast, by Country 2020 & 2033
- Table 69: Saudi Arabia Sodium Silicate Market Revenue (Billion) Forecast, by Application 2020 & 2033
- Table 70: Saudi Arabia Sodium Silicate Market Volume (K Tons) Forecast, by Application 2020 & 2033
- Table 71: South Africa Sodium Silicate Market Revenue (Billion) Forecast, by Application 2020 & 2033
- Table 72: South Africa Sodium Silicate Market Volume (K Tons) Forecast, by Application 2020 & 2033
- Table 73: Rest of Middle East and Africa Sodium Silicate Market Revenue (Billion) Forecast, by Application 2020 & 2033
- Table 74: Rest of Middle East and Africa Sodium Silicate Market Volume (K Tons) Forecast, by Application 2020 & 2033
Frequently Asked Questions
1. What is the projected Compound Annual Growth Rate (CAGR) of the Sodium Silicate Market?
The projected CAGR is approximately 3.6%.
2. Which companies are prominent players in the Sodium Silicate Market?
Key companies in the market include Kiran Global Chem Limited, Occidental Petroleum Corporation, FUJI SILYSIA CHEMICAL LTD, Hindcon, Evonik Industries AG, Silmaco, BASF SE, PQ Corporation, Z Ch Rudniki S A, C THAI GROUP, Alumina doo Zvornik, W R Grace & Co -Conn, CIECH Group.
3. What are the main segments of the Sodium Silicate Market?
The market segments include Type, Application.
4. Can you provide details about the market size?
The market size is estimated to be USD 6.62 Billion as of 2022.
5. What are some drivers contributing to market growth?
Increasing Demand for Waste Paper Recycling; Rising Demand for Precipitated Silica from the Rubber and Tyre Industry; Other Drivers.
6. What are the notable trends driving market growth?
Detergents Segment to Witness Healthy Demand.
7. Are there any restraints impacting market growth?
Hazardous Effects of Sodium Silicate; Other Restraints.
8. Can you provide examples of recent developments in the market?
September 2022: Evonik, one of the world's leading silica producers, has entered a strategic cooperation with the Porner Group, Austria and Phichit Bio Power Co., Ltd., Thailand, to supply sustainable ULTRASIL precipitated silica to tire manufacturers.
9. What pricing options are available for accessing the report?
Pricing options include single-user, multi-user, and enterprise licenses priced at USD 4750, USD 5250, and USD 8750 respectively.
10. Is the market size provided in terms of value or volume?
The market size is provided in terms of value, measured in Billion and volume, measured in K Tons.
11. Are there any specific market keywords associated with the report?
Yes, the market keyword associated with the report is "Sodium Silicate Market," which aids in identifying and referencing the specific market segment covered.
12. How do I determine which pricing option suits my needs best?
The pricing options vary based on user requirements and access needs. Individual users may opt for single-user licenses, while businesses requiring broader access may choose multi-user or enterprise licenses for cost-effective access to the report.
13. Are there any additional resources or data provided in the Sodium Silicate Market report?
While the report offers comprehensive insights, it's advisable to review the specific contents or supplementary materials provided to ascertain if additional resources or data are available.
14. How can I stay updated on further developments or reports in the Sodium Silicate Market?
To stay informed about further developments, trends, and reports in the Sodium Silicate Market, consider subscribing to industry newsletters, following relevant companies and organizations, or regularly checking reputable industry news sources and publications.
Methodology
Step 1 - Identification of Relevant Samples Size from Population Database


Step 2 - Approaches for Defining Global Market Size (Value, Volume* & Price*)

Note*: In applicable scenarios
Step 3 - Data Sources
Primary Research
- Web Analytics
- Survey Reports
- Research Institute
- Latest Research Reports
- Opinion Leaders
Secondary Research
- Annual Reports
- White Paper
- Latest Press Release
- Industry Association
- Paid Database
- Investor Presentations

Step 4 - Data Triangulation
Involves using different sources of information in order to increase the validity of a study
These sources are likely to be stakeholders in a program - participants, other researchers, program staff, other community members, and so on.
Then we put all data in single framework & apply various statistical tools to find out the dynamic on the market.
During the analysis stage, feedback from the stakeholder groups would be compared to determine areas of agreement as well as areas of divergence