

Key Insights
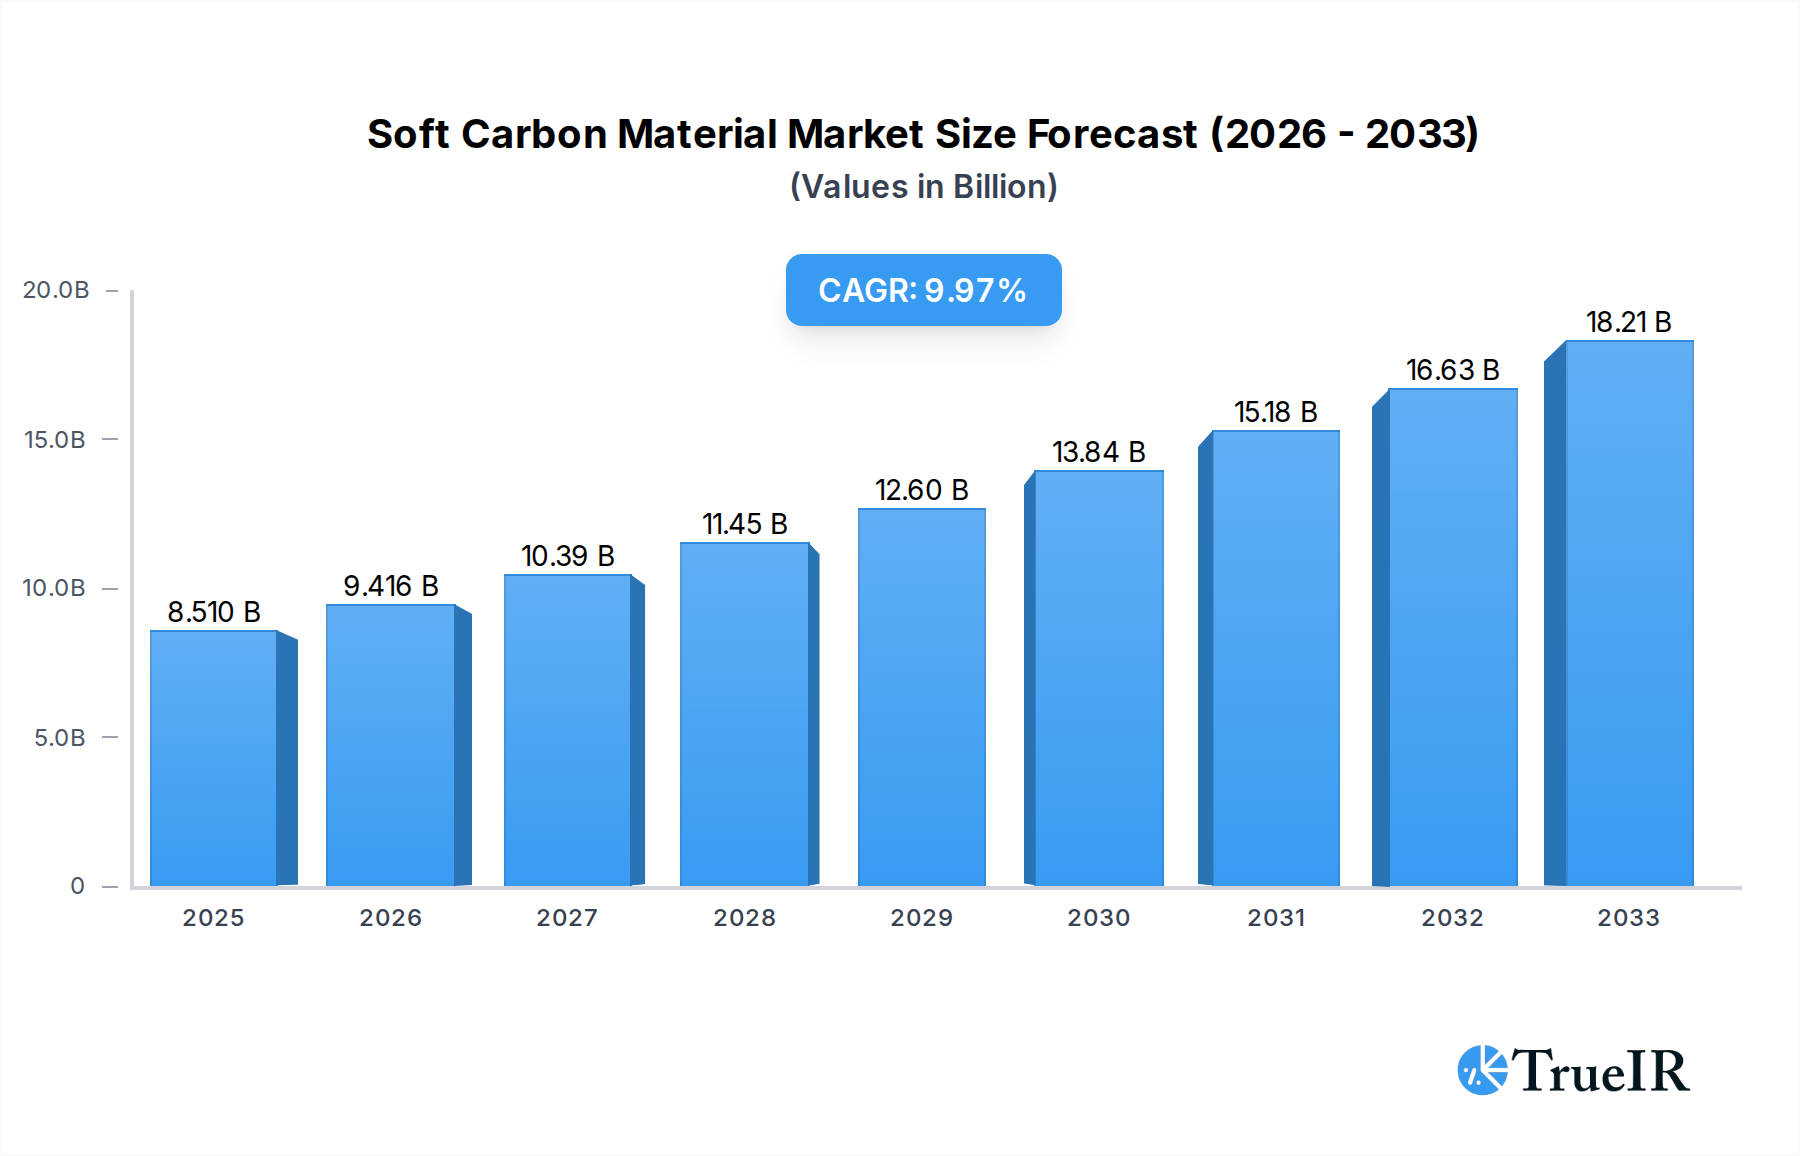
The global soft carbon material market is poised for significant expansion, with an estimated market size of USD 8.51 billion in 2025. This robust growth is propelled by a compelling compound annual growth rate (CAGR) of 10.59% projected over the forecast period of 2025-2033. A primary driver fueling this surge is the escalating demand from the electric vehicle (EV) and hybrid electric vehicle (HEV) sector. As the world transitions towards sustainable transportation, the need for advanced battery materials, where soft carbon plays a crucial role as an anode material, is experiencing unprecedented growth. The digital battery segment also presents a substantial opportunity, driven by the increasing adoption of portable electronics, smart devices, and energy storage solutions. Furthermore, the application in electric tools, characterized by their growing popularity in both industrial and consumer markets, contributes to the overall market buoyancy.

Soft Carbon Material Market Size (In Billion)
Several key trends are shaping the trajectory of the soft carbon material market. The continuous innovation in material science is leading to the development of higher performance soft carbon grades, enhancing battery energy density and lifespan. This technological advancement is crucial for meeting the evolving demands of the EV and electronics industries. The growing emphasis on sustainable manufacturing processes and the exploration of alternative sourcing methods for petroleum coke, alongside the development of novel production techniques for other soft carbon types, are also shaping the market landscape. While the market demonstrates strong growth potential, it faces certain restraints. Fluctuations in the price and availability of raw materials, particularly petroleum coke, can impact production costs and market stability. Moreover, stringent environmental regulations related to material processing and disposal necessitate ongoing investment in eco-friendly technologies, which could present a challenge for some market participants.
Soft Carbon Material Company Market Share
Soft Carbon Material Market: In-Depth Analysis and Future Projections (2019-2033)
This comprehensive report offers a deep dive into the global Soft Carbon Material market, projecting a market size exceeding one billion dollars by the base year 2025 and continuing its robust expansion through 2033. Leveraging advanced analytical methodologies, we dissect the intricate market structure, pinpoint key trends, and forecast future growth trajectories for this critical material powering the next generation of energy storage and advanced applications. Our study period spans from 2019 to 2033, with a focused analysis on the historical period of 2019-2024, a base year of 2025, and an estimated year also of 2025, culminating in a detailed forecast for the period of 2025–2033.
Soft Carbon Material Market Structure & Competitive Landscape
The global Soft Carbon Material market exhibits a moderate to high concentration, with leading players continuously investing in research and development to secure market share. Innovation drivers are predominantly centered around enhancing material performance for high-density energy storage solutions, leading to the development of novel processing techniques and formulations. Regulatory impacts are increasingly significant, particularly concerning environmental sustainability and material safety standards across key regions. Product substitutes, while present in niche applications, are largely unable to match the performance and cost-effectiveness of advanced soft carbon materials for their primary uses. End-user segmentation reveals a strong reliance on the electric vehicle (EV/HEV) and digital battery sectors, with electric tools also contributing substantially. Mergers and acquisitions (M&A) activity is a notable trend, with an estimated volume of over ten billion dollars in M&A deals observed during the historical period, indicating consolidation and strategic expansion by major entities. The competitive landscape is characterized by strategic partnerships and technological collaborations, aiming to accelerate product development and market penetration.
Soft Carbon Material Market Trends & Opportunities
The global Soft Carbon Material market is on an upward trajectory, projected to witness a Compound Annual Growth Rate (CAGR) of over fifteen percent between 2025 and 2033, expanding from an estimated market size of one billion dollars in 2025 to well over three billion dollars by 2033. This remarkable growth is underpinned by several converging trends and significant opportunities. The burgeoning demand for electric vehicles (EVs) and hybrid electric vehicles (HEVs) stands as a primary catalyst, with soft carbon materials being indispensable for advanced battery anodes that enable longer ranges and faster charging times. The increasing global push towards electrification of transportation, supported by government incentives and expanding charging infrastructure, directly fuels this demand.
Furthermore, the proliferation of portable electronic devices, from smartphones and laptops to advanced wearables and medical equipment, continues to drive the market for high-performance digital batteries. Soft carbon materials offer superior energy density and cycle life, making them crucial for meeting the ever-increasing power requirements of these devices. The "Internet of Things" (IoT) revolution, with its vast network of connected devices, further amplifies the need for reliable and efficient battery solutions, creating a significant opportunity for soft carbon material manufacturers.
Technological advancements are playing a pivotal role in shaping market dynamics. Innovations in material synthesis, purification, and processing are leading to softer carbon materials with enhanced conductivity, improved structural integrity, and greater electrochemical stability. These improvements translate directly into batteries with higher energy density, faster charge/discharge rates, and longer lifespans. Opportunities exist for companies that can develop cost-effective, large-scale production methods for these advanced materials.
Consumer preferences are also evolving, with a growing emphasis on sustainability and performance. Consumers are increasingly seeking products with longer battery life and faster charging capabilities, while also being more aware of the environmental impact of their purchases. This creates a demand for soft carbon materials that contribute to the development of greener and more efficient energy storage solutions. The circular economy is also becoming a consideration, with research into recycling and recovery of soft carbon materials gaining traction.
The competitive dynamics are intensifying, with key players focusing on vertical integration, strategic alliances, and product differentiation. Companies that can offer customized solutions tailored to specific application requirements, coupled with a strong emphasis on quality and reliability, are poised to capture significant market share. Opportunities for market penetration are also present in emerging economies where electrification is rapidly gaining momentum, presenting a substantial growth runway. The overall market penetration rate for advanced soft carbon materials is still relatively low in many applications, indicating ample room for expansion.
Dominant Markets & Segments in Soft Carbon Material
The EV/HEV application segment is the undisputed dominant market within the Soft Carbon Material industry, projected to account for over sixty percent of the global market share by 2033. This dominance is driven by a confluence of powerful growth drivers.
- Government Policies and Incentives: Favorable regulations, subsidies for electric vehicle purchases, and stringent emission standards worldwide are aggressively promoting EV adoption, directly boosting demand for high-performance battery components like soft carbon materials. For instance, policies aiming for a complete phase-out of internal combustion engine vehicles in various nations by 2030-2040 create a clear and sustained demand signal.
- Expanding Charging Infrastructure: The continuous build-out of public and private charging networks significantly alleviates range anxiety, a major barrier to EV adoption, thereby accelerating the shift towards electric mobility and consequently, the need for advanced batteries. The global investment in charging infrastructure is projected to exceed one hundred billion dollars by 2030.
- Technological Advancements in Battery Technology: Breakthroughs in lithium-ion battery technology, particularly in anode materials, are heavily reliant on the unique properties of soft carbon. These advancements enable higher energy density, faster charging, and longer cycle life, critical for making EVs competitive with traditional vehicles. The performance gains in energy density for EV batteries are expected to grow by approximately fifteen percent per annum.
- Consumer Demand for Sustainable Transportation: Growing environmental consciousness among consumers is leading to a significant preference for EVs, further solidifying the position of soft carbon materials in this sector. The global market for electric vehicles is anticipated to grow at a CAGR exceeding twenty percent in the coming decade.
Within the Petroleum Coke Source type, this segment is expected to maintain its leadership due to its established production infrastructure and cost-effectiveness for large-scale applications, especially in the burgeoning EV sector. The sheer volume of petroleum coke available globally, coupled with ongoing refinements in its processing for battery-grade materials, positions it as a cornerstone for current and near-future soft carbon material production. Investments in upgrading petroleum coke processing facilities are estimated to reach over twenty billion dollars globally by 2028.
Regionally, Asia Pacific is poised to remain the dominant market, driven by its strong manufacturing base for batteries and EVs, particularly in China, South Korea, and Japan. The region's proactive government support for the electric vehicle industry, coupled with substantial investments in battery manufacturing capacity, makes it a critical hub for soft carbon material consumption and innovation. The presence of key players like Shanshan Technology and BTR New Material further solidifies Asia Pacific's leadership.
Soft Carbon Material Product Analysis
Soft carbon materials are characterized by their unique graphitic structure, offering excellent electrical conductivity, high surface area, and superior electrochemical stability. These properties make them ideal for advanced battery applications, particularly as anode materials in lithium-ion batteries for electric vehicles and digital devices. Product innovations are focused on enhancing energy density, improving cycle life, and reducing charging times, leading to the development of tailored soft carbon grades for specific performance requirements. Competitive advantages lie in achieving high purity, controlled particle size distribution, and optimized surface morphology to maximize performance and cost-effectiveness in demanding energy storage solutions.
Key Drivers, Barriers & Challenges in Soft Carbon Material
The Soft Carbon Material market is propelled by technological advancements in energy storage, particularly the burgeoning demand for electric vehicles (EVs) and portable electronics, requiring high-performance battery anodes. Supportive government policies and subsidies for EV adoption globally are significant economic drivers, creating a robust market for these materials.
Key challenges include fluctuations in raw material prices, such as petroleum coke, and the complexities of scaling up production of high-purity, battery-grade soft carbon materials. Stringent environmental regulations regarding the sourcing and processing of raw materials can also pose regulatory hurdles. Competitive pressures from alternative anode materials and the need for continuous innovation to maintain market leadership are also critical factors.
Growth Drivers in the Soft Carbon Material Market
The primary growth drivers for the Soft Carbon Material market are intrinsically linked to the global transition towards electrification, most notably the explosive growth in the electric vehicle (EV) sector. Government mandates, subsidies, and tax incentives for EV adoption are creating sustained demand for advanced battery components. Furthermore, the expanding market for portable electronics, including smartphones, laptops, and wearables, necessitates high-density and long-lasting batteries, further fueling the need for superior anode materials like soft carbon. Technological innovations in battery chemistry, leading to improved energy density and faster charging capabilities, are also critical drivers, encouraging further research and development in soft carbon material science.
Challenges Impacting Soft Carbon Material Growth
Despite robust growth, the Soft Carbon Material market faces several key challenges. Price volatility of raw materials, particularly petroleum coke, can impact manufacturing costs and profitability. The complexities and high costs associated with scaling up production of premium battery-grade soft carbon materials to meet surging demand present a significant hurdle. Additionally, increasingly stringent environmental regulations related to the sourcing, processing, and disposal of materials can lead to compliance costs and operational disruptions. Intense competitive pressures from both established and emerging players, as well as ongoing research into alternative anode materials, necessitate continuous innovation and cost optimization to maintain market share.
Key Players Shaping the Soft Carbon Material Market
- Power Carbon Technology
- Shanshan Technology
- BTR New Material
- KPC
Significant Soft Carbon Material Industry Milestones
- 2019: Increased investment in R&D for advanced anode materials to meet evolving EV battery requirements.
- 2020: Growing adoption of soft carbon materials in next-generation lithium-ion batteries for enhanced energy density.
- 2021: Significant surge in demand for soft carbon due to accelerated EV production globally.
- 2022: Advancements in processing technologies for higher purity and performance of petroleum coke-sourced soft carbon.
- 2023: Strategic partnerships formed between raw material suppliers and battery manufacturers to ensure supply chain stability.
- 2024: Emerging focus on sustainable production methods and recycling of soft carbon materials.
Future Outlook for Soft Carbon Material Market
The future outlook for the Soft Carbon Material market is exceptionally bright, driven by sustained growth in electric mobility and the continuous demand for high-performance energy storage solutions. Strategic opportunities lie in developing advanced, ultra-high-purity soft carbon materials to enable even higher energy densities and faster charging capabilities for future generations of EVs and portable electronics. Investments in sustainable production processes and circular economy initiatives will be crucial for long-term market leadership. The market potential is vast, with an estimated market size projected to exceed five billion dollars by 2030, underscoring its critical role in the global energy transition.
Soft Carbon Material Segmentation
-
1. Application
- 1.1. EV/HEV
- 1.2. Electric Tool
- 1.3. Digital Battery
- 1.4. Others
-
2. Types
- 2.1. Petroleum Coke Source
- 2.2. Others
Soft Carbon Material Segmentation By Geography
-
1. North America
- 1.1. United States
- 1.2. Canada
- 1.3. Mexico
-
2. South America
- 2.1. Brazil
- 2.2. Argentina
- 2.3. Rest of South America
-
3. Europe
- 3.1. United Kingdom
- 3.2. Germany
- 3.3. France
- 3.4. Italy
- 3.5. Spain
- 3.6. Russia
- 3.7. Benelux
- 3.8. Nordics
- 3.9. Rest of Europe
-
4. Middle East & Africa
- 4.1. Turkey
- 4.2. Israel
- 4.3. GCC
- 4.4. North Africa
- 4.5. South Africa
- 4.6. Rest of Middle East & Africa
-
5. Asia Pacific
- 5.1. China
- 5.2. India
- 5.3. Japan
- 5.4. South Korea
- 5.5. ASEAN
- 5.6. Oceania
- 5.7. Rest of Asia Pacific
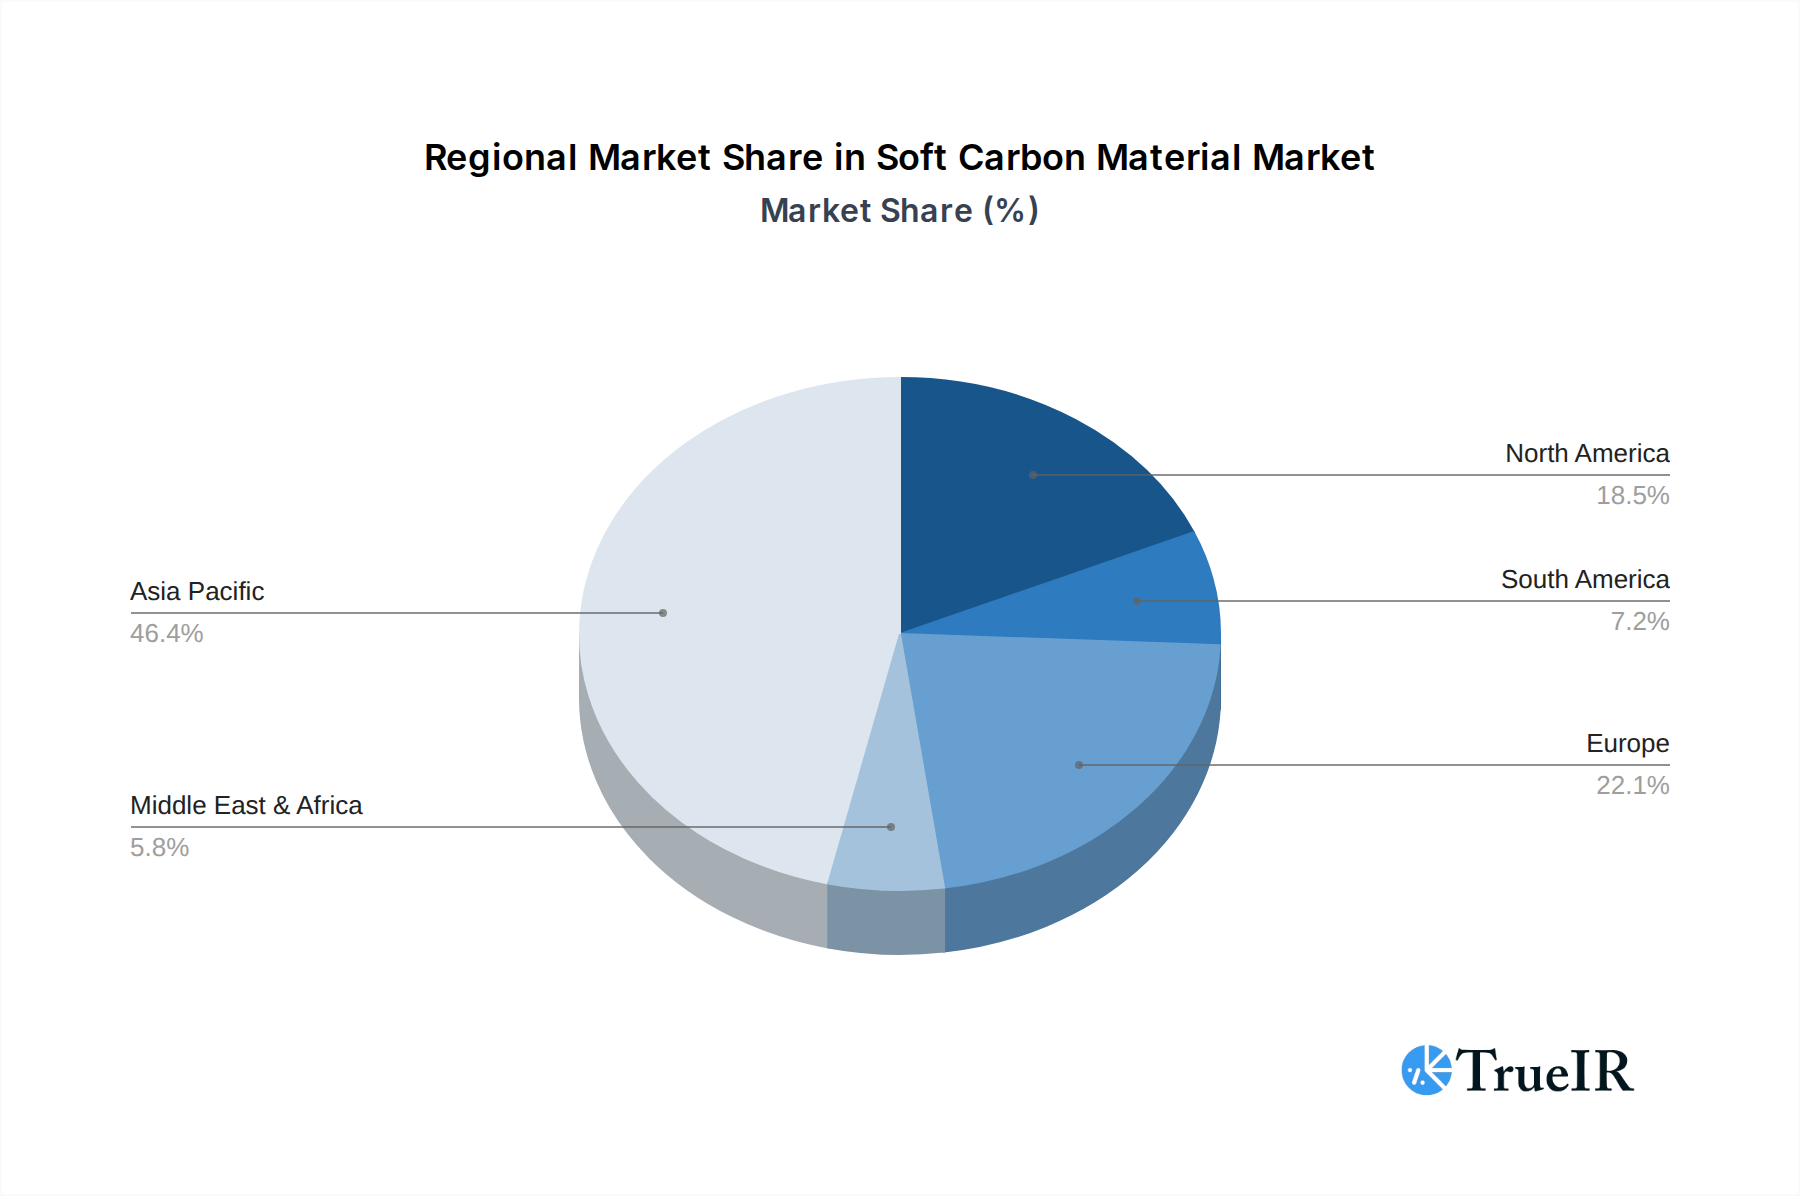
Soft Carbon Material Regional Market Share
Geographic Coverage of Soft Carbon Material
Soft Carbon Material REPORT HIGHLIGHTS
| Aspects | Details |
|---|---|
| Study Period | 2020-2034 |
| Base Year | 2025 |
| Estimated Year | 2026 |
| Forecast Period | 2026-2034 |
| Historical Period | 2020-2025 |
| Growth Rate | CAGR of 10.59% from 2020-2034 |
| Segmentation |
|
Table of Contents
- 1. Introduction
- 1.1. Research Scope
- 1.2. Market Segmentation
- 1.3. Research Methodology
- 1.4. Definitions and Assumptions
- 2. Executive Summary
- 2.1. Introduction
- 3. Market Dynamics
- 3.1. Introduction
- 3.2. Market Drivers
- 3.3. Market Restrains
- 3.4. Market Trends
- 4. Market Factor Analysis
- 4.1. Porters Five Forces
- 4.2. Supply/Value Chain
- 4.3. PESTEL analysis
- 4.4. Market Entropy
- 4.5. Patent/Trademark Analysis
- 5. Global Soft Carbon Material Analysis, Insights and Forecast, 2020-2032
- 5.1. Market Analysis, Insights and Forecast - by Application
- 5.1.1. EV/HEV
- 5.1.2. Electric Tool
- 5.1.3. Digital Battery
- 5.1.4. Others
- 5.2. Market Analysis, Insights and Forecast - by Types
- 5.2.1. Petroleum Coke Source
- 5.2.2. Others
- 5.3. Market Analysis, Insights and Forecast - by Region
- 5.3.1. North America
- 5.3.2. South America
- 5.3.3. Europe
- 5.3.4. Middle East & Africa
- 5.3.5. Asia Pacific
- 5.1. Market Analysis, Insights and Forecast - by Application
- 6. North America Soft Carbon Material Analysis, Insights and Forecast, 2020-2032
- 6.1. Market Analysis, Insights and Forecast - by Application
- 6.1.1. EV/HEV
- 6.1.2. Electric Tool
- 6.1.3. Digital Battery
- 6.1.4. Others
- 6.2. Market Analysis, Insights and Forecast - by Types
- 6.2.1. Petroleum Coke Source
- 6.2.2. Others
- 6.1. Market Analysis, Insights and Forecast - by Application
- 7. South America Soft Carbon Material Analysis, Insights and Forecast, 2020-2032
- 7.1. Market Analysis, Insights and Forecast - by Application
- 7.1.1. EV/HEV
- 7.1.2. Electric Tool
- 7.1.3. Digital Battery
- 7.1.4. Others
- 7.2. Market Analysis, Insights and Forecast - by Types
- 7.2.1. Petroleum Coke Source
- 7.2.2. Others
- 7.1. Market Analysis, Insights and Forecast - by Application
- 8. Europe Soft Carbon Material Analysis, Insights and Forecast, 2020-2032
- 8.1. Market Analysis, Insights and Forecast - by Application
- 8.1.1. EV/HEV
- 8.1.2. Electric Tool
- 8.1.3. Digital Battery
- 8.1.4. Others
- 8.2. Market Analysis, Insights and Forecast - by Types
- 8.2.1. Petroleum Coke Source
- 8.2.2. Others
- 8.1. Market Analysis, Insights and Forecast - by Application
- 9. Middle East & Africa Soft Carbon Material Analysis, Insights and Forecast, 2020-2032
- 9.1. Market Analysis, Insights and Forecast - by Application
- 9.1.1. EV/HEV
- 9.1.2. Electric Tool
- 9.1.3. Digital Battery
- 9.1.4. Others
- 9.2. Market Analysis, Insights and Forecast - by Types
- 9.2.1. Petroleum Coke Source
- 9.2.2. Others
- 9.1. Market Analysis, Insights and Forecast - by Application
- 10. Asia Pacific Soft Carbon Material Analysis, Insights and Forecast, 2020-2032
- 10.1. Market Analysis, Insights and Forecast - by Application
- 10.1.1. EV/HEV
- 10.1.2. Electric Tool
- 10.1.3. Digital Battery
- 10.1.4. Others
- 10.2. Market Analysis, Insights and Forecast - by Types
- 10.2.1. Petroleum Coke Source
- 10.2.2. Others
- 10.1. Market Analysis, Insights and Forecast - by Application
- 11. Competitive Analysis
- 11.1. Global Market Share Analysis 2025
- 11.2. Company Profiles
- 11.2.1 Power Carbon Technology
- 11.2.1.1. Overview
- 11.2.1.2. Products
- 11.2.1.3. SWOT Analysis
- 11.2.1.4. Recent Developments
- 11.2.1.5. Financials (Based on Availability)
- 11.2.2 Shanshan Technology
- 11.2.2.1. Overview
- 11.2.2.2. Products
- 11.2.2.3. SWOT Analysis
- 11.2.2.4. Recent Developments
- 11.2.2.5. Financials (Based on Availability)
- 11.2.3 BTR New Material
- 11.2.3.1. Overview
- 11.2.3.2. Products
- 11.2.3.3. SWOT Analysis
- 11.2.3.4. Recent Developments
- 11.2.3.5. Financials (Based on Availability)
- 11.2.1 Power Carbon Technology
List of Figures
- Figure 1: Global Soft Carbon Material Revenue Breakdown (undefined, %) by Region 2025 & 2033
- Figure 2: Global Soft Carbon Material Volume Breakdown (K, %) by Region 2025 & 2033
- Figure 3: North America Soft Carbon Material Revenue (undefined), by Application 2025 & 2033
- Figure 4: North America Soft Carbon Material Volume (K), by Application 2025 & 2033
- Figure 5: North America Soft Carbon Material Revenue Share (%), by Application 2025 & 2033
- Figure 6: North America Soft Carbon Material Volume Share (%), by Application 2025 & 2033
- Figure 7: North America Soft Carbon Material Revenue (undefined), by Types 2025 & 2033
- Figure 8: North America Soft Carbon Material Volume (K), by Types 2025 & 2033
- Figure 9: North America Soft Carbon Material Revenue Share (%), by Types 2025 & 2033
- Figure 10: North America Soft Carbon Material Volume Share (%), by Types 2025 & 2033
- Figure 11: North America Soft Carbon Material Revenue (undefined), by Country 2025 & 2033
- Figure 12: North America Soft Carbon Material Volume (K), by Country 2025 & 2033
- Figure 13: North America Soft Carbon Material Revenue Share (%), by Country 2025 & 2033
- Figure 14: North America Soft Carbon Material Volume Share (%), by Country 2025 & 2033
- Figure 15: South America Soft Carbon Material Revenue (undefined), by Application 2025 & 2033
- Figure 16: South America Soft Carbon Material Volume (K), by Application 2025 & 2033
- Figure 17: South America Soft Carbon Material Revenue Share (%), by Application 2025 & 2033
- Figure 18: South America Soft Carbon Material Volume Share (%), by Application 2025 & 2033
- Figure 19: South America Soft Carbon Material Revenue (undefined), by Types 2025 & 2033
- Figure 20: South America Soft Carbon Material Volume (K), by Types 2025 & 2033
- Figure 21: South America Soft Carbon Material Revenue Share (%), by Types 2025 & 2033
- Figure 22: South America Soft Carbon Material Volume Share (%), by Types 2025 & 2033
- Figure 23: South America Soft Carbon Material Revenue (undefined), by Country 2025 & 2033
- Figure 24: South America Soft Carbon Material Volume (K), by Country 2025 & 2033
- Figure 25: South America Soft Carbon Material Revenue Share (%), by Country 2025 & 2033
- Figure 26: South America Soft Carbon Material Volume Share (%), by Country 2025 & 2033
- Figure 27: Europe Soft Carbon Material Revenue (undefined), by Application 2025 & 2033
- Figure 28: Europe Soft Carbon Material Volume (K), by Application 2025 & 2033
- Figure 29: Europe Soft Carbon Material Revenue Share (%), by Application 2025 & 2033
- Figure 30: Europe Soft Carbon Material Volume Share (%), by Application 2025 & 2033
- Figure 31: Europe Soft Carbon Material Revenue (undefined), by Types 2025 & 2033
- Figure 32: Europe Soft Carbon Material Volume (K), by Types 2025 & 2033
- Figure 33: Europe Soft Carbon Material Revenue Share (%), by Types 2025 & 2033
- Figure 34: Europe Soft Carbon Material Volume Share (%), by Types 2025 & 2033
- Figure 35: Europe Soft Carbon Material Revenue (undefined), by Country 2025 & 2033
- Figure 36: Europe Soft Carbon Material Volume (K), by Country 2025 & 2033
- Figure 37: Europe Soft Carbon Material Revenue Share (%), by Country 2025 & 2033
- Figure 38: Europe Soft Carbon Material Volume Share (%), by Country 2025 & 2033
- Figure 39: Middle East & Africa Soft Carbon Material Revenue (undefined), by Application 2025 & 2033
- Figure 40: Middle East & Africa Soft Carbon Material Volume (K), by Application 2025 & 2033
- Figure 41: Middle East & Africa Soft Carbon Material Revenue Share (%), by Application 2025 & 2033
- Figure 42: Middle East & Africa Soft Carbon Material Volume Share (%), by Application 2025 & 2033
- Figure 43: Middle East & Africa Soft Carbon Material Revenue (undefined), by Types 2025 & 2033
- Figure 44: Middle East & Africa Soft Carbon Material Volume (K), by Types 2025 & 2033
- Figure 45: Middle East & Africa Soft Carbon Material Revenue Share (%), by Types 2025 & 2033
- Figure 46: Middle East & Africa Soft Carbon Material Volume Share (%), by Types 2025 & 2033
- Figure 47: Middle East & Africa Soft Carbon Material Revenue (undefined), by Country 2025 & 2033
- Figure 48: Middle East & Africa Soft Carbon Material Volume (K), by Country 2025 & 2033
- Figure 49: Middle East & Africa Soft Carbon Material Revenue Share (%), by Country 2025 & 2033
- Figure 50: Middle East & Africa Soft Carbon Material Volume Share (%), by Country 2025 & 2033
- Figure 51: Asia Pacific Soft Carbon Material Revenue (undefined), by Application 2025 & 2033
- Figure 52: Asia Pacific Soft Carbon Material Volume (K), by Application 2025 & 2033
- Figure 53: Asia Pacific Soft Carbon Material Revenue Share (%), by Application 2025 & 2033
- Figure 54: Asia Pacific Soft Carbon Material Volume Share (%), by Application 2025 & 2033
- Figure 55: Asia Pacific Soft Carbon Material Revenue (undefined), by Types 2025 & 2033
- Figure 56: Asia Pacific Soft Carbon Material Volume (K), by Types 2025 & 2033
- Figure 57: Asia Pacific Soft Carbon Material Revenue Share (%), by Types 2025 & 2033
- Figure 58: Asia Pacific Soft Carbon Material Volume Share (%), by Types 2025 & 2033
- Figure 59: Asia Pacific Soft Carbon Material Revenue (undefined), by Country 2025 & 2033
- Figure 60: Asia Pacific Soft Carbon Material Volume (K), by Country 2025 & 2033
- Figure 61: Asia Pacific Soft Carbon Material Revenue Share (%), by Country 2025 & 2033
- Figure 62: Asia Pacific Soft Carbon Material Volume Share (%), by Country 2025 & 2033
List of Tables
- Table 1: Global Soft Carbon Material Revenue undefined Forecast, by Application 2020 & 2033
- Table 2: Global Soft Carbon Material Volume K Forecast, by Application 2020 & 2033
- Table 3: Global Soft Carbon Material Revenue undefined Forecast, by Types 2020 & 2033
- Table 4: Global Soft Carbon Material Volume K Forecast, by Types 2020 & 2033
- Table 5: Global Soft Carbon Material Revenue undefined Forecast, by Region 2020 & 2033
- Table 6: Global Soft Carbon Material Volume K Forecast, by Region 2020 & 2033
- Table 7: Global Soft Carbon Material Revenue undefined Forecast, by Application 2020 & 2033
- Table 8: Global Soft Carbon Material Volume K Forecast, by Application 2020 & 2033
- Table 9: Global Soft Carbon Material Revenue undefined Forecast, by Types 2020 & 2033
- Table 10: Global Soft Carbon Material Volume K Forecast, by Types 2020 & 2033
- Table 11: Global Soft Carbon Material Revenue undefined Forecast, by Country 2020 & 2033
- Table 12: Global Soft Carbon Material Volume K Forecast, by Country 2020 & 2033
- Table 13: United States Soft Carbon Material Revenue (undefined) Forecast, by Application 2020 & 2033
- Table 14: United States Soft Carbon Material Volume (K) Forecast, by Application 2020 & 2033
- Table 15: Canada Soft Carbon Material Revenue (undefined) Forecast, by Application 2020 & 2033
- Table 16: Canada Soft Carbon Material Volume (K) Forecast, by Application 2020 & 2033
- Table 17: Mexico Soft Carbon Material Revenue (undefined) Forecast, by Application 2020 & 2033
- Table 18: Mexico Soft Carbon Material Volume (K) Forecast, by Application 2020 & 2033
- Table 19: Global Soft Carbon Material Revenue undefined Forecast, by Application 2020 & 2033
- Table 20: Global Soft Carbon Material Volume K Forecast, by Application 2020 & 2033
- Table 21: Global Soft Carbon Material Revenue undefined Forecast, by Types 2020 & 2033
- Table 22: Global Soft Carbon Material Volume K Forecast, by Types 2020 & 2033
- Table 23: Global Soft Carbon Material Revenue undefined Forecast, by Country 2020 & 2033
- Table 24: Global Soft Carbon Material Volume K Forecast, by Country 2020 & 2033
- Table 25: Brazil Soft Carbon Material Revenue (undefined) Forecast, by Application 2020 & 2033
- Table 26: Brazil Soft Carbon Material Volume (K) Forecast, by Application 2020 & 2033
- Table 27: Argentina Soft Carbon Material Revenue (undefined) Forecast, by Application 2020 & 2033
- Table 28: Argentina Soft Carbon Material Volume (K) Forecast, by Application 2020 & 2033
- Table 29: Rest of South America Soft Carbon Material Revenue (undefined) Forecast, by Application 2020 & 2033
- Table 30: Rest of South America Soft Carbon Material Volume (K) Forecast, by Application 2020 & 2033
- Table 31: Global Soft Carbon Material Revenue undefined Forecast, by Application 2020 & 2033
- Table 32: Global Soft Carbon Material Volume K Forecast, by Application 2020 & 2033
- Table 33: Global Soft Carbon Material Revenue undefined Forecast, by Types 2020 & 2033
- Table 34: Global Soft Carbon Material Volume K Forecast, by Types 2020 & 2033
- Table 35: Global Soft Carbon Material Revenue undefined Forecast, by Country 2020 & 2033
- Table 36: Global Soft Carbon Material Volume K Forecast, by Country 2020 & 2033
- Table 37: United Kingdom Soft Carbon Material Revenue (undefined) Forecast, by Application 2020 & 2033
- Table 38: United Kingdom Soft Carbon Material Volume (K) Forecast, by Application 2020 & 2033
- Table 39: Germany Soft Carbon Material Revenue (undefined) Forecast, by Application 2020 & 2033
- Table 40: Germany Soft Carbon Material Volume (K) Forecast, by Application 2020 & 2033
- Table 41: France Soft Carbon Material Revenue (undefined) Forecast, by Application 2020 & 2033
- Table 42: France Soft Carbon Material Volume (K) Forecast, by Application 2020 & 2033
- Table 43: Italy Soft Carbon Material Revenue (undefined) Forecast, by Application 2020 & 2033
- Table 44: Italy Soft Carbon Material Volume (K) Forecast, by Application 2020 & 2033
- Table 45: Spain Soft Carbon Material Revenue (undefined) Forecast, by Application 2020 & 2033
- Table 46: Spain Soft Carbon Material Volume (K) Forecast, by Application 2020 & 2033
- Table 47: Russia Soft Carbon Material Revenue (undefined) Forecast, by Application 2020 & 2033
- Table 48: Russia Soft Carbon Material Volume (K) Forecast, by Application 2020 & 2033
- Table 49: Benelux Soft Carbon Material Revenue (undefined) Forecast, by Application 2020 & 2033
- Table 50: Benelux Soft Carbon Material Volume (K) Forecast, by Application 2020 & 2033
- Table 51: Nordics Soft Carbon Material Revenue (undefined) Forecast, by Application 2020 & 2033
- Table 52: Nordics Soft Carbon Material Volume (K) Forecast, by Application 2020 & 2033
- Table 53: Rest of Europe Soft Carbon Material Revenue (undefined) Forecast, by Application 2020 & 2033
- Table 54: Rest of Europe Soft Carbon Material Volume (K) Forecast, by Application 2020 & 2033
- Table 55: Global Soft Carbon Material Revenue undefined Forecast, by Application 2020 & 2033
- Table 56: Global Soft Carbon Material Volume K Forecast, by Application 2020 & 2033
- Table 57: Global Soft Carbon Material Revenue undefined Forecast, by Types 2020 & 2033
- Table 58: Global Soft Carbon Material Volume K Forecast, by Types 2020 & 2033
- Table 59: Global Soft Carbon Material Revenue undefined Forecast, by Country 2020 & 2033
- Table 60: Global Soft Carbon Material Volume K Forecast, by Country 2020 & 2033
- Table 61: Turkey Soft Carbon Material Revenue (undefined) Forecast, by Application 2020 & 2033
- Table 62: Turkey Soft Carbon Material Volume (K) Forecast, by Application 2020 & 2033
- Table 63: Israel Soft Carbon Material Revenue (undefined) Forecast, by Application 2020 & 2033
- Table 64: Israel Soft Carbon Material Volume (K) Forecast, by Application 2020 & 2033
- Table 65: GCC Soft Carbon Material Revenue (undefined) Forecast, by Application 2020 & 2033
- Table 66: GCC Soft Carbon Material Volume (K) Forecast, by Application 2020 & 2033
- Table 67: North Africa Soft Carbon Material Revenue (undefined) Forecast, by Application 2020 & 2033
- Table 68: North Africa Soft Carbon Material Volume (K) Forecast, by Application 2020 & 2033
- Table 69: South Africa Soft Carbon Material Revenue (undefined) Forecast, by Application 2020 & 2033
- Table 70: South Africa Soft Carbon Material Volume (K) Forecast, by Application 2020 & 2033
- Table 71: Rest of Middle East & Africa Soft Carbon Material Revenue (undefined) Forecast, by Application 2020 & 2033
- Table 72: Rest of Middle East & Africa Soft Carbon Material Volume (K) Forecast, by Application 2020 & 2033
- Table 73: Global Soft Carbon Material Revenue undefined Forecast, by Application 2020 & 2033
- Table 74: Global Soft Carbon Material Volume K Forecast, by Application 2020 & 2033
- Table 75: Global Soft Carbon Material Revenue undefined Forecast, by Types 2020 & 2033
- Table 76: Global Soft Carbon Material Volume K Forecast, by Types 2020 & 2033
- Table 77: Global Soft Carbon Material Revenue undefined Forecast, by Country 2020 & 2033
- Table 78: Global Soft Carbon Material Volume K Forecast, by Country 2020 & 2033
- Table 79: China Soft Carbon Material Revenue (undefined) Forecast, by Application 2020 & 2033
- Table 80: China Soft Carbon Material Volume (K) Forecast, by Application 2020 & 2033
- Table 81: India Soft Carbon Material Revenue (undefined) Forecast, by Application 2020 & 2033
- Table 82: India Soft Carbon Material Volume (K) Forecast, by Application 2020 & 2033
- Table 83: Japan Soft Carbon Material Revenue (undefined) Forecast, by Application 2020 & 2033
- Table 84: Japan Soft Carbon Material Volume (K) Forecast, by Application 2020 & 2033
- Table 85: South Korea Soft Carbon Material Revenue (undefined) Forecast, by Application 2020 & 2033
- Table 86: South Korea Soft Carbon Material Volume (K) Forecast, by Application 2020 & 2033
- Table 87: ASEAN Soft Carbon Material Revenue (undefined) Forecast, by Application 2020 & 2033
- Table 88: ASEAN Soft Carbon Material Volume (K) Forecast, by Application 2020 & 2033
- Table 89: Oceania Soft Carbon Material Revenue (undefined) Forecast, by Application 2020 & 2033
- Table 90: Oceania Soft Carbon Material Volume (K) Forecast, by Application 2020 & 2033
- Table 91: Rest of Asia Pacific Soft Carbon Material Revenue (undefined) Forecast, by Application 2020 & 2033
- Table 92: Rest of Asia Pacific Soft Carbon Material Volume (K) Forecast, by Application 2020 & 2033
Frequently Asked Questions
1. What is the projected Compound Annual Growth Rate (CAGR) of the Soft Carbon Material?
The projected CAGR is approximately 10.59%.
2. Which companies are prominent players in the Soft Carbon Material?
Key companies in the market include Power Carbon Technology, Shanshan Technology, BTR New Material.
3. What are the main segments of the Soft Carbon Material?
The market segments include Application, Types.
4. Can you provide details about the market size?
The market size is estimated to be USD XXX N/A as of 2022.
5. What are some drivers contributing to market growth?
N/A
6. What are the notable trends driving market growth?
N/A
7. Are there any restraints impacting market growth?
N/A
8. Can you provide examples of recent developments in the market?
N/A
9. What pricing options are available for accessing the report?
Pricing options include single-user, multi-user, and enterprise licenses priced at USD 3950.00, USD 5925.00, and USD 7900.00 respectively.
10. Is the market size provided in terms of value or volume?
The market size is provided in terms of value, measured in N/A and volume, measured in K.
11. Are there any specific market keywords associated with the report?
Yes, the market keyword associated with the report is "Soft Carbon Material," which aids in identifying and referencing the specific market segment covered.
12. How do I determine which pricing option suits my needs best?
The pricing options vary based on user requirements and access needs. Individual users may opt for single-user licenses, while businesses requiring broader access may choose multi-user or enterprise licenses for cost-effective access to the report.
13. Are there any additional resources or data provided in the Soft Carbon Material report?
While the report offers comprehensive insights, it's advisable to review the specific contents or supplementary materials provided to ascertain if additional resources or data are available.
14. How can I stay updated on further developments or reports in the Soft Carbon Material?
To stay informed about further developments, trends, and reports in the Soft Carbon Material, consider subscribing to industry newsletters, following relevant companies and organizations, or regularly checking reputable industry news sources and publications.
Methodology
Step 1 - Identification of Relevant Samples Size from Population Database


Step 2 - Approaches for Defining Global Market Size (Value, Volume* & Price*)

Note*: In applicable scenarios
Step 3 - Data Sources
Primary Research
- Web Analytics
- Survey Reports
- Research Institute
- Latest Research Reports
- Opinion Leaders
Secondary Research
- Annual Reports
- White Paper
- Latest Press Release
- Industry Association
- Paid Database
- Investor Presentations

Step 4 - Data Triangulation
Involves using different sources of information in order to increase the validity of a study
These sources are likely to be stakeholders in a program - participants, other researchers, program staff, other community members, and so on.
Then we put all data in single framework & apply various statistical tools to find out the dynamic on the market.
During the analysis stage, feedback from the stakeholder groups would be compared to determine areas of agreement as well as areas of divergence