

Key Insights
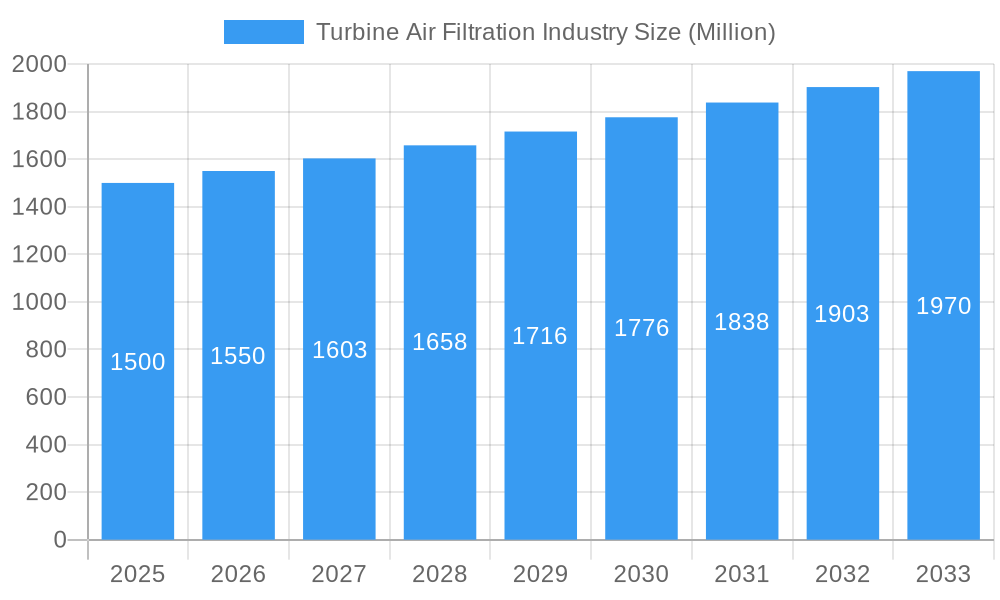
The global turbine air filtration market, valued at approximately $2.09 billion in 2025, is projected to expand at a compound annual growth rate (CAGR) of 3.73% from 2025 to 2033. This growth is underpinned by several key factors. The escalating demand for cleaner energy sources is accelerating the adoption of turbine air filtration systems within power generation, particularly in renewable sectors such as wind and solar. Concurrently, stringent emission regulations in the oil and gas industry are necessitating advanced filtration technologies to safeguard sensitive equipment and mitigate environmental impact. Furthermore, continuous advancements in filtration materials and technologies, leading to enhanced efficiency and extended filter lifespans, are contributing to market expansion. The market is segmented by application (power generation, oil & gas, others) and by face velocity (low, medium, high). Power generation and high-velocity filtration systems currently lead the market, although the "others" segment, encompassing diverse industrial applications, is anticipated to exhibit significant growth potential. Geographically, North America and Europe hold substantial market share due to established infrastructure and rigorous environmental regulations. However, the Asia-Pacific region is poised for considerable growth driven by rapid industrialization and increasing energy demands. Market constraints include the substantial initial investment required for advanced filtration systems and potentially higher maintenance needs compared to simpler solutions.
Turbine Air Filtration Industry Market Size (In Billion)
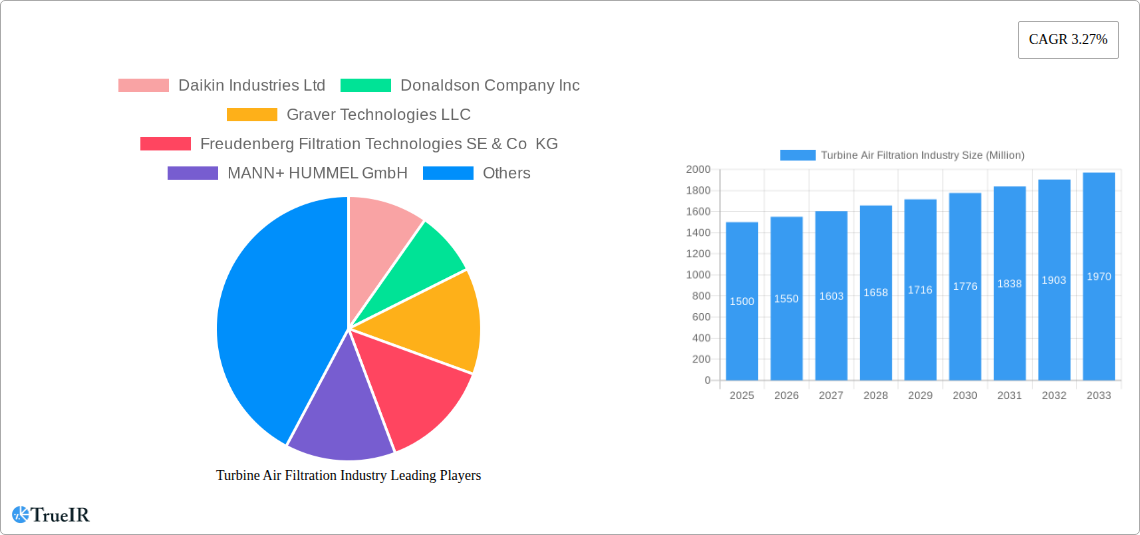
Notwithstanding these challenges, the long-term outlook for the turbine air filtration market remains robust. Ongoing technological innovations focused on minimizing pressure drop, extending filter longevity, and improving overall efficiency will drive adoption. Moreover, heightened awareness of the environmental and economic advantages associated with improved air quality and reduced equipment downtime will further fuel market expansion. Key industry players, including Daikin Industries Ltd and Donaldson Company Inc, are actively developing innovative filtration solutions and expanding their global footprint. Strategic collaborations and mergers & acquisitions within the sector are expected to redefine the competitive landscape, fostering further innovation and industry consolidation. The market is anticipated to benefit from increasingly stringent government regulations targeting industrial emissions, creating a favorable environment for growth in the coming years.
Turbine Air Filtration Industry Company Market Share
Turbine Air Filtration Industry Market Report: 2019-2033
This comprehensive report provides a detailed analysis of the Turbine Air Filtration Industry, offering invaluable insights for stakeholders seeking to navigate this dynamic market. The report covers the period 2019-2033, with 2025 as the base and estimated year. The market size is projected to reach xx Million by 2033, exhibiting a robust CAGR of xx% during the forecast period (2025-2033). This in-depth study analyzes key market segments, competitive dynamics, and future growth prospects, offering crucial data for informed decision-making.
Turbine Air Filtration Industry Market Structure & Competitive Landscape
The Turbine Air Filtration industry exhibits a moderately concentrated market structure, with several major players holding significant market share. The Herfindahl-Hirschman Index (HHI) is estimated at xx, indicating a moderately consolidated market. Key players like Daikin Industries Ltd, Donaldson Company Inc, and MANN+ HUMMEL GmbH, collectively control approximately xx% of the global market. The industry is characterized by continuous innovation driven by the need for enhanced filtration efficiency, reduced energy consumption, and stricter environmental regulations. Mergers and acquisitions (M&A) activity remains moderate, with approximately xx Million in M&A volume recorded during the historical period (2019-2024).
- Market Concentration: Moderately concentrated, with a HHI of xx.
- Innovation Drivers: Stringent emission norms, advancements in filtration technologies (e.g., nanomaterials, smart sensors), and demand for improved energy efficiency.
- Regulatory Impacts: Stringent environmental regulations in various regions are driving demand for advanced filtration solutions.
- Product Substitutes: Limited substitutes exist, but technological advancements are constantly introducing improved alternatives.
- End-User Segmentation: Power generation, oil & gas, and other industrial sectors are the primary end-users.
- M&A Trends: Moderate M&A activity observed, with an estimated xx Million in deal volume during 2019-2024.
Turbine Air Filtration Industry Market Trends & Opportunities
The global turbine air filtration market is experiencing significant growth, driven by factors such as increasing demand for power generation, expansion of the oil and gas industry, and stringent environmental regulations. Technological advancements, such as the development of high-efficiency filters and smart filtration systems, are further fueling market expansion. Consumer preference is shifting toward sustainable and energy-efficient solutions, prompting manufacturers to invest in R&D to meet these demands. The competitive landscape is characterized by intense rivalry among established players and emerging entrants. Market penetration rates vary across different regions and segments, with mature markets exhibiting higher saturation levels. The market is expected to witness continued growth throughout the forecast period, driven by sustained demand for energy and increasing environmental concerns. The market size is expected to reach xx Million by 2033, showcasing significant growth potential.
Dominant Markets & Segments in Turbine Air Filtration Industry
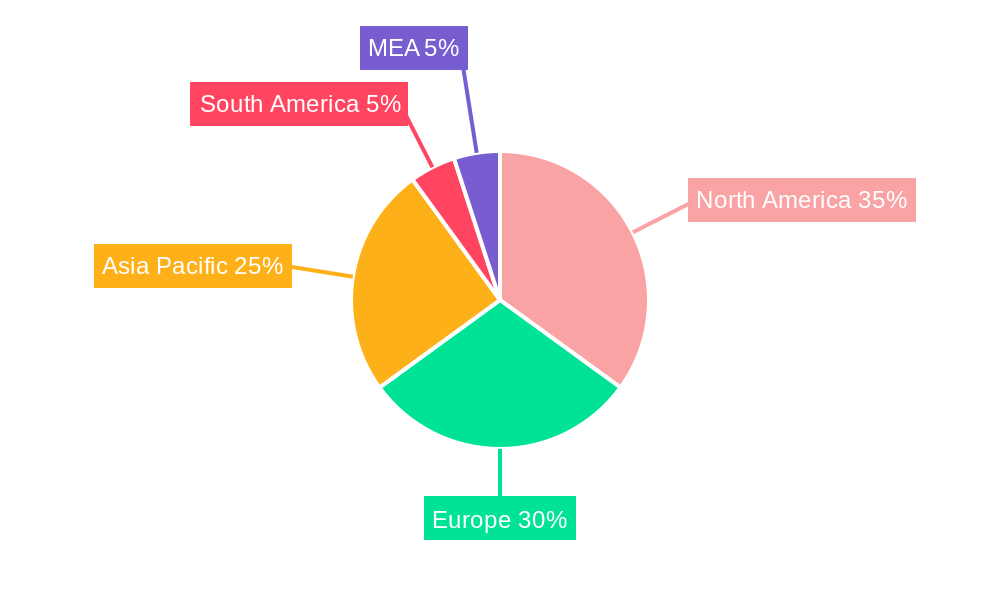
The power generation segment holds the largest market share, accounting for approximately xx% of the total revenue in 2025, followed by the oil and gas segment at approximately xx%. Geographically, North America and Europe are currently the dominant markets, driven by robust infrastructure development and stringent emission regulations. Medium velocity filters represent the largest segment within the face velocity category, driven by widespread adoption across various applications.
- Key Growth Drivers:
- Power Generation: Increasing electricity demand and the need for efficient power generation.
- Oil & Gas: Growing exploration and production activities and focus on environmental compliance.
- Other Industries: Expansion in sectors like manufacturing and chemicals.
- Medium Velocity Filters: Wide applicability across various turbine types and applications.
- Market Dominance Analysis: North America and Europe remain dominant due to established infrastructure, high industrial activity, and stringent environmental regulations.
Turbine Air Filtration Industry Product Analysis
The turbine air filtration industry offers a wide range of products catering to diverse applications and needs, from low-velocity to high-velocity systems. Recent technological advancements have focused on improving filtration efficiency, reducing pressure drops, and extending filter life. Products are designed to meet specific industry standards and regulations, ensuring optimal performance and environmental compliance. The competitive advantage lies in providing innovative solutions that address customer-specific needs, ensuring superior performance and longevity.
Key Drivers, Barriers & Challenges in Turbine Air Filtration Industry
Key Drivers: Stringent environmental regulations worldwide, increasing demand for cleaner energy, growth in industrial sectors (power generation, oil & gas), and technological advancements in filtration technologies are driving market growth. Government incentives for clean energy adoption also contribute significantly.
Challenges: High initial investment costs associated with advanced filtration systems, supply chain disruptions impacting raw material availability, and intense competition among established players are major challenges. Complex regulatory landscapes and variations in standards across regions also pose significant barriers.
Growth Drivers in the Turbine Air Filtration Industry Market
Technological advancements, stringent environmental regulations, rising energy demands, and increasing industrial activities are key growth drivers. The development of high-efficiency filters, coupled with government initiatives to reduce carbon emissions, significantly fuels market expansion.
Challenges Impacting Turbine Air Filtration Industry Growth
Supply chain vulnerabilities, fluctuating raw material prices, and intense competition among major industry players pose substantial challenges. Strict environmental regulations and the high initial investment cost for advanced filtration systems also impact growth.
Key Players Shaping the Turbine Air Filtration Industry Market
- Daikin Industries Ltd
- Donaldson Company Inc
- Graver Technologies LLC
- Freudenberg Filtration Technologies SE & Co KG
- MANN+ HUMMEL GmbH
- Koch Filter Corporation
- Camfil AB
- Advanced Filtration Concepts
- W L Gore & Associates Inc
- Parker Hannifin Corporation
- Nordic Air Filtration A/S
Significant Turbine Air Filtration Industry Industry Milestones
- June 2021: Camfil Group announced the expansion of its technical research center in Trosa, Sweden.
- May 2021: Parker Hannifin launched ASSURE, a new line of filters for high-performance gas turbines.
- March 2021: Transcontinental Gas Pipeline Company filed an application with FERC for the REAE project.
Future Outlook for Turbine Air Filtration Industry Market
The turbine air filtration market is poised for continued growth, driven by technological advancements, stricter emission norms, and expanding industrial activities. Strategic partnerships, product innovation, and expansion into emerging markets will be key to success. The market holds substantial potential for companies offering sustainable and efficient filtration solutions.
Turbine Air Filtration Industry Segmentation
-
1. Application
- 1.1. Power Generation
- 1.2. Oil and Gas
- 1.3. Others
-
2. Face Velocity
- 2.1. Low Velocity
- 2.2. Medium Velocity
- 2.3. High Velocity
Turbine Air Filtration Industry Segmentation By Geography
- 1. North America
- 2. Europe
- 3. Asia Pacific
- 4. South America
- 5. Middle East and Africa
Turbine Air Filtration Industry Regional Market Share
Geographic Coverage of Turbine Air Filtration Industry
Turbine Air Filtration Industry REPORT HIGHLIGHTS
| Aspects | Details |
|---|---|
| Study Period | 2020-2034 |
| Base Year | 2025 |
| Estimated Year | 2026 |
| Forecast Period | 2026-2034 |
| Historical Period | 2020-2025 |
| Growth Rate | CAGR of 3.73% from 2020-2034 |
| Segmentation |
|
Table of Contents
- 1. Introduction
- 1.1. Research Scope
- 1.2. Market Segmentation
- 1.3. Research Objective
- 1.4. Definitions and Assumptions
- 2. Executive Summary
- 2.1. Market Snapshot
- 3. Market Dynamics
- 3.1. Market Drivers
- 3.2. Market Restrains
- 3.3. Market Trends
- 3.4. Market Opportunities
- 4. Market Factor Analysis
- 4.1. Porters Five Forces
- 4.1.1. Bargaining Power of Suppliers
- 4.1.2. Bargaining Power of Buyers
- 4.1.3. Threat of New Entrants
- 4.1.4. Threat of Substitutes
- 4.1.5. Competitive Rivalry
- 4.2. PESTEL analysis
- 4.3. BCG Analysis
- 4.3.1. Stars (High Growth, High Market Share)
- 4.3.2. Cash Cows (Low Growth, High Market Share)
- 4.3.3. Question Mark (High Growth, Low Market Share)
- 4.3.4. Dogs (Low Growth, Low Market Share)
- 4.4. Ansoff Matrix Analysis
- 4.5. Supply Chain Analysis
- 4.6. Regulatory Landscape
- 4.7. Current Market Potential and Opportunity Assessment (TAM–SAM–SOM Framework)
- 4.8. TIR Analyst Note
- 4.1. Porters Five Forces
- 5. Market Analysis, Insights and Forecast 2021-2033
- 5.1. Market Analysis, Insights and Forecast - by Application
- 5.1.1. Power Generation
- 5.1.2. Oil and Gas
- 5.1.3. Others
- 5.2. Market Analysis, Insights and Forecast - by Face Velocity
- 5.2.1. Low Velocity
- 5.2.2. Medium Velocity
- 5.2.3. High Velocity
- 5.3. Market Analysis, Insights and Forecast - by Region
- 5.3.1. North America
- 5.3.2. Europe
- 5.3.3. Asia Pacific
- 5.3.4. South America
- 5.3.5. Middle East and Africa
- 5.1. Market Analysis, Insights and Forecast - by Application
- 6. Global Turbine Air Filtration Industry Analysis, Insights and Forecast, 2021-2033
- 6.1. Market Analysis, Insights and Forecast - by Application
- 6.1.1. Power Generation
- 6.1.2. Oil and Gas
- 6.1.3. Others
- 6.2. Market Analysis, Insights and Forecast - by Face Velocity
- 6.2.1. Low Velocity
- 6.2.2. Medium Velocity
- 6.2.3. High Velocity
- 6.1. Market Analysis, Insights and Forecast - by Application
- 7. North America Turbine Air Filtration Industry Analysis, Insights and Forecast, 2020-2032
- 7.1. Market Analysis, Insights and Forecast - by Application
- 7.1.1. Power Generation
- 7.1.2. Oil and Gas
- 7.1.3. Others
- 7.2. Market Analysis, Insights and Forecast - by Face Velocity
- 7.2.1. Low Velocity
- 7.2.2. Medium Velocity
- 7.2.3. High Velocity
- 7.1. Market Analysis, Insights and Forecast - by Application
- 8. Europe Turbine Air Filtration Industry Analysis, Insights and Forecast, 2020-2032
- 8.1. Market Analysis, Insights and Forecast - by Application
- 8.1.1. Power Generation
- 8.1.2. Oil and Gas
- 8.1.3. Others
- 8.2. Market Analysis, Insights and Forecast - by Face Velocity
- 8.2.1. Low Velocity
- 8.2.2. Medium Velocity
- 8.2.3. High Velocity
- 8.1. Market Analysis, Insights and Forecast - by Application
- 9. Asia Pacific Turbine Air Filtration Industry Analysis, Insights and Forecast, 2020-2032
- 9.1. Market Analysis, Insights and Forecast - by Application
- 9.1.1. Power Generation
- 9.1.2. Oil and Gas
- 9.1.3. Others
- 9.2. Market Analysis, Insights and Forecast - by Face Velocity
- 9.2.1. Low Velocity
- 9.2.2. Medium Velocity
- 9.2.3. High Velocity
- 9.1. Market Analysis, Insights and Forecast - by Application
- 10. South America Turbine Air Filtration Industry Analysis, Insights and Forecast, 2020-2032
- 10.1. Market Analysis, Insights and Forecast - by Application
- 10.1.1. Power Generation
- 10.1.2. Oil and Gas
- 10.1.3. Others
- 10.2. Market Analysis, Insights and Forecast - by Face Velocity
- 10.2.1. Low Velocity
- 10.2.2. Medium Velocity
- 10.2.3. High Velocity
- 10.1. Market Analysis, Insights and Forecast - by Application
- 11. Middle East and Africa Turbine Air Filtration Industry Analysis, Insights and Forecast, 2020-2032
- 11.1. Market Analysis, Insights and Forecast - by Application
- 11.1.1. Power Generation
- 11.1.2. Oil and Gas
- 11.1.3. Others
- 11.2. Market Analysis, Insights and Forecast - by Face Velocity
- 11.2.1. Low Velocity
- 11.2.2. Medium Velocity
- 11.2.3. High Velocity
- 11.1. Market Analysis, Insights and Forecast - by Application
- 12. Competitive Analysis
- 12.1. Company Profiles
- 12.1.1 Daikin Industries Ltd
- 12.1.1.1. Company Overview
- 12.1.1.2. Products
- 12.1.1.3. Company Financials
- 12.1.1.4. SWOT Analysis
- 12.1.2 Donaldson Company Inc
- 12.1.2.1. Company Overview
- 12.1.2.2. Products
- 12.1.2.3. Company Financials
- 12.1.2.4. SWOT Analysis
- 12.1.3 Graver Technologies LLC
- 12.1.3.1. Company Overview
- 12.1.3.2. Products
- 12.1.3.3. Company Financials
- 12.1.3.4. SWOT Analysis
- 12.1.4 Freudenberg Filtration Technologies SE & Co KG
- 12.1.4.1. Company Overview
- 12.1.4.2. Products
- 12.1.4.3. Company Financials
- 12.1.4.4. SWOT Analysis
- 12.1.5 MANN+ HUMMEL GmbH
- 12.1.5.1. Company Overview
- 12.1.5.2. Products
- 12.1.5.3. Company Financials
- 12.1.5.4. SWOT Analysis
- 12.1.6 Koch Filter Corporation
- 12.1.6.1. Company Overview
- 12.1.6.2. Products
- 12.1.6.3. Company Financials
- 12.1.6.4. SWOT Analysis
- 12.1.7 Camfil AB
- 12.1.7.1. Company Overview
- 12.1.7.2. Products
- 12.1.7.3. Company Financials
- 12.1.7.4. SWOT Analysis
- 12.1.8 Advanced Filtration Concepts
- 12.1.8.1. Company Overview
- 12.1.8.2. Products
- 12.1.8.3. Company Financials
- 12.1.8.4. SWOT Analysis
- 12.1.9 W L Gore & Associates Inc *List Not Exhaustive
- 12.1.9.1. Company Overview
- 12.1.9.2. Products
- 12.1.9.3. Company Financials
- 12.1.9.4. SWOT Analysis
- 12.1.10 Parker Hannifin Corporation
- 12.1.10.1. Company Overview
- 12.1.10.2. Products
- 12.1.10.3. Company Financials
- 12.1.10.4. SWOT Analysis
- 12.1.11 Nordic Air Filtration A/S
- 12.1.11.1. Company Overview
- 12.1.11.2. Products
- 12.1.11.3. Company Financials
- 12.1.11.4. SWOT Analysis
- 12.1.1 Daikin Industries Ltd
- 12.2. Market Entropy
- 12.2.1 Company's Key Areas Served
- 12.2.2 Recent Developments
- 12.3. Company Market Share Analysis 2025
- 12.3.1 Top 5 Companies Market Share Analysis
- 12.3.2 Top 3 Companies Market Share Analysis
- 12.4. List of Potential Customers
- 13. Research Methodology
List of Figures
- Figure 1: Global Turbine Air Filtration Industry Revenue Breakdown (billion, %) by Region 2025 & 2033
- Figure 2: Global Turbine Air Filtration Industry Volume Breakdown (K Unit, %) by Region 2025 & 2033
- Figure 3: North America Turbine Air Filtration Industry Revenue (billion), by Application 2025 & 2033
- Figure 4: North America Turbine Air Filtration Industry Volume (K Unit), by Application 2025 & 2033
- Figure 5: North America Turbine Air Filtration Industry Revenue Share (%), by Application 2025 & 2033
- Figure 6: North America Turbine Air Filtration Industry Volume Share (%), by Application 2025 & 2033
- Figure 7: North America Turbine Air Filtration Industry Revenue (billion), by Face Velocity 2025 & 2033
- Figure 8: North America Turbine Air Filtration Industry Volume (K Unit), by Face Velocity 2025 & 2033
- Figure 9: North America Turbine Air Filtration Industry Revenue Share (%), by Face Velocity 2025 & 2033
- Figure 10: North America Turbine Air Filtration Industry Volume Share (%), by Face Velocity 2025 & 2033
- Figure 11: North America Turbine Air Filtration Industry Revenue (billion), by Country 2025 & 2033
- Figure 12: North America Turbine Air Filtration Industry Volume (K Unit), by Country 2025 & 2033
- Figure 13: North America Turbine Air Filtration Industry Revenue Share (%), by Country 2025 & 2033
- Figure 14: North America Turbine Air Filtration Industry Volume Share (%), by Country 2025 & 2033
- Figure 15: Europe Turbine Air Filtration Industry Revenue (billion), by Application 2025 & 2033
- Figure 16: Europe Turbine Air Filtration Industry Volume (K Unit), by Application 2025 & 2033
- Figure 17: Europe Turbine Air Filtration Industry Revenue Share (%), by Application 2025 & 2033
- Figure 18: Europe Turbine Air Filtration Industry Volume Share (%), by Application 2025 & 2033
- Figure 19: Europe Turbine Air Filtration Industry Revenue (billion), by Face Velocity 2025 & 2033
- Figure 20: Europe Turbine Air Filtration Industry Volume (K Unit), by Face Velocity 2025 & 2033
- Figure 21: Europe Turbine Air Filtration Industry Revenue Share (%), by Face Velocity 2025 & 2033
- Figure 22: Europe Turbine Air Filtration Industry Volume Share (%), by Face Velocity 2025 & 2033
- Figure 23: Europe Turbine Air Filtration Industry Revenue (billion), by Country 2025 & 2033
- Figure 24: Europe Turbine Air Filtration Industry Volume (K Unit), by Country 2025 & 2033
- Figure 25: Europe Turbine Air Filtration Industry Revenue Share (%), by Country 2025 & 2033
- Figure 26: Europe Turbine Air Filtration Industry Volume Share (%), by Country 2025 & 2033
- Figure 27: Asia Pacific Turbine Air Filtration Industry Revenue (billion), by Application 2025 & 2033
- Figure 28: Asia Pacific Turbine Air Filtration Industry Volume (K Unit), by Application 2025 & 2033
- Figure 29: Asia Pacific Turbine Air Filtration Industry Revenue Share (%), by Application 2025 & 2033
- Figure 30: Asia Pacific Turbine Air Filtration Industry Volume Share (%), by Application 2025 & 2033
- Figure 31: Asia Pacific Turbine Air Filtration Industry Revenue (billion), by Face Velocity 2025 & 2033
- Figure 32: Asia Pacific Turbine Air Filtration Industry Volume (K Unit), by Face Velocity 2025 & 2033
- Figure 33: Asia Pacific Turbine Air Filtration Industry Revenue Share (%), by Face Velocity 2025 & 2033
- Figure 34: Asia Pacific Turbine Air Filtration Industry Volume Share (%), by Face Velocity 2025 & 2033
- Figure 35: Asia Pacific Turbine Air Filtration Industry Revenue (billion), by Country 2025 & 2033
- Figure 36: Asia Pacific Turbine Air Filtration Industry Volume (K Unit), by Country 2025 & 2033
- Figure 37: Asia Pacific Turbine Air Filtration Industry Revenue Share (%), by Country 2025 & 2033
- Figure 38: Asia Pacific Turbine Air Filtration Industry Volume Share (%), by Country 2025 & 2033
- Figure 39: South America Turbine Air Filtration Industry Revenue (billion), by Application 2025 & 2033
- Figure 40: South America Turbine Air Filtration Industry Volume (K Unit), by Application 2025 & 2033
- Figure 41: South America Turbine Air Filtration Industry Revenue Share (%), by Application 2025 & 2033
- Figure 42: South America Turbine Air Filtration Industry Volume Share (%), by Application 2025 & 2033
- Figure 43: South America Turbine Air Filtration Industry Revenue (billion), by Face Velocity 2025 & 2033
- Figure 44: South America Turbine Air Filtration Industry Volume (K Unit), by Face Velocity 2025 & 2033
- Figure 45: South America Turbine Air Filtration Industry Revenue Share (%), by Face Velocity 2025 & 2033
- Figure 46: South America Turbine Air Filtration Industry Volume Share (%), by Face Velocity 2025 & 2033
- Figure 47: South America Turbine Air Filtration Industry Revenue (billion), by Country 2025 & 2033
- Figure 48: South America Turbine Air Filtration Industry Volume (K Unit), by Country 2025 & 2033
- Figure 49: South America Turbine Air Filtration Industry Revenue Share (%), by Country 2025 & 2033
- Figure 50: South America Turbine Air Filtration Industry Volume Share (%), by Country 2025 & 2033
- Figure 51: Middle East and Africa Turbine Air Filtration Industry Revenue (billion), by Application 2025 & 2033
- Figure 52: Middle East and Africa Turbine Air Filtration Industry Volume (K Unit), by Application 2025 & 2033
- Figure 53: Middle East and Africa Turbine Air Filtration Industry Revenue Share (%), by Application 2025 & 2033
- Figure 54: Middle East and Africa Turbine Air Filtration Industry Volume Share (%), by Application 2025 & 2033
- Figure 55: Middle East and Africa Turbine Air Filtration Industry Revenue (billion), by Face Velocity 2025 & 2033
- Figure 56: Middle East and Africa Turbine Air Filtration Industry Volume (K Unit), by Face Velocity 2025 & 2033
- Figure 57: Middle East and Africa Turbine Air Filtration Industry Revenue Share (%), by Face Velocity 2025 & 2033
- Figure 58: Middle East and Africa Turbine Air Filtration Industry Volume Share (%), by Face Velocity 2025 & 2033
- Figure 59: Middle East and Africa Turbine Air Filtration Industry Revenue (billion), by Country 2025 & 2033
- Figure 60: Middle East and Africa Turbine Air Filtration Industry Volume (K Unit), by Country 2025 & 2033
- Figure 61: Middle East and Africa Turbine Air Filtration Industry Revenue Share (%), by Country 2025 & 2033
- Figure 62: Middle East and Africa Turbine Air Filtration Industry Volume Share (%), by Country 2025 & 2033
List of Tables
- Table 1: Global Turbine Air Filtration Industry Revenue billion Forecast, by Application 2020 & 2033
- Table 2: Global Turbine Air Filtration Industry Volume K Unit Forecast, by Application 2020 & 2033
- Table 3: Global Turbine Air Filtration Industry Revenue billion Forecast, by Face Velocity 2020 & 2033
- Table 4: Global Turbine Air Filtration Industry Volume K Unit Forecast, by Face Velocity 2020 & 2033
- Table 5: Global Turbine Air Filtration Industry Revenue billion Forecast, by Region 2020 & 2033
- Table 6: Global Turbine Air Filtration Industry Volume K Unit Forecast, by Region 2020 & 2033
- Table 7: Global Turbine Air Filtration Industry Revenue billion Forecast, by Application 2020 & 2033
- Table 8: Global Turbine Air Filtration Industry Volume K Unit Forecast, by Application 2020 & 2033
- Table 9: Global Turbine Air Filtration Industry Revenue billion Forecast, by Face Velocity 2020 & 2033
- Table 10: Global Turbine Air Filtration Industry Volume K Unit Forecast, by Face Velocity 2020 & 2033
- Table 11: Global Turbine Air Filtration Industry Revenue billion Forecast, by Country 2020 & 2033
- Table 12: Global Turbine Air Filtration Industry Volume K Unit Forecast, by Country 2020 & 2033
- Table 13: Global Turbine Air Filtration Industry Revenue billion Forecast, by Application 2020 & 2033
- Table 14: Global Turbine Air Filtration Industry Volume K Unit Forecast, by Application 2020 & 2033
- Table 15: Global Turbine Air Filtration Industry Revenue billion Forecast, by Face Velocity 2020 & 2033
- Table 16: Global Turbine Air Filtration Industry Volume K Unit Forecast, by Face Velocity 2020 & 2033
- Table 17: Global Turbine Air Filtration Industry Revenue billion Forecast, by Country 2020 & 2033
- Table 18: Global Turbine Air Filtration Industry Volume K Unit Forecast, by Country 2020 & 2033
- Table 19: Global Turbine Air Filtration Industry Revenue billion Forecast, by Application 2020 & 2033
- Table 20: Global Turbine Air Filtration Industry Volume K Unit Forecast, by Application 2020 & 2033
- Table 21: Global Turbine Air Filtration Industry Revenue billion Forecast, by Face Velocity 2020 & 2033
- Table 22: Global Turbine Air Filtration Industry Volume K Unit Forecast, by Face Velocity 2020 & 2033
- Table 23: Global Turbine Air Filtration Industry Revenue billion Forecast, by Country 2020 & 2033
- Table 24: Global Turbine Air Filtration Industry Volume K Unit Forecast, by Country 2020 & 2033
- Table 25: Global Turbine Air Filtration Industry Revenue billion Forecast, by Application 2020 & 2033
- Table 26: Global Turbine Air Filtration Industry Volume K Unit Forecast, by Application 2020 & 2033
- Table 27: Global Turbine Air Filtration Industry Revenue billion Forecast, by Face Velocity 2020 & 2033
- Table 28: Global Turbine Air Filtration Industry Volume K Unit Forecast, by Face Velocity 2020 & 2033
- Table 29: Global Turbine Air Filtration Industry Revenue billion Forecast, by Country 2020 & 2033
- Table 30: Global Turbine Air Filtration Industry Volume K Unit Forecast, by Country 2020 & 2033
- Table 31: Global Turbine Air Filtration Industry Revenue billion Forecast, by Application 2020 & 2033
- Table 32: Global Turbine Air Filtration Industry Volume K Unit Forecast, by Application 2020 & 2033
- Table 33: Global Turbine Air Filtration Industry Revenue billion Forecast, by Face Velocity 2020 & 2033
- Table 34: Global Turbine Air Filtration Industry Volume K Unit Forecast, by Face Velocity 2020 & 2033
- Table 35: Global Turbine Air Filtration Industry Revenue billion Forecast, by Country 2020 & 2033
- Table 36: Global Turbine Air Filtration Industry Volume K Unit Forecast, by Country 2020 & 2033
Frequently Asked Questions
1. What is the projected Compound Annual Growth Rate (CAGR) of the Turbine Air Filtration Industry?
The projected CAGR is approximately 3.73%.
2. Which companies are prominent players in the Turbine Air Filtration Industry?
Key companies in the market include Daikin Industries Ltd, Donaldson Company Inc, Graver Technologies LLC, Freudenberg Filtration Technologies SE & Co KG, MANN+ HUMMEL GmbH, Koch Filter Corporation, Camfil AB, Advanced Filtration Concepts, W L Gore & Associates Inc *List Not Exhaustive, Parker Hannifin Corporation, Nordic Air Filtration A/S.
3. What are the main segments of the Turbine Air Filtration Industry?
The market segments include Application, Face Velocity.
4. Can you provide details about the market size?
The market size is estimated to be USD 2.09 billion as of 2022.
5. What are some drivers contributing to market growth?
4.; Increasing Number of Automobiles4.; The Government Policy Regarding Pollution Emission Control Parameters.
6. What are the notable trends driving market growth?
Power Generation Segment to Dominate the Market.
7. Are there any restraints impacting market growth?
4.; The Technological Limitations of Air Filters.
8. Can you provide examples of recent developments in the market?
In June 2021, Camfil Group announced the expansion of its state-of-the-art technical research center in Trosa, Sweden, which is expected to be completed by the end of 2021.
9. What pricing options are available for accessing the report?
Pricing options include single-user, multi-user, and enterprise licenses priced at USD 4750, USD 5250, and USD 8750 respectively.
10. Is the market size provided in terms of value or volume?
The market size is provided in terms of value, measured in billion and volume, measured in K Unit.
11. Are there any specific market keywords associated with the report?
Yes, the market keyword associated with the report is "Turbine Air Filtration Industry," which aids in identifying and referencing the specific market segment covered.
12. How do I determine which pricing option suits my needs best?
The pricing options vary based on user requirements and access needs. Individual users may opt for single-user licenses, while businesses requiring broader access may choose multi-user or enterprise licenses for cost-effective access to the report.
13. Are there any additional resources or data provided in the Turbine Air Filtration Industry report?
While the report offers comprehensive insights, it's advisable to review the specific contents or supplementary materials provided to ascertain if additional resources or data are available.
14. How can I stay updated on further developments or reports in the Turbine Air Filtration Industry?
To stay informed about further developments, trends, and reports in the Turbine Air Filtration Industry, consider subscribing to industry newsletters, following relevant companies and organizations, or regularly checking reputable industry news sources and publications.
Methodology
Step 1 - Identification of Relevant Samples Size from Population Database


Step 2 - Approaches for Defining Global Market Size (Value, Volume* & Price*)

Note*: In applicable scenarios
Step 3 - Data Sources
Primary Research
- Web Analytics
- Survey Reports
- Research Institute
- Latest Research Reports
- Opinion Leaders
Secondary Research
- Annual Reports
- White Paper
- Latest Press Release
- Industry Association
- Paid Database
- Investor Presentations

Step 4 - Data Triangulation
Involves using different sources of information in order to increase the validity of a study
These sources are likely to be stakeholders in a program - participants, other researchers, program staff, other community members, and so on.
Then we put all data in single framework & apply various statistical tools to find out the dynamic on the market.
During the analysis stage, feedback from the stakeholder groups would be compared to determine areas of agreement as well as areas of divergence