

Key Insights
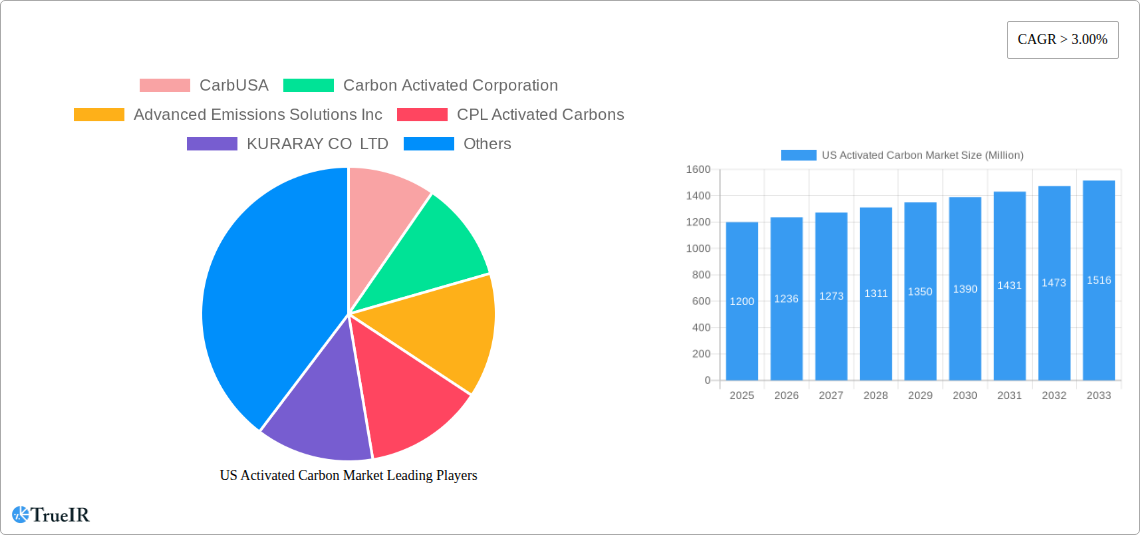
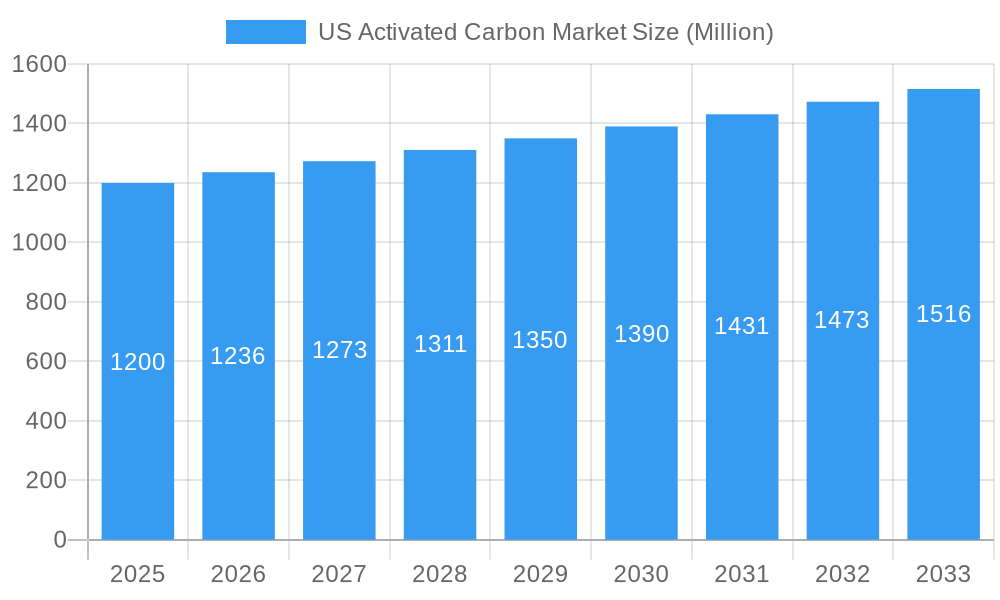
The US activated carbon market, valued at approximately $1.2 billion in 2025, is experiencing robust growth, projected to expand at a CAGR exceeding 3% from 2025 to 2033. This growth is fueled by several key drivers. The increasing demand for clean water and air, particularly in industrial and municipal applications, is a primary catalyst. Stringent environmental regulations and a heightened focus on sustainability are further propelling market expansion. The diverse applications of activated carbon, spanning water and gas purification, metal extraction, and the pharmaceutical industry, contribute to the market's breadth and resilience. Growth within the water treatment segment is especially significant, driven by increasing industrial wastewater treatment needs and expansion of municipal water treatment facilities. The food and beverage industry's reliance on activated carbon for purification and decolorization also contributes significantly to market demand. While potential supply chain disruptions and fluctuations in raw material prices pose challenges, the overall market outlook remains positive, reflecting the continuous need for effective and reliable purification solutions.
US Activated Carbon Market Market Size (In Billion)
The market segmentation reveals granular activated carbon holds a dominant share due to its widespread use in water purification. However, powdered and extruded/pelletized activated carbons are experiencing strong growth, driven by their specific advantages in various applications. Within the application segment, water purification maintains the largest share, followed closely by gas purification, especially within the automotive and industrial sectors. Major players in the US activated carbon market, including Cabot Corporation, Calgon Carbon Corporation, and Kuraray Co., Ltd., are constantly innovating and expanding their product portfolios to cater to the evolving market demands. Regional variations exist, with the Northeast and West regions showcasing higher growth rates due to a higher concentration of industrial activities and stricter environmental regulations. Strategic partnerships, acquisitions, and technological advancements are expected to shape the competitive landscape further in the coming years, ultimately strengthening the market's overall trajectory.
US Activated Carbon Market Company Market Share
US Activated Carbon Market Report: 2019-2033 Forecast
This comprehensive report provides an in-depth analysis of the US Activated Carbon Market, offering crucial insights for businesses and investors seeking to navigate this dynamic industry. The study covers the period from 2019 to 2033, with 2025 serving as the base and estimated year. The report meticulously examines market size, segmentation, competitive landscape, and future growth prospects, delivering actionable intelligence for strategic decision-making. The market is valued at xx Million in 2025 and is projected to reach xx Million by 2033, exhibiting a CAGR of xx% during the forecast period (2025-2033).
US Activated Carbon Market Market Structure & Competitive Landscape
The US activated carbon market is characterized by a moderately concentrated structure, with several major players holding significant market share. The Herfindahl-Hirschman Index (HHI) is estimated to be xx, indicating a moderately consolidated market. Key drivers of innovation include the increasing demand for sustainable solutions, stringent environmental regulations, and advancements in materials science. Regulatory impacts, particularly those related to water and air quality, significantly influence market dynamics. Product substitutes, such as membrane filtration technologies, pose a competitive threat, while mergers and acquisitions (M&A) activity contributes to market consolidation. The past five years have witnessed xx M&A deals, primarily focused on expanding geographic reach and product portfolios.
- Market Concentration: Moderately concentrated, with a HHI of approximately xx.
- Innovation Drivers: Sustainable solutions, stringent environmental regulations, materials science advancements.
- Regulatory Impacts: Stringent water and air quality standards drive demand.
- Product Substitutes: Membrane filtration technologies present competitive challenges.
- M&A Trends: xx M&A deals in the last five years, focusing on geographic expansion and product diversification.
- End-User Segmentation: Significant demand from water treatment, food & beverage, and healthcare sectors.
US Activated Carbon Market Market Trends & Opportunities
The US activated carbon market is experiencing robust and accelerating growth, propelled by a confluence of factors. Increasingly stringent environmental regulations, coupled with a heightened societal awareness of the importance of pristine water and air quality, are acting as primary demand catalysts. The ongoing industrialization across various sectors and the expanding footprint of urbanization further amplify the need for effective purification solutions. Technological advancements are playing a pivotal role, with continuous innovation leading to the development of highly efficient, customized, and specialized activated carbon materials tailored for diverse applications. This evolution not only enhances performance but also opens new avenues for market expansion. Furthermore, a significant shift in consumer preferences towards sustainable and eco-friendly products directly benefits the activated carbon industry, which is inherently linked to environmental remediation. The market landscape is characterized by dynamic competition, with both established industry leaders and agile new entrants actively vying for market share. Projections indicate a substantial market expansion, with the market size anticipated to grow from approximately **[Insert Specific Figure] Million in 2025 to [Insert Specific Figure] Million by 2033, exhibiting a Compound Annual Growth Rate (CAGR) of [Insert Specific Figure]%.** Market penetration rates are notably high in critical segments such as water purification and gas purification, demonstrating their established importance. Emerging applications, including advancements in battery technology and innovative energy storage solutions, present significant untapped opportunities for market diversification and future growth.
Dominant Markets & Segments in US Activated Carbon Market
The water treatment segment stands as the undisputed leader within the US activated carbon market. This dominance is largely attributable to the enforcement of rigorous environmental regulations aimed at safeguarding water quality and the escalating public and industrial concern over contaminants. Within the product type classification, granular activated carbon (GAC) commands the largest market share. Its widespread adoption is attributed to its inherent versatility, cost-effectiveness, and suitability for a broad spectrum of purification processes. Geographically, the market's concentration is observed in regions characterized by high levels of industrial activity and densely populated urban centers, where the demand for air and water purification is most pronounced.
- Leading Segments: Water treatment (by application) and Granular Activated Carbon (by product type) are the dominant segments.
- Key Growth Drivers:
- The stringent enforcement of environmental regulations mandating cleaner emissions and water discharge.
- Continued industrial expansion and rapid urbanization, leading to increased pollution and demand for treatment.
- The escalating need for access to safe and clean drinking water and breathable air.
- Significant public and private investments in upgrading and expanding water and wastewater infrastructure.
- The expanding adoption and exploration of activated carbon in novel and emerging applications, such as advanced filtration and specialty chemical production.
The preeminence of the water treatment segment is fundamentally driven by the extensive deployment of activated carbon in comprehensive water purification strategies for both municipal water supplies and diverse industrial wastewater treatment processes. Moreover, the substantial growth and operational demands of the food and beverage industry, coupled with an intensified focus on food and beverage safety and water purity standards, further solidify the segment's dominant position.
US Activated Carbon Market Product Analysis
The US activated carbon market showcases continuous innovation in product development, focusing on enhanced adsorption capabilities, improved efficiency, and specialized applications. New materials and manufacturing processes are leading to the development of activated carbon with higher surface area, tailored pore size distributions, and improved chemical properties. This allows for better performance in specific applications, such as gas purification, water treatment, and metal extraction. The competitive landscape is characterized by differentiation based on product performance, cost-effectiveness, and specialized applications.
Key Drivers, Barriers & Challenges in US Activated Carbon Market
Key Drivers:
- The increasing imperative for clean water and air, largely fueled by ever-evolving and more stringent environmental regulations.
- The sustained growth of industrial sectors and the ongoing trend of urbanization, directly translating into higher demand for activated carbon across a multitude of applications.
- Continuous technological advancements and innovation, leading to the development of more efficient, targeted, and specialized activated carbon products with enhanced performance characteristics.
Challenges and Restraints:
- Volatility in raw material prices (e.g., coal, coconut shells) and potential disruptions in their availability can significantly impact production costs and overall profitability.
- Intense and evolving competition from alternative purification technologies, including ion exchange resins, membranes, and advanced oxidation processes.
- The financial implications of adhering to strict environmental regulations, which can involve substantial compliance costs for manufacturers and end-users.
- Susceptibility to supply chain disruptions, particularly exacerbated during global events or logistical challenges, can affect production timelines and product delivery.
Growth Drivers in the US Activated Carbon Market Market
The market is propelled by increasing environmental regulations necessitating cleaner water and air, coupled with rising industrialization and urbanization. Technological advancements in activated carbon production lead to greater efficiency and specialized applications. Government incentives for sustainable solutions further boost market expansion.
Challenges Impacting US Activated Carbon Market Growth
The US activated carbon market faces several critical challenges that can influence its growth trajectory. Fluctuations in the cost and availability of essential raw materials present a persistent concern, directly impacting production economics. The market also contends with robust competition from alternative purification technologies, which may offer varying cost-benefit profiles. Furthermore, the necessity to comply with stringent environmental regulations, while a driver for demand, can also translate into elevated compliance costs for businesses. Supply chain vulnerabilities, especially highlighted by recent global events, can impede production and distribution. Additionally, broader economic downturns or industry-specific recessions can negatively affect overall demand and the capital expenditure for activated carbon solutions.
Key Players Shaping the US Activated Carbon Market Market
- CarbUSA
- Carbon Activated Corporation
- Advanced Emissions Solutions Inc
- CPL Activated Carbons
- KURARAY CO LTD
- JACOBI CARBONS GROUP
- Evoqua Water Technologies LLC
- Cabot Corporation
- Prominent Systems Inc
- Calgon Carbon Corporation
- Ingevity
- KUREHA CORPORATION
- Veolia
- Donau Chemie AG
- Albemarle Corporation
- PURAGEN ACTIVATED CARBONS
Significant US Activated Carbon Market Industry Milestones
- 2022: Calgon Carbon Corporation, a key player, introduced a novel line of high-performance activated carbons engineered for superior adsorption capabilities and extended service life.
- 2021: A significant strategic merger occurred between two prominent activated carbon producers, consolidating market share and potentially influencing competitive dynamics and product offerings.
- 2020: The implementation of new, more rigorous environmental regulations across various states and federal levels acted as a stimulus, driving increased demand for advanced and effective activated carbon solutions.
- 2019: A notable surge in investment within research and development (R&D) initiatives focused on developing innovative activated carbon-based technologies, including advanced materials and novel applications in areas like carbon capture and specialty filtration. (Specific quantitative details of these investments and developments are subject to available public disclosures.)
Future Outlook for US Activated Carbon Market Market
The US activated carbon market is poised for continued growth, driven by sustained demand from various sectors and ongoing technological advancements. Strategic opportunities exist in developing innovative products for emerging applications such as energy storage and environmental remediation. The market is expected to witness further consolidation through M&A activities and strategic partnerships. The overall outlook remains positive, with significant growth potential in the coming years.
US Activated Carbon Market Segmentation
-
1. Product Type
- 1.1. Powdered Activated Carbon
- 1.2. Granular Activated Carbon
- 1.3. Extruded or Pelletized Activated Carbon
-
2. Application
- 2.1. Gas Purification
- 2.2. Water Purification
- 2.3. Metal Extraction
- 2.4. Medicine
- 2.5. Other Applications
-
3. End-user Industry
- 3.1. Water Treatment
- 3.2. Food & Beverage
- 3.3. Healthcare
- 3.4. Automotive
- 3.5. Industrial Processing
- 3.6. Other End-user Industries
US Activated Carbon Market Segmentation By Geography
-
1. North America
- 1.1. United States
- 1.2. Canada
- 1.3. Mexico
-
2. South America
- 2.1. Brazil
- 2.2. Argentina
- 2.3. Rest of South America
-
3. Europe
- 3.1. United Kingdom
- 3.2. Germany
- 3.3. France
- 3.4. Italy
- 3.5. Spain
- 3.6. Russia
- 3.7. Benelux
- 3.8. Nordics
- 3.9. Rest of Europe
-
4. Middle East & Africa
- 4.1. Turkey
- 4.2. Israel
- 4.3. GCC
- 4.4. North Africa
- 4.5. South Africa
- 4.6. Rest of Middle East & Africa
-
5. Asia Pacific
- 5.1. China
- 5.2. India
- 5.3. Japan
- 5.4. South Korea
- 5.5. ASEAN
- 5.6. Oceania
- 5.7. Rest of Asia Pacific
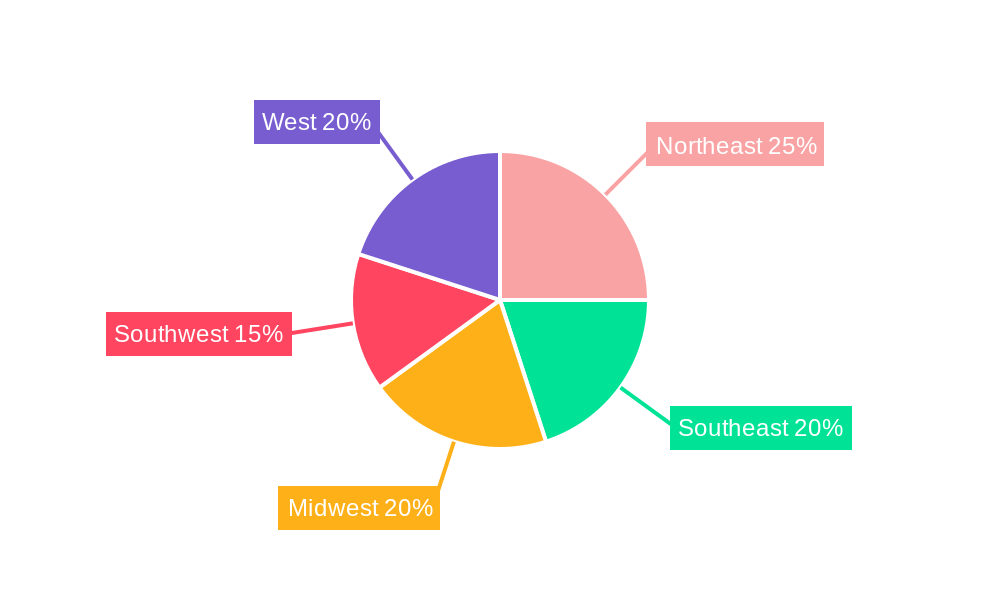
US Activated Carbon Market Regional Market Share
Geographic Coverage of US Activated Carbon Market
US Activated Carbon Market REPORT HIGHLIGHTS
| Aspects | Details |
|---|---|
| Study Period | 2020-2034 |
| Base Year | 2025 |
| Estimated Year | 2026 |
| Forecast Period | 2026-2034 |
| Historical Period | 2020-2025 |
| Growth Rate | CAGR of 8.8% from 2020-2034 |
| Segmentation |
|
Table of Contents
- 1. Introduction
- 1.1. Research Scope
- 1.2. Market Segmentation
- 1.3. Research Objective
- 1.4. Definitions and Assumptions
- 2. Executive Summary
- 2.1. Market Snapshot
- 3. Market Dynamics
- 3.1. Market Drivers
- 3.2. Market Restrains
- 3.3. Market Trends
- 3.4. Market Opportunities
- 4. Market Factor Analysis
- 4.1. Porters Five Forces
- 4.1.1. Bargaining Power of Suppliers
- 4.1.2. Bargaining Power of Buyers
- 4.1.3. Threat of New Entrants
- 4.1.4. Threat of Substitutes
- 4.1.5. Competitive Rivalry
- 4.2. PESTEL analysis
- 4.3. BCG Analysis
- 4.3.1. Stars (High Growth, High Market Share)
- 4.3.2. Cash Cows (Low Growth, High Market Share)
- 4.3.3. Question Mark (High Growth, Low Market Share)
- 4.3.4. Dogs (Low Growth, Low Market Share)
- 4.4. Ansoff Matrix Analysis
- 4.5. Supply Chain Analysis
- 4.6. Regulatory Landscape
- 4.7. Current Market Potential and Opportunity Assessment (TAM–SAM–SOM Framework)
- 4.8. TIR Analyst Note
- 4.1. Porters Five Forces
- 5. Market Analysis, Insights and Forecast 2021-2033
- 5.1. Market Analysis, Insights and Forecast - by Product Type
- 5.1.1. Powdered Activated Carbon
- 5.1.2. Granular Activated Carbon
- 5.1.3. Extruded or Pelletized Activated Carbon
- 5.2. Market Analysis, Insights and Forecast - by Application
- 5.2.1. Gas Purification
- 5.2.2. Water Purification
- 5.2.3. Metal Extraction
- 5.2.4. Medicine
- 5.2.5. Other Applications
- 5.3. Market Analysis, Insights and Forecast - by End-user Industry
- 5.3.1. Water Treatment
- 5.3.2. Food & Beverage
- 5.3.3. Healthcare
- 5.3.4. Automotive
- 5.3.5. Industrial Processing
- 5.3.6. Other End-user Industries
- 5.4. Market Analysis, Insights and Forecast - by Region
- 5.4.1. North America
- 5.4.2. South America
- 5.4.3. Europe
- 5.4.4. Middle East & Africa
- 5.4.5. Asia Pacific
- 5.1. Market Analysis, Insights and Forecast - by Product Type
- 6. Global US Activated Carbon Market Analysis, Insights and Forecast, 2021-2033
- 6.1. Market Analysis, Insights and Forecast - by Product Type
- 6.1.1. Powdered Activated Carbon
- 6.1.2. Granular Activated Carbon
- 6.1.3. Extruded or Pelletized Activated Carbon
- 6.2. Market Analysis, Insights and Forecast - by Application
- 6.2.1. Gas Purification
- 6.2.2. Water Purification
- 6.2.3. Metal Extraction
- 6.2.4. Medicine
- 6.2.5. Other Applications
- 6.3. Market Analysis, Insights and Forecast - by End-user Industry
- 6.3.1. Water Treatment
- 6.3.2. Food & Beverage
- 6.3.3. Healthcare
- 6.3.4. Automotive
- 6.3.5. Industrial Processing
- 6.3.6. Other End-user Industries
- 6.1. Market Analysis, Insights and Forecast - by Product Type
- 7. North America US Activated Carbon Market Analysis, Insights and Forecast, 2020-2032
- 7.1. Market Analysis, Insights and Forecast - by Product Type
- 7.1.1. Powdered Activated Carbon
- 7.1.2. Granular Activated Carbon
- 7.1.3. Extruded or Pelletized Activated Carbon
- 7.2. Market Analysis, Insights and Forecast - by Application
- 7.2.1. Gas Purification
- 7.2.2. Water Purification
- 7.2.3. Metal Extraction
- 7.2.4. Medicine
- 7.2.5. Other Applications
- 7.3. Market Analysis, Insights and Forecast - by End-user Industry
- 7.3.1. Water Treatment
- 7.3.2. Food & Beverage
- 7.3.3. Healthcare
- 7.3.4. Automotive
- 7.3.5. Industrial Processing
- 7.3.6. Other End-user Industries
- 7.1. Market Analysis, Insights and Forecast - by Product Type
- 8. South America US Activated Carbon Market Analysis, Insights and Forecast, 2020-2032
- 8.1. Market Analysis, Insights and Forecast - by Product Type
- 8.1.1. Powdered Activated Carbon
- 8.1.2. Granular Activated Carbon
- 8.1.3. Extruded or Pelletized Activated Carbon
- 8.2. Market Analysis, Insights and Forecast - by Application
- 8.2.1. Gas Purification
- 8.2.2. Water Purification
- 8.2.3. Metal Extraction
- 8.2.4. Medicine
- 8.2.5. Other Applications
- 8.3. Market Analysis, Insights and Forecast - by End-user Industry
- 8.3.1. Water Treatment
- 8.3.2. Food & Beverage
- 8.3.3. Healthcare
- 8.3.4. Automotive
- 8.3.5. Industrial Processing
- 8.3.6. Other End-user Industries
- 8.1. Market Analysis, Insights and Forecast - by Product Type
- 9. Europe US Activated Carbon Market Analysis, Insights and Forecast, 2020-2032
- 9.1. Market Analysis, Insights and Forecast - by Product Type
- 9.1.1. Powdered Activated Carbon
- 9.1.2. Granular Activated Carbon
- 9.1.3. Extruded or Pelletized Activated Carbon
- 9.2. Market Analysis, Insights and Forecast - by Application
- 9.2.1. Gas Purification
- 9.2.2. Water Purification
- 9.2.3. Metal Extraction
- 9.2.4. Medicine
- 9.2.5. Other Applications
- 9.3. Market Analysis, Insights and Forecast - by End-user Industry
- 9.3.1. Water Treatment
- 9.3.2. Food & Beverage
- 9.3.3. Healthcare
- 9.3.4. Automotive
- 9.3.5. Industrial Processing
- 9.3.6. Other End-user Industries
- 9.1. Market Analysis, Insights and Forecast - by Product Type
- 10. Middle East & Africa US Activated Carbon Market Analysis, Insights and Forecast, 2020-2032
- 10.1. Market Analysis, Insights and Forecast - by Product Type
- 10.1.1. Powdered Activated Carbon
- 10.1.2. Granular Activated Carbon
- 10.1.3. Extruded or Pelletized Activated Carbon
- 10.2. Market Analysis, Insights and Forecast - by Application
- 10.2.1. Gas Purification
- 10.2.2. Water Purification
- 10.2.3. Metal Extraction
- 10.2.4. Medicine
- 10.2.5. Other Applications
- 10.3. Market Analysis, Insights and Forecast - by End-user Industry
- 10.3.1. Water Treatment
- 10.3.2. Food & Beverage
- 10.3.3. Healthcare
- 10.3.4. Automotive
- 10.3.5. Industrial Processing
- 10.3.6. Other End-user Industries
- 10.1. Market Analysis, Insights and Forecast - by Product Type
- 11. Asia Pacific US Activated Carbon Market Analysis, Insights and Forecast, 2020-2032
- 11.1. Market Analysis, Insights and Forecast - by Product Type
- 11.1.1. Powdered Activated Carbon
- 11.1.2. Granular Activated Carbon
- 11.1.3. Extruded or Pelletized Activated Carbon
- 11.2. Market Analysis, Insights and Forecast - by Application
- 11.2.1. Gas Purification
- 11.2.2. Water Purification
- 11.2.3. Metal Extraction
- 11.2.4. Medicine
- 11.2.5. Other Applications
- 11.3. Market Analysis, Insights and Forecast - by End-user Industry
- 11.3.1. Water Treatment
- 11.3.2. Food & Beverage
- 11.3.3. Healthcare
- 11.3.4. Automotive
- 11.3.5. Industrial Processing
- 11.3.6. Other End-user Industries
- 11.1. Market Analysis, Insights and Forecast - by Product Type
- 12. Competitive Analysis
- 12.1. Company Profiles
- 12.1.1 CarbUSA
- 12.1.1.1. Company Overview
- 12.1.1.2. Products
- 12.1.1.3. Company Financials
- 12.1.1.4. SWOT Analysis
- 12.1.2 Carbon Activated Corporation
- 12.1.2.1. Company Overview
- 12.1.2.2. Products
- 12.1.2.3. Company Financials
- 12.1.2.4. SWOT Analysis
- 12.1.3 Advanced Emissions Solutions Inc
- 12.1.3.1. Company Overview
- 12.1.3.2. Products
- 12.1.3.3. Company Financials
- 12.1.3.4. SWOT Analysis
- 12.1.4 CPL Activated Carbons
- 12.1.4.1. Company Overview
- 12.1.4.2. Products
- 12.1.4.3. Company Financials
- 12.1.4.4. SWOT Analysis
- 12.1.5 KURARAY CO LTD
- 12.1.5.1. Company Overview
- 12.1.5.2. Products
- 12.1.5.3. Company Financials
- 12.1.5.4. SWOT Analysis
- 12.1.6 JACOBI CARBONS GROUP
- 12.1.6.1. Company Overview
- 12.1.6.2. Products
- 12.1.6.3. Company Financials
- 12.1.6.4. SWOT Analysis
- 12.1.7 Evoqua Water Technologies LLC
- 12.1.7.1. Company Overview
- 12.1.7.2. Products
- 12.1.7.3. Company Financials
- 12.1.7.4. SWOT Analysis
- 12.1.8 Cabot Corporation
- 12.1.8.1. Company Overview
- 12.1.8.2. Products
- 12.1.8.3. Company Financials
- 12.1.8.4. SWOT Analysis
- 12.1.9 Prominent Systems Inc
- 12.1.9.1. Company Overview
- 12.1.9.2. Products
- 12.1.9.3. Company Financials
- 12.1.9.4. SWOT Analysis
- 12.1.10 Calgon Carbon Corporation
- 12.1.10.1. Company Overview
- 12.1.10.2. Products
- 12.1.10.3. Company Financials
- 12.1.10.4. SWOT Analysis
- 12.1.11 Ingevity
- 12.1.11.1. Company Overview
- 12.1.11.2. Products
- 12.1.11.3. Company Financials
- 12.1.11.4. SWOT Analysis
- 12.1.12 KUREHA CORPORATION
- 12.1.12.1. Company Overview
- 12.1.12.2. Products
- 12.1.12.3. Company Financials
- 12.1.12.4. SWOT Analysis
- 12.1.13 Veolia*List Not Exhaustive
- 12.1.13.1. Company Overview
- 12.1.13.2. Products
- 12.1.13.3. Company Financials
- 12.1.13.4. SWOT Analysis
- 12.1.14 Donau Chemie AG
- 12.1.14.1. Company Overview
- 12.1.14.2. Products
- 12.1.14.3. Company Financials
- 12.1.14.4. SWOT Analysis
- 12.1.15 Albemarle Corporation
- 12.1.15.1. Company Overview
- 12.1.15.2. Products
- 12.1.15.3. Company Financials
- 12.1.15.4. SWOT Analysis
- 12.1.16 PURAGEN ACTIVATED CARBONS
- 12.1.16.1. Company Overview
- 12.1.16.2. Products
- 12.1.16.3. Company Financials
- 12.1.16.4. SWOT Analysis
- 12.1.1 CarbUSA
- 12.2. Market Entropy
- 12.2.1 Company's Key Areas Served
- 12.2.2 Recent Developments
- 12.3. Company Market Share Analysis 2025
- 12.3.1 Top 5 Companies Market Share Analysis
- 12.3.2 Top 3 Companies Market Share Analysis
- 12.4. List of Potential Customers
- 13. Research Methodology
List of Figures
- Figure 1: Global US Activated Carbon Market Revenue Breakdown (million, %) by Region 2025 & 2033
- Figure 2: North America US Activated Carbon Market Revenue (million), by Product Type 2025 & 2033
- Figure 3: North America US Activated Carbon Market Revenue Share (%), by Product Type 2025 & 2033
- Figure 4: North America US Activated Carbon Market Revenue (million), by Application 2025 & 2033
- Figure 5: North America US Activated Carbon Market Revenue Share (%), by Application 2025 & 2033
- Figure 6: North America US Activated Carbon Market Revenue (million), by End-user Industry 2025 & 2033
- Figure 7: North America US Activated Carbon Market Revenue Share (%), by End-user Industry 2025 & 2033
- Figure 8: North America US Activated Carbon Market Revenue (million), by Country 2025 & 2033
- Figure 9: North America US Activated Carbon Market Revenue Share (%), by Country 2025 & 2033
- Figure 10: South America US Activated Carbon Market Revenue (million), by Product Type 2025 & 2033
- Figure 11: South America US Activated Carbon Market Revenue Share (%), by Product Type 2025 & 2033
- Figure 12: South America US Activated Carbon Market Revenue (million), by Application 2025 & 2033
- Figure 13: South America US Activated Carbon Market Revenue Share (%), by Application 2025 & 2033
- Figure 14: South America US Activated Carbon Market Revenue (million), by End-user Industry 2025 & 2033
- Figure 15: South America US Activated Carbon Market Revenue Share (%), by End-user Industry 2025 & 2033
- Figure 16: South America US Activated Carbon Market Revenue (million), by Country 2025 & 2033
- Figure 17: South America US Activated Carbon Market Revenue Share (%), by Country 2025 & 2033
- Figure 18: Europe US Activated Carbon Market Revenue (million), by Product Type 2025 & 2033
- Figure 19: Europe US Activated Carbon Market Revenue Share (%), by Product Type 2025 & 2033
- Figure 20: Europe US Activated Carbon Market Revenue (million), by Application 2025 & 2033
- Figure 21: Europe US Activated Carbon Market Revenue Share (%), by Application 2025 & 2033
- Figure 22: Europe US Activated Carbon Market Revenue (million), by End-user Industry 2025 & 2033
- Figure 23: Europe US Activated Carbon Market Revenue Share (%), by End-user Industry 2025 & 2033
- Figure 24: Europe US Activated Carbon Market Revenue (million), by Country 2025 & 2033
- Figure 25: Europe US Activated Carbon Market Revenue Share (%), by Country 2025 & 2033
- Figure 26: Middle East & Africa US Activated Carbon Market Revenue (million), by Product Type 2025 & 2033
- Figure 27: Middle East & Africa US Activated Carbon Market Revenue Share (%), by Product Type 2025 & 2033
- Figure 28: Middle East & Africa US Activated Carbon Market Revenue (million), by Application 2025 & 2033
- Figure 29: Middle East & Africa US Activated Carbon Market Revenue Share (%), by Application 2025 & 2033
- Figure 30: Middle East & Africa US Activated Carbon Market Revenue (million), by End-user Industry 2025 & 2033
- Figure 31: Middle East & Africa US Activated Carbon Market Revenue Share (%), by End-user Industry 2025 & 2033
- Figure 32: Middle East & Africa US Activated Carbon Market Revenue (million), by Country 2025 & 2033
- Figure 33: Middle East & Africa US Activated Carbon Market Revenue Share (%), by Country 2025 & 2033
- Figure 34: Asia Pacific US Activated Carbon Market Revenue (million), by Product Type 2025 & 2033
- Figure 35: Asia Pacific US Activated Carbon Market Revenue Share (%), by Product Type 2025 & 2033
- Figure 36: Asia Pacific US Activated Carbon Market Revenue (million), by Application 2025 & 2033
- Figure 37: Asia Pacific US Activated Carbon Market Revenue Share (%), by Application 2025 & 2033
- Figure 38: Asia Pacific US Activated Carbon Market Revenue (million), by End-user Industry 2025 & 2033
- Figure 39: Asia Pacific US Activated Carbon Market Revenue Share (%), by End-user Industry 2025 & 2033
- Figure 40: Asia Pacific US Activated Carbon Market Revenue (million), by Country 2025 & 2033
- Figure 41: Asia Pacific US Activated Carbon Market Revenue Share (%), by Country 2025 & 2033
List of Tables
- Table 1: Global US Activated Carbon Market Revenue million Forecast, by Product Type 2020 & 2033
- Table 2: Global US Activated Carbon Market Revenue million Forecast, by Application 2020 & 2033
- Table 3: Global US Activated Carbon Market Revenue million Forecast, by End-user Industry 2020 & 2033
- Table 4: Global US Activated Carbon Market Revenue million Forecast, by Region 2020 & 2033
- Table 5: Global US Activated Carbon Market Revenue million Forecast, by Product Type 2020 & 2033
- Table 6: Global US Activated Carbon Market Revenue million Forecast, by Application 2020 & 2033
- Table 7: Global US Activated Carbon Market Revenue million Forecast, by End-user Industry 2020 & 2033
- Table 8: Global US Activated Carbon Market Revenue million Forecast, by Country 2020 & 2033
- Table 9: United States US Activated Carbon Market Revenue (million) Forecast, by Application 2020 & 2033
- Table 10: Canada US Activated Carbon Market Revenue (million) Forecast, by Application 2020 & 2033
- Table 11: Mexico US Activated Carbon Market Revenue (million) Forecast, by Application 2020 & 2033
- Table 12: Global US Activated Carbon Market Revenue million Forecast, by Product Type 2020 & 2033
- Table 13: Global US Activated Carbon Market Revenue million Forecast, by Application 2020 & 2033
- Table 14: Global US Activated Carbon Market Revenue million Forecast, by End-user Industry 2020 & 2033
- Table 15: Global US Activated Carbon Market Revenue million Forecast, by Country 2020 & 2033
- Table 16: Brazil US Activated Carbon Market Revenue (million) Forecast, by Application 2020 & 2033
- Table 17: Argentina US Activated Carbon Market Revenue (million) Forecast, by Application 2020 & 2033
- Table 18: Rest of South America US Activated Carbon Market Revenue (million) Forecast, by Application 2020 & 2033
- Table 19: Global US Activated Carbon Market Revenue million Forecast, by Product Type 2020 & 2033
- Table 20: Global US Activated Carbon Market Revenue million Forecast, by Application 2020 & 2033
- Table 21: Global US Activated Carbon Market Revenue million Forecast, by End-user Industry 2020 & 2033
- Table 22: Global US Activated Carbon Market Revenue million Forecast, by Country 2020 & 2033
- Table 23: United Kingdom US Activated Carbon Market Revenue (million) Forecast, by Application 2020 & 2033
- Table 24: Germany US Activated Carbon Market Revenue (million) Forecast, by Application 2020 & 2033
- Table 25: France US Activated Carbon Market Revenue (million) Forecast, by Application 2020 & 2033
- Table 26: Italy US Activated Carbon Market Revenue (million) Forecast, by Application 2020 & 2033
- Table 27: Spain US Activated Carbon Market Revenue (million) Forecast, by Application 2020 & 2033
- Table 28: Russia US Activated Carbon Market Revenue (million) Forecast, by Application 2020 & 2033
- Table 29: Benelux US Activated Carbon Market Revenue (million) Forecast, by Application 2020 & 2033
- Table 30: Nordics US Activated Carbon Market Revenue (million) Forecast, by Application 2020 & 2033
- Table 31: Rest of Europe US Activated Carbon Market Revenue (million) Forecast, by Application 2020 & 2033
- Table 32: Global US Activated Carbon Market Revenue million Forecast, by Product Type 2020 & 2033
- Table 33: Global US Activated Carbon Market Revenue million Forecast, by Application 2020 & 2033
- Table 34: Global US Activated Carbon Market Revenue million Forecast, by End-user Industry 2020 & 2033
- Table 35: Global US Activated Carbon Market Revenue million Forecast, by Country 2020 & 2033
- Table 36: Turkey US Activated Carbon Market Revenue (million) Forecast, by Application 2020 & 2033
- Table 37: Israel US Activated Carbon Market Revenue (million) Forecast, by Application 2020 & 2033
- Table 38: GCC US Activated Carbon Market Revenue (million) Forecast, by Application 2020 & 2033
- Table 39: North Africa US Activated Carbon Market Revenue (million) Forecast, by Application 2020 & 2033
- Table 40: South Africa US Activated Carbon Market Revenue (million) Forecast, by Application 2020 & 2033
- Table 41: Rest of Middle East & Africa US Activated Carbon Market Revenue (million) Forecast, by Application 2020 & 2033
- Table 42: Global US Activated Carbon Market Revenue million Forecast, by Product Type 2020 & 2033
- Table 43: Global US Activated Carbon Market Revenue million Forecast, by Application 2020 & 2033
- Table 44: Global US Activated Carbon Market Revenue million Forecast, by End-user Industry 2020 & 2033
- Table 45: Global US Activated Carbon Market Revenue million Forecast, by Country 2020 & 2033
- Table 46: China US Activated Carbon Market Revenue (million) Forecast, by Application 2020 & 2033
- Table 47: India US Activated Carbon Market Revenue (million) Forecast, by Application 2020 & 2033
- Table 48: Japan US Activated Carbon Market Revenue (million) Forecast, by Application 2020 & 2033
- Table 49: South Korea US Activated Carbon Market Revenue (million) Forecast, by Application 2020 & 2033
- Table 50: ASEAN US Activated Carbon Market Revenue (million) Forecast, by Application 2020 & 2033
- Table 51: Oceania US Activated Carbon Market Revenue (million) Forecast, by Application 2020 & 2033
- Table 52: Rest of Asia Pacific US Activated Carbon Market Revenue (million) Forecast, by Application 2020 & 2033
Frequently Asked Questions
1. What is the projected Compound Annual Growth Rate (CAGR) of the US Activated Carbon Market?
The projected CAGR is approximately 8.8%.
2. Which companies are prominent players in the US Activated Carbon Market?
Key companies in the market include CarbUSA, Carbon Activated Corporation, Advanced Emissions Solutions Inc, CPL Activated Carbons, KURARAY CO LTD, JACOBI CARBONS GROUP, Evoqua Water Technologies LLC, Cabot Corporation, Prominent Systems Inc, Calgon Carbon Corporation, Ingevity, KUREHA CORPORATION, Veolia*List Not Exhaustive, Donau Chemie AG, Albemarle Corporation, PURAGEN ACTIVATED CARBONS.
3. What are the main segments of the US Activated Carbon Market?
The market segments include Product Type, Application, End-user Industry.
4. Can you provide details about the market size?
The market size is estimated to be USD 1214.47 million as of 2022.
5. What are some drivers contributing to market growth?
; Conformance to Stringent Environmental Regulations In Water Treatment Applications; Augmenting Prominence for Air Pollution Control (Especially Mercury Removal).
6. What are the notable trends driving market growth?
Emerging Applications in the Medical and Pharmaceutical Sector.
7. Are there any restraints impacting market growth?
; Narrower Markets Due to Increased Costs of Some Grades of Activated Carbon; Threat of Substitutes Like Silica Gel and Supersand.
8. Can you provide examples of recent developments in the market?
N/A
9. What pricing options are available for accessing the report?
Pricing options include single-user, multi-user, and enterprise licenses priced at USD 3800, USD 4500, and USD 5800 respectively.
10. Is the market size provided in terms of value or volume?
The market size is provided in terms of value, measured in million.
11. Are there any specific market keywords associated with the report?
Yes, the market keyword associated with the report is "US Activated Carbon Market," which aids in identifying and referencing the specific market segment covered.
12. How do I determine which pricing option suits my needs best?
The pricing options vary based on user requirements and access needs. Individual users may opt for single-user licenses, while businesses requiring broader access may choose multi-user or enterprise licenses for cost-effective access to the report.
13. Are there any additional resources or data provided in the US Activated Carbon Market report?
While the report offers comprehensive insights, it's advisable to review the specific contents or supplementary materials provided to ascertain if additional resources or data are available.
14. How can I stay updated on further developments or reports in the US Activated Carbon Market?
To stay informed about further developments, trends, and reports in the US Activated Carbon Market, consider subscribing to industry newsletters, following relevant companies and organizations, or regularly checking reputable industry news sources and publications.
Methodology
Step 1 - Identification of Relevant Samples Size from Population Database


Step 2 - Approaches for Defining Global Market Size (Value, Volume* & Price*)

Note*: In applicable scenarios
Step 3 - Data Sources
Primary Research
- Web Analytics
- Survey Reports
- Research Institute
- Latest Research Reports
- Opinion Leaders
Secondary Research
- Annual Reports
- White Paper
- Latest Press Release
- Industry Association
- Paid Database
- Investor Presentations

Step 4 - Data Triangulation
Involves using different sources of information in order to increase the validity of a study
These sources are likely to be stakeholders in a program - participants, other researchers, program staff, other community members, and so on.
Then we put all data in single framework & apply various statistical tools to find out the dynamic on the market.
During the analysis stage, feedback from the stakeholder groups would be compared to determine areas of agreement as well as areas of divergence