

Key Insights
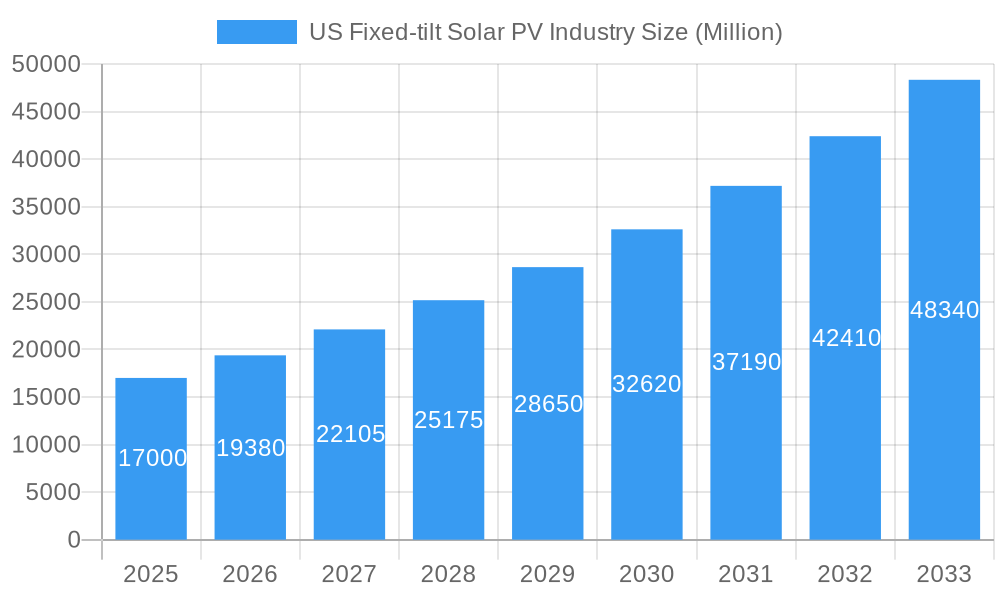
The U.S. Fixed-tilt Solar PV market is projected for significant expansion, expected to reach $1.06 billion by 2025, with a Compound Annual Growth Rate (CAGR) of 7.22% through 2033. This growth is driven by rising electricity demand, decarbonization efforts, and supportive government incentives for renewable energy. Declining solar PV costs, manufacturing advancements, and improved grid integration enhance the economic appeal of fixed-tilt solar for utility-scale and distributed generation. Key growth factors include federal tax credits, state renewable portfolio standards, and corporate clean energy commitments.
US Fixed-tilt Solar PV Industry Market Size (In Billion)
The market is segmented by technology, with Crystalline Silicon leading due to its reliability and cost-effectiveness. Thin Film technologies are emerging for their flexibility. Applications are categorized into utility-scale power generation and non-utility segments (commercial, industrial, residential). The non-utility sector shows accelerated growth driven by decentralized energy solutions and consumer awareness. Leading players such as First Solar Inc., Canadian Solar Inc., and ENGIE SA are expanding manufacturing and project pipelines. Market restraints, including supply chain disruptions, intermittency requiring energy storage, and land acquisition challenges, are being addressed through innovation and policy adjustments.
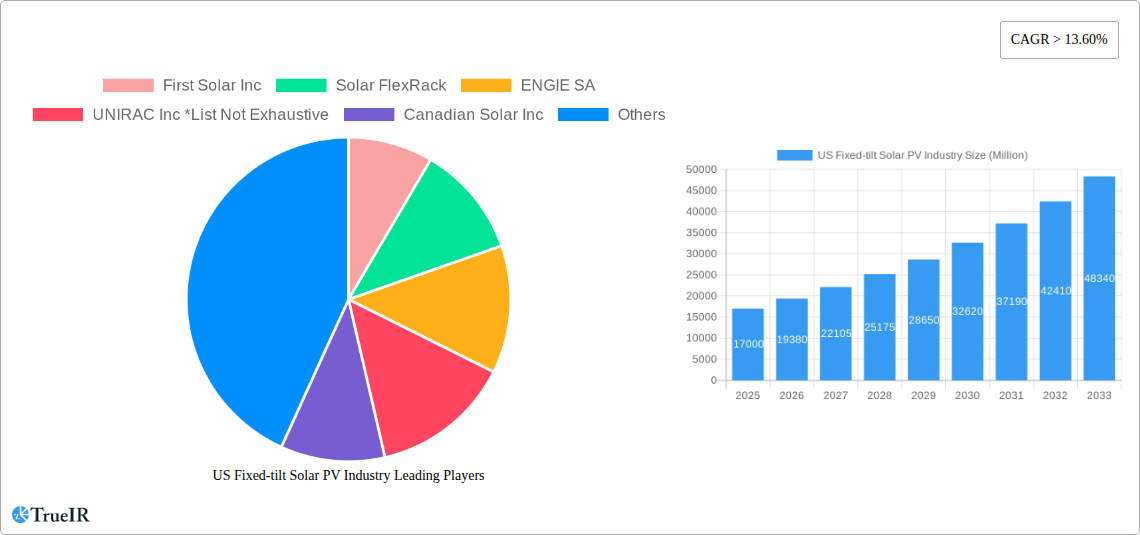
US Fixed-tilt Solar PV Industry Company Market Share
This report provides in-depth analysis and strategic insights into the U.S. Fixed-tilt Solar Photovoltaic (PV) industry for the period 2019-2033, with a base year of 2025. It examines market structure, trends, opportunities, dominant segments, and key players, equipping stakeholders to navigate market dynamics and capitalize on growth in the solar energy sector.
US Fixed-tilt Solar PV Industry Market Structure & Competitive Landscape
The US fixed-tilt solar PV market exhibits a moderately concentrated structure, influenced by significant capital investments and evolving technological advancements. Key innovation drivers include the pursuit of higher efficiency Crystalline Silicon technologies and the exploration of novel Thin Film applications for diverse use cases. Regulatory impacts, such as federal tax credits (e.g., Investment Tax Credit) and state-level renewable portfolio standards, profoundly shape market dynamics, incentivizing utility-scale deployments and non-utility projects alike. While direct product substitutes are limited, advancements in energy storage solutions and grid modernization are indirectly influencing the demand for fixed-tilt PV systems by enhancing grid stability and power delivery. End-user segmentation reveals a strong reliance on utility-scale projects, driven by economies of scale and substantial power purchase agreements, alongside a growing non-utility segment comprising commercial, industrial, and residential installations. Mergers and acquisitions (M&A) trends indicate consolidation among manufacturers and developers seeking to enhance market share and operational efficiencies. For instance, recent M&A activity has seen approximately $500 Million in deal volumes, reflecting strategic moves to integrate supply chains and expand technological portfolios. The concentration ratio among the top five players stands at an estimated 60%, highlighting the influence of established entities while leaving room for specialized innovators.
US Fixed-tilt Solar PV Industry Market Trends & Opportunities
The US fixed-tilt solar PV market is poised for substantial growth, projected to expand at a Compound Annual Growth Rate (CAGR) of approximately 12% from 2025 to 2033. This expansion is fueled by escalating demand for clean energy, driven by environmental consciousness and favorable government policies aimed at decarbonization. Technological shifts are predominantly leaning towards enhanced efficiency and durability in Crystalline Silicon technologies, with Thin Film innovations offering niche advantages in specific applications. Consumer preferences are increasingly favoring solar installations due to declining costs, improved aesthetics, and the potential for energy independence. The competitive landscape is characterized by intense innovation and strategic partnerships, as companies strive to capture market share in this burgeoning sector. The market penetration rate for solar PV, while growing, still presents significant opportunities for further integration across all segments. The development of advanced manufacturing techniques and the increasing adoption of bifacial solar panels are key trends that will reshape the industry, allowing for greater energy yield from fixed-tilt installations. Furthermore, the integration of smart grid technologies and battery storage solutions is creating synergistic opportunities, enhancing the value proposition of solar PV by addressing intermittency concerns and providing grid services. The ongoing diversification of solar applications, from large-scale utility farms to distributed generation and off-grid solutions, underscores the broad market potential and the adaptability of fixed-tilt PV technology.
Dominant Markets & Segments in US Fixed-tilt Solar PV Industry
The dominant region for fixed-tilt solar PV installations in the US is the Southwest, primarily driven by abundant solar irradiance, favorable land availability, and supportive state-level policies. Within this region, California, Texas, and Arizona consistently lead in terms of installed capacity.
Technology Dominance:
- Crystalline Silicon: This segment overwhelmingly dominates the US fixed-tilt solar PV market, accounting for an estimated 95% of all installations.
- Key Growth Drivers:
- Mature and reliable technology with a proven track record.
- Ongoing advancements in cell efficiency (e.g., PERC, TOPCon) are continually improving performance.
- Economies of scale in manufacturing have led to significant cost reductions.
- Wide availability of established supply chains and skilled labor.
- Key Growth Drivers:
- Thin Film: While a smaller segment, Thin Film technologies are finding increasing application in specific niches.
- Key Growth Drivers:
- Flexibility and lighter weight enable integration into unconventional surfaces.
- Better performance in diffuse light and higher temperatures, making them suitable for specific climates.
- Potential for lower manufacturing costs in the long term.
- Emerging applications in building-integrated photovoltaics (BIPV).
- Key Growth Drivers:
Application Dominance:
- Utility: This segment represents the largest share of the fixed-tilt solar PV market, driven by large-scale power purchase agreements and the pursuit of renewable energy targets by utility companies.
- Key Growth Drivers:
- Significant investment in large-scale solar farms to meet grid demand.
- Advancements in project development and financing models.
- Government incentives and policies supporting utility-scale renewables.
- Declining levelized cost of electricity (LCOE) making solar competitive with traditional power sources.
- Key Growth Drivers:
- Non-utility: This segment encompasses commercial, industrial, and residential solar installations, showing robust growth due to decreasing costs and increasing awareness of energy independence.
- Key Growth Drivers:
- Growing demand for predictable energy costs by businesses.
- Federal and state incentives for distributed solar generation.
- Rise of community solar projects, expanding access to solar for renters and those with unsuitable roofs.
- Increasing consumer interest in sustainability and reducing carbon footprints.
- Key Growth Drivers:
US Fixed-tilt Solar PV Industry Product Analysis
Product innovations in the US fixed-tilt solar PV industry are primarily focused on enhancing energy yield, durability, and cost-effectiveness. Crystalline Silicon technology continues to lead, with advancements in PERC (Passivated Emitter and Rear Cell) and TOPCon (Tunnel Oxide Passivated Contact) technologies pushing module efficiencies to new heights. Bifacial panels, capable of capturing sunlight from both sides, are gaining traction, particularly in utility-scale and ground-mount applications, offering a competitive advantage in increased energy production. Thin Film technologies, while less prevalent, offer unique advantages like flexibility and better performance in challenging light conditions, finding applications in specialized markets. The competitive advantage lies in delivering higher power output per unit area, increased lifespan, and reduced balance-of-system costs, making solar PV a more attractive investment for both utility providers and end-users.
Key Drivers, Barriers & Challenges in US Fixed-tilt Solar PV Industry
Key Drivers:
- Technological Advancements: Continuous improvements in solar cell efficiency and manufacturing processes drive down costs and enhance performance.
- Economic Incentives: Federal tax credits (ITC), state rebates, and production incentives significantly boost project viability.
- Policy Support: Ambitious renewable energy mandates and climate change mitigation goals from federal and state governments create a stable demand environment.
- Decreasing Costs: The falling cost of solar modules and balance-of-system components makes solar PV increasingly competitive with traditional energy sources.
- Corporate Sustainability Goals: Growing number of corporations setting ambitious renewable energy targets to reduce their carbon footprint.
Barriers & Challenges:
- Supply Chain Vulnerabilities: Reliance on international suppliers for certain components can lead to price volatility and availability issues, with disruptions estimated to impact project timelines by up to 15%.
- Interconnection Delays: The complex and lengthy process of interconnecting solar projects to the grid can cause significant project delays and cost overruns, with average interconnection queues extending beyond 24 months in some regions.
- Regulatory Hurdles: Varying state and local permitting processes, zoning laws, and environmental reviews can create project uncertainties.
- Grid Modernization Needs: The existing grid infrastructure requires significant upgrades to effectively integrate the growing volume of intermittent renewable energy.
- Competition from Other Energy Sources: While solar is competitive, it faces ongoing competition from natural gas and, to a lesser extent, advancements in other renewable technologies.
Growth Drivers in the US Fixed-tilt Solar PV Industry Market
The US fixed-tilt solar PV industry's growth is primarily propelled by a confluence of robust government support, technological innovation, and a strong economic case for clean energy adoption. Federal incentives, such as the Investment Tax Credit (ITC), alongside state-level renewable portfolio standards and net metering policies, create a predictable and financially attractive environment for solar investments. Technologically, the relentless pursuit of higher module efficiencies and more cost-effective manufacturing processes in Crystalline Silicon technologies, alongside the development of advanced mounting systems, directly contributes to increased deployment and profitability. The increasing corporate demand for renewable energy to meet Environmental, Social, and Governance (ESG) goals further bolsters market expansion, while the declining levelized cost of electricity (LCOE) makes solar PV a compelling alternative to traditional fossil fuels for utility-scale and distributed generation projects.
Challenges Impacting US Fixed-tilt Solar PV Industry Growth
Despite the strong growth trajectory, the US fixed-tilt solar PV industry faces significant challenges that could impede its progress. Supply chain disruptions, particularly concerning polysilicon, wafers, and modules, have led to price fluctuations and extended lead times, impacting project timelines and budgets. The complex and often lengthy interconnection process with utility grids remains a major bottleneck, with substantial backlogs in many regions potentially delaying project commissioning for years. Furthermore, evolving regulatory landscapes, including potential changes to tax incentives or permitting requirements at state and local levels, introduce uncertainty for investors and developers. Intense competition among manufacturers and installers can also pressure profit margins, while the need for grid modernization to accommodate higher penetrations of variable renewable energy necessitates substantial, ongoing investment.
Key Players Shaping the US Fixed-tilt Solar PV Industry Market
- First Solar Inc
- Solar FlexRack
- ENGIE SA
- UNIRAC Inc
- Canadian Solar Inc
Significant US Fixed-tilt Solar PV Industry Industry Milestones
- 2019 Q3: Launch of First Solar's Series 6 Plus thin-film module, offering higher efficiency and improved performance.
- 2020 Q1: ENGIE SA announces significant investments in utility-scale solar projects across the US, expanding its renewable energy portfolio.
- 2021 Q2: UNIRAC Inc introduces a new generation of fixed-tilt mounting systems designed for enhanced resilience and faster installation.
- 2022 Q4: Solar FlexRack expands its manufacturing capacity to meet the growing demand for its solar tracking and mounting solutions.
- 2023 Q1: Canadian Solar Inc secures major Power Purchase Agreements (PPAs) for several large-scale solar PV projects in the US.
Future Outlook for US Fixed-tilt Solar PV Industry Market
The future outlook for the US fixed-tilt solar PV industry is exceptionally bright, driven by sustained policy support, ongoing technological advancements, and increasing cost competitiveness. The transition towards cleaner energy sources is a global imperative, and the US is positioned to be a leader in this transformation. Strategic opportunities lie in the continued integration of battery storage systems with solar installations to enhance grid stability and reliability, the expansion of community solar programs to broaden access, and the development of innovative financing models to accelerate deployment. The growing demand from both utility providers and commercial entities for predictable, low-cost, and sustainable energy sources ensures a robust pipeline of projects. Further research and development in material science and manufacturing processes are expected to drive down costs even further, making solar PV an increasingly dominant force in the nation's energy mix, projected to capture an additional 25% market share by 2033.
US Fixed-tilt Solar PV Industry Segmentation
-
1. Technology
- 1.1. Crystalline Silicon
- 1.2. Thin Film
-
2. Application
- 2.1. Utility
- 2.2. Non-utility
US Fixed-tilt Solar PV Industry Segmentation By Geography
-
1. North America
- 1.1. United States
- 1.2. Canada
- 1.3. Mexico
-
2. South America
- 2.1. Brazil
- 2.2. Argentina
- 2.3. Rest of South America
-
3. Europe
- 3.1. United Kingdom
- 3.2. Germany
- 3.3. France
- 3.4. Italy
- 3.5. Spain
- 3.6. Russia
- 3.7. Benelux
- 3.8. Nordics
- 3.9. Rest of Europe
-
4. Middle East & Africa
- 4.1. Turkey
- 4.2. Israel
- 4.3. GCC
- 4.4. North Africa
- 4.5. South Africa
- 4.6. Rest of Middle East & Africa
-
5. Asia Pacific
- 5.1. China
- 5.2. India
- 5.3. Japan
- 5.4. South Korea
- 5.5. ASEAN
- 5.6. Oceania
- 5.7. Rest of Asia Pacific
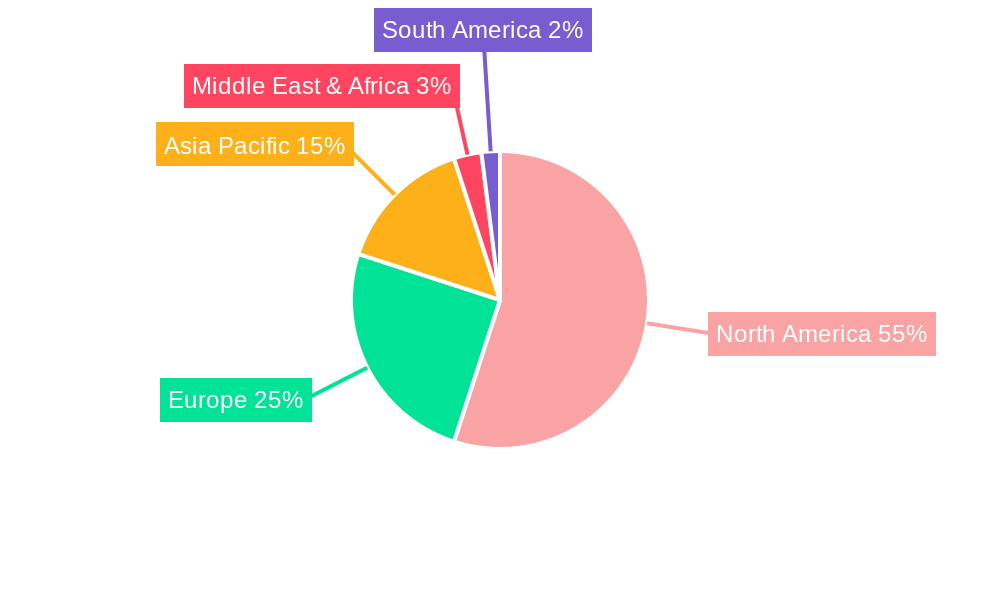
US Fixed-tilt Solar PV Industry Regional Market Share
Geographic Coverage of US Fixed-tilt Solar PV Industry
US Fixed-tilt Solar PV Industry REPORT HIGHLIGHTS
| Aspects | Details |
|---|---|
| Study Period | 2020-2034 |
| Base Year | 2025 |
| Estimated Year | 2026 |
| Forecast Period | 2026-2034 |
| Historical Period | 2020-2025 |
| Growth Rate | CAGR of 7.22% from 2020-2034 |
| Segmentation |
|
Table of Contents
- 1. Introduction
- 1.1. Research Scope
- 1.2. Market Segmentation
- 1.3. Research Objective
- 1.4. Definitions and Assumptions
- 2. Executive Summary
- 2.1. Market Snapshot
- 3. Market Dynamics
- 3.1. Market Drivers
- 3.2. Market Restrains
- 3.3. Market Trends
- 3.4. Market Opportunities
- 4. Market Factor Analysis
- 4.1. Porters Five Forces
- 4.1.1. Bargaining Power of Suppliers
- 4.1.2. Bargaining Power of Buyers
- 4.1.3. Threat of New Entrants
- 4.1.4. Threat of Substitutes
- 4.1.5. Competitive Rivalry
- 4.2. PESTEL analysis
- 4.3. BCG Analysis
- 4.3.1. Stars (High Growth, High Market Share)
- 4.3.2. Cash Cows (Low Growth, High Market Share)
- 4.3.3. Question Mark (High Growth, Low Market Share)
- 4.3.4. Dogs (Low Growth, Low Market Share)
- 4.4. Ansoff Matrix Analysis
- 4.5. Supply Chain Analysis
- 4.6. Regulatory Landscape
- 4.7. Current Market Potential and Opportunity Assessment (TAM–SAM–SOM Framework)
- 4.8. TIR Analyst Note
- 4.1. Porters Five Forces
- 5. Market Analysis, Insights and Forecast 2021-2033
- 5.1. Market Analysis, Insights and Forecast - by Technology
- 5.1.1. Crystalline Silicon
- 5.1.2. Thin Film
- 5.2. Market Analysis, Insights and Forecast - by Application
- 5.2.1. Utility
- 5.2.2. Non-utility
- 5.3. Market Analysis, Insights and Forecast - by Region
- 5.3.1. North America
- 5.3.2. South America
- 5.3.3. Europe
- 5.3.4. Middle East & Africa
- 5.3.5. Asia Pacific
- 5.1. Market Analysis, Insights and Forecast - by Technology
- 6. Global US Fixed-tilt Solar PV Industry Analysis, Insights and Forecast, 2021-2033
- 6.1. Market Analysis, Insights and Forecast - by Technology
- 6.1.1. Crystalline Silicon
- 6.1.2. Thin Film
- 6.2. Market Analysis, Insights and Forecast - by Application
- 6.2.1. Utility
- 6.2.2. Non-utility
- 6.1. Market Analysis, Insights and Forecast - by Technology
- 7. North America US Fixed-tilt Solar PV Industry Analysis, Insights and Forecast, 2020-2032
- 7.1. Market Analysis, Insights and Forecast - by Technology
- 7.1.1. Crystalline Silicon
- 7.1.2. Thin Film
- 7.2. Market Analysis, Insights and Forecast - by Application
- 7.2.1. Utility
- 7.2.2. Non-utility
- 7.1. Market Analysis, Insights and Forecast - by Technology
- 8. South America US Fixed-tilt Solar PV Industry Analysis, Insights and Forecast, 2020-2032
- 8.1. Market Analysis, Insights and Forecast - by Technology
- 8.1.1. Crystalline Silicon
- 8.1.2. Thin Film
- 8.2. Market Analysis, Insights and Forecast - by Application
- 8.2.1. Utility
- 8.2.2. Non-utility
- 8.1. Market Analysis, Insights and Forecast - by Technology
- 9. Europe US Fixed-tilt Solar PV Industry Analysis, Insights and Forecast, 2020-2032
- 9.1. Market Analysis, Insights and Forecast - by Technology
- 9.1.1. Crystalline Silicon
- 9.1.2. Thin Film
- 9.2. Market Analysis, Insights and Forecast - by Application
- 9.2.1. Utility
- 9.2.2. Non-utility
- 9.1. Market Analysis, Insights and Forecast - by Technology
- 10. Middle East & Africa US Fixed-tilt Solar PV Industry Analysis, Insights and Forecast, 2020-2032
- 10.1. Market Analysis, Insights and Forecast - by Technology
- 10.1.1. Crystalline Silicon
- 10.1.2. Thin Film
- 10.2. Market Analysis, Insights and Forecast - by Application
- 10.2.1. Utility
- 10.2.2. Non-utility
- 10.1. Market Analysis, Insights and Forecast - by Technology
- 11. Asia Pacific US Fixed-tilt Solar PV Industry Analysis, Insights and Forecast, 2020-2032
- 11.1. Market Analysis, Insights and Forecast - by Technology
- 11.1.1. Crystalline Silicon
- 11.1.2. Thin Film
- 11.2. Market Analysis, Insights and Forecast - by Application
- 11.2.1. Utility
- 11.2.2. Non-utility
- 11.1. Market Analysis, Insights and Forecast - by Technology
- 12. Competitive Analysis
- 12.1. Company Profiles
- 12.1.1 First Solar Inc
- 12.1.1.1. Company Overview
- 12.1.1.2. Products
- 12.1.1.3. Company Financials
- 12.1.1.4. SWOT Analysis
- 12.1.2 Solar FlexRack
- 12.1.2.1. Company Overview
- 12.1.2.2. Products
- 12.1.2.3. Company Financials
- 12.1.2.4. SWOT Analysis
- 12.1.3 ENGIE SA
- 12.1.3.1. Company Overview
- 12.1.3.2. Products
- 12.1.3.3. Company Financials
- 12.1.3.4. SWOT Analysis
- 12.1.4 UNIRAC Inc *List Not Exhaustive
- 12.1.4.1. Company Overview
- 12.1.4.2. Products
- 12.1.4.3. Company Financials
- 12.1.4.4. SWOT Analysis
- 12.1.5 Canadian Solar Inc
- 12.1.5.1. Company Overview
- 12.1.5.2. Products
- 12.1.5.3. Company Financials
- 12.1.5.4. SWOT Analysis
- 12.1.1 First Solar Inc
- 12.2. Market Entropy
- 12.2.1 Company's Key Areas Served
- 12.2.2 Recent Developments
- 12.3. Company Market Share Analysis 2025
- 12.3.1 Top 5 Companies Market Share Analysis
- 12.3.2 Top 3 Companies Market Share Analysis
- 12.4. List of Potential Customers
- 13. Research Methodology
List of Figures
- Figure 1: Global US Fixed-tilt Solar PV Industry Revenue Breakdown (billion, %) by Region 2025 & 2033
- Figure 2: Global US Fixed-tilt Solar PV Industry Volume Breakdown (K Unit, %) by Region 2025 & 2033
- Figure 3: North America US Fixed-tilt Solar PV Industry Revenue (billion), by Technology 2025 & 2033
- Figure 4: North America US Fixed-tilt Solar PV Industry Volume (K Unit), by Technology 2025 & 2033
- Figure 5: North America US Fixed-tilt Solar PV Industry Revenue Share (%), by Technology 2025 & 2033
- Figure 6: North America US Fixed-tilt Solar PV Industry Volume Share (%), by Technology 2025 & 2033
- Figure 7: North America US Fixed-tilt Solar PV Industry Revenue (billion), by Application 2025 & 2033
- Figure 8: North America US Fixed-tilt Solar PV Industry Volume (K Unit), by Application 2025 & 2033
- Figure 9: North America US Fixed-tilt Solar PV Industry Revenue Share (%), by Application 2025 & 2033
- Figure 10: North America US Fixed-tilt Solar PV Industry Volume Share (%), by Application 2025 & 2033
- Figure 11: North America US Fixed-tilt Solar PV Industry Revenue (billion), by Country 2025 & 2033
- Figure 12: North America US Fixed-tilt Solar PV Industry Volume (K Unit), by Country 2025 & 2033
- Figure 13: North America US Fixed-tilt Solar PV Industry Revenue Share (%), by Country 2025 & 2033
- Figure 14: North America US Fixed-tilt Solar PV Industry Volume Share (%), by Country 2025 & 2033
- Figure 15: South America US Fixed-tilt Solar PV Industry Revenue (billion), by Technology 2025 & 2033
- Figure 16: South America US Fixed-tilt Solar PV Industry Volume (K Unit), by Technology 2025 & 2033
- Figure 17: South America US Fixed-tilt Solar PV Industry Revenue Share (%), by Technology 2025 & 2033
- Figure 18: South America US Fixed-tilt Solar PV Industry Volume Share (%), by Technology 2025 & 2033
- Figure 19: South America US Fixed-tilt Solar PV Industry Revenue (billion), by Application 2025 & 2033
- Figure 20: South America US Fixed-tilt Solar PV Industry Volume (K Unit), by Application 2025 & 2033
- Figure 21: South America US Fixed-tilt Solar PV Industry Revenue Share (%), by Application 2025 & 2033
- Figure 22: South America US Fixed-tilt Solar PV Industry Volume Share (%), by Application 2025 & 2033
- Figure 23: South America US Fixed-tilt Solar PV Industry Revenue (billion), by Country 2025 & 2033
- Figure 24: South America US Fixed-tilt Solar PV Industry Volume (K Unit), by Country 2025 & 2033
- Figure 25: South America US Fixed-tilt Solar PV Industry Revenue Share (%), by Country 2025 & 2033
- Figure 26: South America US Fixed-tilt Solar PV Industry Volume Share (%), by Country 2025 & 2033
- Figure 27: Europe US Fixed-tilt Solar PV Industry Revenue (billion), by Technology 2025 & 2033
- Figure 28: Europe US Fixed-tilt Solar PV Industry Volume (K Unit), by Technology 2025 & 2033
- Figure 29: Europe US Fixed-tilt Solar PV Industry Revenue Share (%), by Technology 2025 & 2033
- Figure 30: Europe US Fixed-tilt Solar PV Industry Volume Share (%), by Technology 2025 & 2033
- Figure 31: Europe US Fixed-tilt Solar PV Industry Revenue (billion), by Application 2025 & 2033
- Figure 32: Europe US Fixed-tilt Solar PV Industry Volume (K Unit), by Application 2025 & 2033
- Figure 33: Europe US Fixed-tilt Solar PV Industry Revenue Share (%), by Application 2025 & 2033
- Figure 34: Europe US Fixed-tilt Solar PV Industry Volume Share (%), by Application 2025 & 2033
- Figure 35: Europe US Fixed-tilt Solar PV Industry Revenue (billion), by Country 2025 & 2033
- Figure 36: Europe US Fixed-tilt Solar PV Industry Volume (K Unit), by Country 2025 & 2033
- Figure 37: Europe US Fixed-tilt Solar PV Industry Revenue Share (%), by Country 2025 & 2033
- Figure 38: Europe US Fixed-tilt Solar PV Industry Volume Share (%), by Country 2025 & 2033
- Figure 39: Middle East & Africa US Fixed-tilt Solar PV Industry Revenue (billion), by Technology 2025 & 2033
- Figure 40: Middle East & Africa US Fixed-tilt Solar PV Industry Volume (K Unit), by Technology 2025 & 2033
- Figure 41: Middle East & Africa US Fixed-tilt Solar PV Industry Revenue Share (%), by Technology 2025 & 2033
- Figure 42: Middle East & Africa US Fixed-tilt Solar PV Industry Volume Share (%), by Technology 2025 & 2033
- Figure 43: Middle East & Africa US Fixed-tilt Solar PV Industry Revenue (billion), by Application 2025 & 2033
- Figure 44: Middle East & Africa US Fixed-tilt Solar PV Industry Volume (K Unit), by Application 2025 & 2033
- Figure 45: Middle East & Africa US Fixed-tilt Solar PV Industry Revenue Share (%), by Application 2025 & 2033
- Figure 46: Middle East & Africa US Fixed-tilt Solar PV Industry Volume Share (%), by Application 2025 & 2033
- Figure 47: Middle East & Africa US Fixed-tilt Solar PV Industry Revenue (billion), by Country 2025 & 2033
- Figure 48: Middle East & Africa US Fixed-tilt Solar PV Industry Volume (K Unit), by Country 2025 & 2033
- Figure 49: Middle East & Africa US Fixed-tilt Solar PV Industry Revenue Share (%), by Country 2025 & 2033
- Figure 50: Middle East & Africa US Fixed-tilt Solar PV Industry Volume Share (%), by Country 2025 & 2033
- Figure 51: Asia Pacific US Fixed-tilt Solar PV Industry Revenue (billion), by Technology 2025 & 2033
- Figure 52: Asia Pacific US Fixed-tilt Solar PV Industry Volume (K Unit), by Technology 2025 & 2033
- Figure 53: Asia Pacific US Fixed-tilt Solar PV Industry Revenue Share (%), by Technology 2025 & 2033
- Figure 54: Asia Pacific US Fixed-tilt Solar PV Industry Volume Share (%), by Technology 2025 & 2033
- Figure 55: Asia Pacific US Fixed-tilt Solar PV Industry Revenue (billion), by Application 2025 & 2033
- Figure 56: Asia Pacific US Fixed-tilt Solar PV Industry Volume (K Unit), by Application 2025 & 2033
- Figure 57: Asia Pacific US Fixed-tilt Solar PV Industry Revenue Share (%), by Application 2025 & 2033
- Figure 58: Asia Pacific US Fixed-tilt Solar PV Industry Volume Share (%), by Application 2025 & 2033
- Figure 59: Asia Pacific US Fixed-tilt Solar PV Industry Revenue (billion), by Country 2025 & 2033
- Figure 60: Asia Pacific US Fixed-tilt Solar PV Industry Volume (K Unit), by Country 2025 & 2033
- Figure 61: Asia Pacific US Fixed-tilt Solar PV Industry Revenue Share (%), by Country 2025 & 2033
- Figure 62: Asia Pacific US Fixed-tilt Solar PV Industry Volume Share (%), by Country 2025 & 2033
List of Tables
- Table 1: Global US Fixed-tilt Solar PV Industry Revenue billion Forecast, by Technology 2020 & 2033
- Table 2: Global US Fixed-tilt Solar PV Industry Volume K Unit Forecast, by Technology 2020 & 2033
- Table 3: Global US Fixed-tilt Solar PV Industry Revenue billion Forecast, by Application 2020 & 2033
- Table 4: Global US Fixed-tilt Solar PV Industry Volume K Unit Forecast, by Application 2020 & 2033
- Table 5: Global US Fixed-tilt Solar PV Industry Revenue billion Forecast, by Region 2020 & 2033
- Table 6: Global US Fixed-tilt Solar PV Industry Volume K Unit Forecast, by Region 2020 & 2033
- Table 7: Global US Fixed-tilt Solar PV Industry Revenue billion Forecast, by Technology 2020 & 2033
- Table 8: Global US Fixed-tilt Solar PV Industry Volume K Unit Forecast, by Technology 2020 & 2033
- Table 9: Global US Fixed-tilt Solar PV Industry Revenue billion Forecast, by Application 2020 & 2033
- Table 10: Global US Fixed-tilt Solar PV Industry Volume K Unit Forecast, by Application 2020 & 2033
- Table 11: Global US Fixed-tilt Solar PV Industry Revenue billion Forecast, by Country 2020 & 2033
- Table 12: Global US Fixed-tilt Solar PV Industry Volume K Unit Forecast, by Country 2020 & 2033
- Table 13: United States US Fixed-tilt Solar PV Industry Revenue (billion) Forecast, by Application 2020 & 2033
- Table 14: United States US Fixed-tilt Solar PV Industry Volume (K Unit) Forecast, by Application 2020 & 2033
- Table 15: Canada US Fixed-tilt Solar PV Industry Revenue (billion) Forecast, by Application 2020 & 2033
- Table 16: Canada US Fixed-tilt Solar PV Industry Volume (K Unit) Forecast, by Application 2020 & 2033
- Table 17: Mexico US Fixed-tilt Solar PV Industry Revenue (billion) Forecast, by Application 2020 & 2033
- Table 18: Mexico US Fixed-tilt Solar PV Industry Volume (K Unit) Forecast, by Application 2020 & 2033
- Table 19: Global US Fixed-tilt Solar PV Industry Revenue billion Forecast, by Technology 2020 & 2033
- Table 20: Global US Fixed-tilt Solar PV Industry Volume K Unit Forecast, by Technology 2020 & 2033
- Table 21: Global US Fixed-tilt Solar PV Industry Revenue billion Forecast, by Application 2020 & 2033
- Table 22: Global US Fixed-tilt Solar PV Industry Volume K Unit Forecast, by Application 2020 & 2033
- Table 23: Global US Fixed-tilt Solar PV Industry Revenue billion Forecast, by Country 2020 & 2033
- Table 24: Global US Fixed-tilt Solar PV Industry Volume K Unit Forecast, by Country 2020 & 2033
- Table 25: Brazil US Fixed-tilt Solar PV Industry Revenue (billion) Forecast, by Application 2020 & 2033
- Table 26: Brazil US Fixed-tilt Solar PV Industry Volume (K Unit) Forecast, by Application 2020 & 2033
- Table 27: Argentina US Fixed-tilt Solar PV Industry Revenue (billion) Forecast, by Application 2020 & 2033
- Table 28: Argentina US Fixed-tilt Solar PV Industry Volume (K Unit) Forecast, by Application 2020 & 2033
- Table 29: Rest of South America US Fixed-tilt Solar PV Industry Revenue (billion) Forecast, by Application 2020 & 2033
- Table 30: Rest of South America US Fixed-tilt Solar PV Industry Volume (K Unit) Forecast, by Application 2020 & 2033
- Table 31: Global US Fixed-tilt Solar PV Industry Revenue billion Forecast, by Technology 2020 & 2033
- Table 32: Global US Fixed-tilt Solar PV Industry Volume K Unit Forecast, by Technology 2020 & 2033
- Table 33: Global US Fixed-tilt Solar PV Industry Revenue billion Forecast, by Application 2020 & 2033
- Table 34: Global US Fixed-tilt Solar PV Industry Volume K Unit Forecast, by Application 2020 & 2033
- Table 35: Global US Fixed-tilt Solar PV Industry Revenue billion Forecast, by Country 2020 & 2033
- Table 36: Global US Fixed-tilt Solar PV Industry Volume K Unit Forecast, by Country 2020 & 2033
- Table 37: United Kingdom US Fixed-tilt Solar PV Industry Revenue (billion) Forecast, by Application 2020 & 2033
- Table 38: United Kingdom US Fixed-tilt Solar PV Industry Volume (K Unit) Forecast, by Application 2020 & 2033
- Table 39: Germany US Fixed-tilt Solar PV Industry Revenue (billion) Forecast, by Application 2020 & 2033
- Table 40: Germany US Fixed-tilt Solar PV Industry Volume (K Unit) Forecast, by Application 2020 & 2033
- Table 41: France US Fixed-tilt Solar PV Industry Revenue (billion) Forecast, by Application 2020 & 2033
- Table 42: France US Fixed-tilt Solar PV Industry Volume (K Unit) Forecast, by Application 2020 & 2033
- Table 43: Italy US Fixed-tilt Solar PV Industry Revenue (billion) Forecast, by Application 2020 & 2033
- Table 44: Italy US Fixed-tilt Solar PV Industry Volume (K Unit) Forecast, by Application 2020 & 2033
- Table 45: Spain US Fixed-tilt Solar PV Industry Revenue (billion) Forecast, by Application 2020 & 2033
- Table 46: Spain US Fixed-tilt Solar PV Industry Volume (K Unit) Forecast, by Application 2020 & 2033
- Table 47: Russia US Fixed-tilt Solar PV Industry Revenue (billion) Forecast, by Application 2020 & 2033
- Table 48: Russia US Fixed-tilt Solar PV Industry Volume (K Unit) Forecast, by Application 2020 & 2033
- Table 49: Benelux US Fixed-tilt Solar PV Industry Revenue (billion) Forecast, by Application 2020 & 2033
- Table 50: Benelux US Fixed-tilt Solar PV Industry Volume (K Unit) Forecast, by Application 2020 & 2033
- Table 51: Nordics US Fixed-tilt Solar PV Industry Revenue (billion) Forecast, by Application 2020 & 2033
- Table 52: Nordics US Fixed-tilt Solar PV Industry Volume (K Unit) Forecast, by Application 2020 & 2033
- Table 53: Rest of Europe US Fixed-tilt Solar PV Industry Revenue (billion) Forecast, by Application 2020 & 2033
- Table 54: Rest of Europe US Fixed-tilt Solar PV Industry Volume (K Unit) Forecast, by Application 2020 & 2033
- Table 55: Global US Fixed-tilt Solar PV Industry Revenue billion Forecast, by Technology 2020 & 2033
- Table 56: Global US Fixed-tilt Solar PV Industry Volume K Unit Forecast, by Technology 2020 & 2033
- Table 57: Global US Fixed-tilt Solar PV Industry Revenue billion Forecast, by Application 2020 & 2033
- Table 58: Global US Fixed-tilt Solar PV Industry Volume K Unit Forecast, by Application 2020 & 2033
- Table 59: Global US Fixed-tilt Solar PV Industry Revenue billion Forecast, by Country 2020 & 2033
- Table 60: Global US Fixed-tilt Solar PV Industry Volume K Unit Forecast, by Country 2020 & 2033
- Table 61: Turkey US Fixed-tilt Solar PV Industry Revenue (billion) Forecast, by Application 2020 & 2033
- Table 62: Turkey US Fixed-tilt Solar PV Industry Volume (K Unit) Forecast, by Application 2020 & 2033
- Table 63: Israel US Fixed-tilt Solar PV Industry Revenue (billion) Forecast, by Application 2020 & 2033
- Table 64: Israel US Fixed-tilt Solar PV Industry Volume (K Unit) Forecast, by Application 2020 & 2033
- Table 65: GCC US Fixed-tilt Solar PV Industry Revenue (billion) Forecast, by Application 2020 & 2033
- Table 66: GCC US Fixed-tilt Solar PV Industry Volume (K Unit) Forecast, by Application 2020 & 2033
- Table 67: North Africa US Fixed-tilt Solar PV Industry Revenue (billion) Forecast, by Application 2020 & 2033
- Table 68: North Africa US Fixed-tilt Solar PV Industry Volume (K Unit) Forecast, by Application 2020 & 2033
- Table 69: South Africa US Fixed-tilt Solar PV Industry Revenue (billion) Forecast, by Application 2020 & 2033
- Table 70: South Africa US Fixed-tilt Solar PV Industry Volume (K Unit) Forecast, by Application 2020 & 2033
- Table 71: Rest of Middle East & Africa US Fixed-tilt Solar PV Industry Revenue (billion) Forecast, by Application 2020 & 2033
- Table 72: Rest of Middle East & Africa US Fixed-tilt Solar PV Industry Volume (K Unit) Forecast, by Application 2020 & 2033
- Table 73: Global US Fixed-tilt Solar PV Industry Revenue billion Forecast, by Technology 2020 & 2033
- Table 74: Global US Fixed-tilt Solar PV Industry Volume K Unit Forecast, by Technology 2020 & 2033
- Table 75: Global US Fixed-tilt Solar PV Industry Revenue billion Forecast, by Application 2020 & 2033
- Table 76: Global US Fixed-tilt Solar PV Industry Volume K Unit Forecast, by Application 2020 & 2033
- Table 77: Global US Fixed-tilt Solar PV Industry Revenue billion Forecast, by Country 2020 & 2033
- Table 78: Global US Fixed-tilt Solar PV Industry Volume K Unit Forecast, by Country 2020 & 2033
- Table 79: China US Fixed-tilt Solar PV Industry Revenue (billion) Forecast, by Application 2020 & 2033
- Table 80: China US Fixed-tilt Solar PV Industry Volume (K Unit) Forecast, by Application 2020 & 2033
- Table 81: India US Fixed-tilt Solar PV Industry Revenue (billion) Forecast, by Application 2020 & 2033
- Table 82: India US Fixed-tilt Solar PV Industry Volume (K Unit) Forecast, by Application 2020 & 2033
- Table 83: Japan US Fixed-tilt Solar PV Industry Revenue (billion) Forecast, by Application 2020 & 2033
- Table 84: Japan US Fixed-tilt Solar PV Industry Volume (K Unit) Forecast, by Application 2020 & 2033
- Table 85: South Korea US Fixed-tilt Solar PV Industry Revenue (billion) Forecast, by Application 2020 & 2033
- Table 86: South Korea US Fixed-tilt Solar PV Industry Volume (K Unit) Forecast, by Application 2020 & 2033
- Table 87: ASEAN US Fixed-tilt Solar PV Industry Revenue (billion) Forecast, by Application 2020 & 2033
- Table 88: ASEAN US Fixed-tilt Solar PV Industry Volume (K Unit) Forecast, by Application 2020 & 2033
- Table 89: Oceania US Fixed-tilt Solar PV Industry Revenue (billion) Forecast, by Application 2020 & 2033
- Table 90: Oceania US Fixed-tilt Solar PV Industry Volume (K Unit) Forecast, by Application 2020 & 2033
- Table 91: Rest of Asia Pacific US Fixed-tilt Solar PV Industry Revenue (billion) Forecast, by Application 2020 & 2033
- Table 92: Rest of Asia Pacific US Fixed-tilt Solar PV Industry Volume (K Unit) Forecast, by Application 2020 & 2033
Frequently Asked Questions
1. What is the projected Compound Annual Growth Rate (CAGR) of the US Fixed-tilt Solar PV Industry?
The projected CAGR is approximately 7.22%.
2. Which companies are prominent players in the US Fixed-tilt Solar PV Industry?
Key companies in the market include First Solar Inc, Solar FlexRack, ENGIE SA, UNIRAC Inc *List Not Exhaustive, Canadian Solar Inc.
3. What are the main segments of the US Fixed-tilt Solar PV Industry?
The market segments include Technology, Application.
4. Can you provide details about the market size?
The market size is estimated to be USD 1.06 billion as of 2022.
5. What are some drivers contributing to market growth?
4.; Increasing Solar Energy Demand4.; Declining Cost of Solar PV Systems.
6. What are the notable trends driving market growth?
Thin Film Segment to Dominate the Market.
7. Are there any restraints impacting market growth?
4.; Strong Dependence on Prevailing Weather Condition.
8. Can you provide examples of recent developments in the market?
N/A
9. What pricing options are available for accessing the report?
Pricing options include single-user, multi-user, and enterprise licenses priced at USD 3800, USD 4500, and USD 5800 respectively.
10. Is the market size provided in terms of value or volume?
The market size is provided in terms of value, measured in billion and volume, measured in K Unit.
11. Are there any specific market keywords associated with the report?
Yes, the market keyword associated with the report is "US Fixed-tilt Solar PV Industry," which aids in identifying and referencing the specific market segment covered.
12. How do I determine which pricing option suits my needs best?
The pricing options vary based on user requirements and access needs. Individual users may opt for single-user licenses, while businesses requiring broader access may choose multi-user or enterprise licenses for cost-effective access to the report.
13. Are there any additional resources or data provided in the US Fixed-tilt Solar PV Industry report?
While the report offers comprehensive insights, it's advisable to review the specific contents or supplementary materials provided to ascertain if additional resources or data are available.
14. How can I stay updated on further developments or reports in the US Fixed-tilt Solar PV Industry?
To stay informed about further developments, trends, and reports in the US Fixed-tilt Solar PV Industry, consider subscribing to industry newsletters, following relevant companies and organizations, or regularly checking reputable industry news sources and publications.
Methodology
Step 1 - Identification of Relevant Samples Size from Population Database


Step 2 - Approaches for Defining Global Market Size (Value, Volume* & Price*)

Note*: In applicable scenarios
Step 3 - Data Sources
Primary Research
- Web Analytics
- Survey Reports
- Research Institute
- Latest Research Reports
- Opinion Leaders
Secondary Research
- Annual Reports
- White Paper
- Latest Press Release
- Industry Association
- Paid Database
- Investor Presentations

Step 4 - Data Triangulation
Involves using different sources of information in order to increase the validity of a study
These sources are likely to be stakeholders in a program - participants, other researchers, program staff, other community members, and so on.
Then we put all data in single framework & apply various statistical tools to find out the dynamic on the market.
During the analysis stage, feedback from the stakeholder groups would be compared to determine areas of agreement as well as areas of divergence