

Key Insights
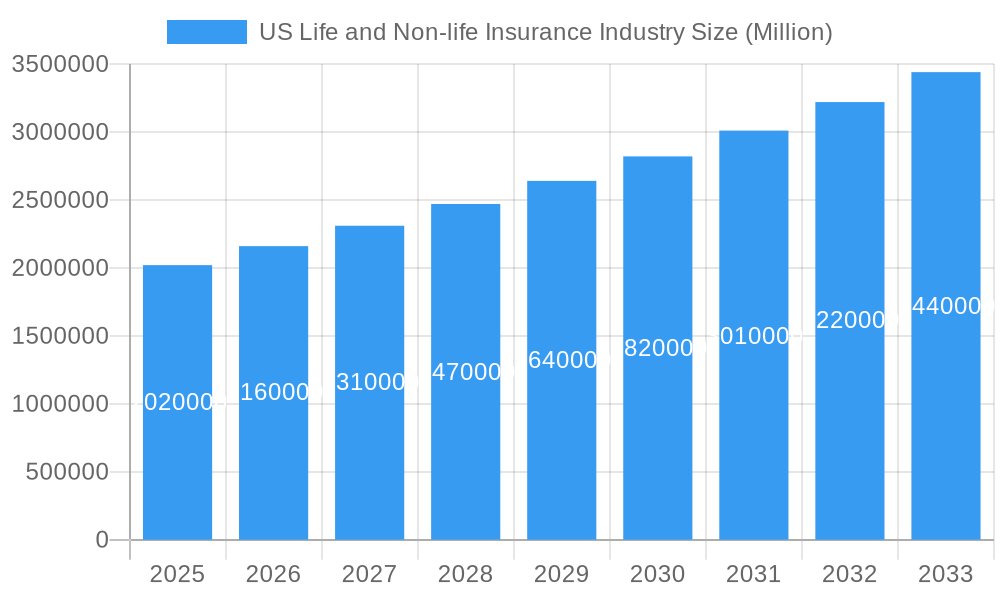
The US life and non-life insurance market, currently valued at approximately $2.02 trillion (2025 estimated), is projected to experience robust growth, driven by several key factors. An aging population, increasing health consciousness, and rising disposable incomes are fueling demand for life insurance products. Simultaneously, the growing prevalence of catastrophic events and cybersecurity threats are boosting the demand for non-life insurance, encompassing property, casualty, and liability coverage. Technological advancements, such as AI-powered risk assessment and digital distribution channels, are reshaping the industry landscape, creating efficiency gains and improving customer experiences. However, stringent regulatory frameworks and increasing competition from insurtech companies pose challenges to established players. The market is segmented by product type (life insurance, health insurance, property and casualty insurance, etc.), distribution channels (online, agents, brokers), and customer demographics (age, income, location). Major players like Massachusetts Mutual Life Insurance Company, UnitedHealth Group, Berkshire Hathaway, and others, are continuously adapting their strategies to leverage emerging technologies and cater to evolving customer needs. The market's competitive intensity necessitates innovation in product design, customer service, and risk management to maintain profitability and market share.
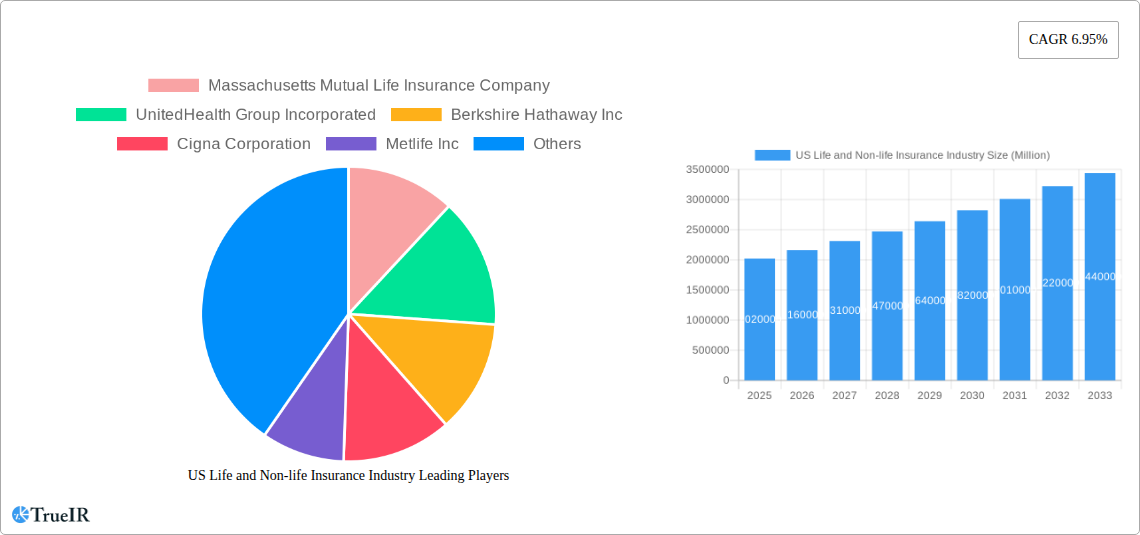
US Life and Non-life Insurance Industry Market Size (In Million)
The forecast period (2025-2033) anticipates a Compound Annual Growth Rate (CAGR) of 6.95%, suggesting a substantial market expansion. This growth will be influenced by the increasing adoption of personalized insurance solutions, the expanding utilization of telematics for risk assessment in non-life insurance, and ongoing efforts to improve financial literacy among the population. Nevertheless, challenges remain including inflation, economic volatility, and maintaining consumer confidence in the industry's ability to adequately cover potential risks. Successful insurers will be those that strategically invest in data analytics, enhance customer engagement, and effectively manage risk within the evolving regulatory environment. The projected market size for 2033, based on the provided CAGR and 2025 value, indicates a significant expansion of the overall insurance sector in the United States.
US Life and Non-life Insurance Industry Company Market Share
This comprehensive report provides a detailed analysis of the US Life and Non-life Insurance industry, offering invaluable insights for investors, industry professionals, and strategic decision-makers. Covering the period from 2019 to 2033, with a focus on 2025, this report leverages extensive data analysis and expert insights to forecast market trends and growth opportunities. We delve into market structure, competitive dynamics, dominant segments, technological advancements, and key challenges impacting industry growth.
US Life and Non-life Insurance Industry Market Structure & Competitive Landscape
This section analyzes the market concentration, innovation drivers, regulatory impacts, product substitutes, end-user segmentation, and M&A trends within the US Life and Non-life Insurance industry. The market exhibits a moderately concentrated structure, with a Herfindahl-Hirschman Index (HHI) estimated at xx in 2024. Key players such as Berkshire Hathaway Inc, UnitedHealth Group Incorporated, and Metlife Inc hold significant market share. However, the landscape is dynamic, influenced by ongoing M&A activity and the emergence of Insurtech companies. The total M&A volume in the sector from 2019 to 2024 reached an estimated USD xx million, indicating a trend toward consolidation.
- Market Concentration: Moderately concentrated, with a HHI of xx in 2024.
- Innovation Drivers: Technological advancements (AI, big data, blockchain) and evolving consumer preferences.
- Regulatory Impacts: Stringent regulations impacting pricing, product offerings, and data privacy.
- Product Substitutes: Limited direct substitutes, but alternative risk management strategies exist.
- End-User Segmentation: Diverse, encompassing individuals, businesses, and government entities.
- M&A Trends: Significant M&A activity driving consolidation and market share shifts.
US Life and Non-life Insurance Industry Market Trends & Opportunities
The US Life and Non-life Insurance market is projected to experience a Compound Annual Growth Rate (CAGR) of xx% during the forecast period (2025-2033). Market size is estimated at USD xx million in 2025, and is expected to reach USD xx million by 2033. This growth is fueled by several key trends, including rising healthcare costs, increasing demand for retirement planning solutions, growing adoption of digital channels, and the expanding use of telematics in auto insurance. Market penetration rates vary significantly across segments, with higher penetration observed in life insurance compared to certain niche non-life segments. Competitive dynamics are shaped by pricing pressures, technological innovations, and regulatory changes. Significant opportunities lie in leveraging technology to improve efficiency, personalize products, and enhance customer experience.
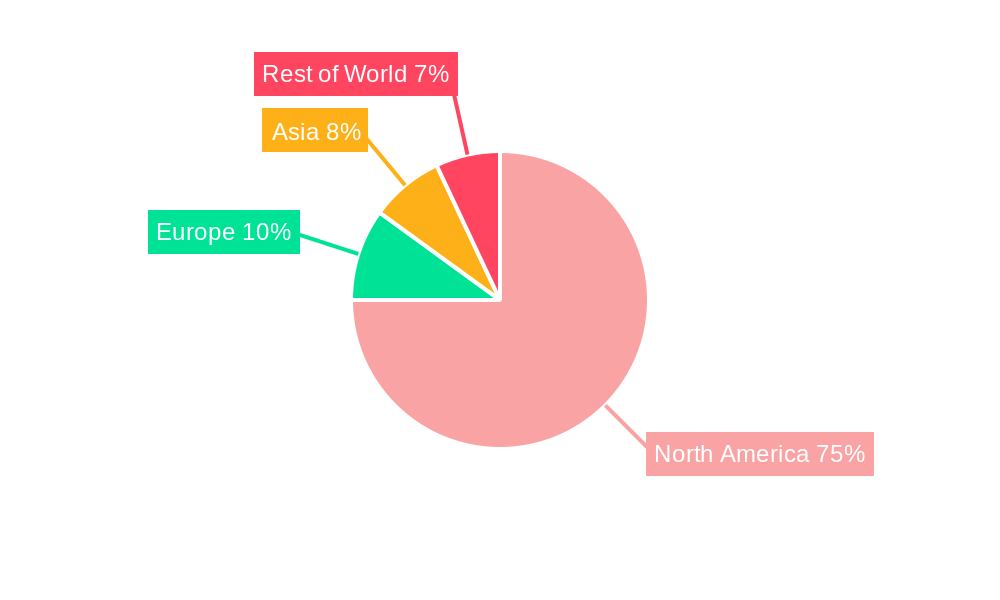
Dominant Markets & Segments in US Life and Non-life Insurance Industry
The US Life and Non-life Insurance industry exhibits regional variations in growth rates and market penetration. The largest segment by revenue is Life Insurance, with a market share of approximately xx% in 2024.
- Key Growth Drivers in Life Insurance: Aging population, rising awareness of life insurance needs, and favorable regulatory environment.
- Key Growth Drivers in Non-Life Insurance (e.g., Health): Increasing healthcare expenditures and government initiatives promoting health insurance coverage.
Detailed analysis reveals that the South-Eastern region exhibits the highest growth potential due to factors such as a rapidly expanding population and increased disposable income. However, the Western region maintains a significant market share driven by a strong economy and high levels of insurance penetration.
US Life and Non-life Insurance Industry Product Analysis
Product innovation is driven by technological advancements and evolving consumer needs. The industry is witnessing the adoption of AI-powered risk assessment tools, personalized insurance products, and digital distribution channels. Telematics in auto insurance and wearable technology in health insurance are reshaping product offerings, enhancing risk management, and improving customer experience. These advancements contribute to enhanced product offerings that better address individual needs and are driving increased market competitiveness.
Key Drivers, Barriers & Challenges in US Life and Non-life Insurance Industry
Key Drivers: Technological advancements (AI, machine learning), increased health consciousness, favorable regulatory environment in certain segments, and rising disposable incomes.
Challenges: Stringent regulations, increasing competition from Insurtech companies, cybersecurity threats, and the need for adapting to evolving consumer preferences. These factors collectively present a complex challenge to sustained market growth and profitability. For instance, regulatory changes related to data privacy could impose significant compliance costs and potentially limit product innovation. The estimated cost of compliance with the newly proposed regulations is projected to reach USD xx million by 2028.
Growth Drivers in the US Life and Non-life Insurance Industry Market
The growth of the US Life and Non-life Insurance industry is primarily driven by technological advancements, economic factors, and supportive regulatory policies. AI, machine learning, and big data analytics are enhancing risk assessment, claims processing, and customer service. Furthermore, a growing awareness of the importance of financial security and health insurance is increasing demand across segments.
Challenges Impacting US Life and Non-life Insurance Industry Growth
Challenges to industry growth include stringent regulatory requirements, intense competition (especially from Insurtechs), and the escalating costs of compliance. Economic downturns can impact consumer spending on insurance products, while supply chain disruptions can affect the delivery of services. These factors can collectively limit the market's growth trajectory and the profitability of individual players.
Key Players Shaping the US Life and Non-life Insurance Industry Market
Significant US Life and Non-life Insurance Industry Milestones
- 2021: Cigna introduced its Cigna ID card, enhancing client access to in-network doctors, care, and cost estimates.
- 2022: UnitedHealth Group invested USD 100 million in health worker diversity, advancing health equity and improving access to care.
Future Outlook for US Life and Non-life Insurance Industry Market
The US Life and Non-life Insurance industry is poised for continued growth, driven by technological innovation, evolving consumer preferences, and favorable regulatory developments in specific segments. Opportunities abound for companies that can leverage data analytics, personalize products, and offer seamless digital experiences. The market’s future success hinges on the ability of companies to navigate regulatory complexities and adapt to the evolving competitive landscape.
US Life and Non-life Insurance Industry Segmentation
-
1. Insurance type
-
1.1. Life Insurance
- 1.1.1. Individual
- 1.1.2. Group
-
1.2. Non-life Insurance
- 1.2.1. Home
- 1.2.2. Motor
- 1.2.3. Other Non-life Insurances
-
1.1. Life Insurance
-
2. Distribution Channel
- 2.1. Direct
- 2.2. Agency
- 2.3. Banks
- 2.4. Other Distribution Channels
US Life and Non-life Insurance Industry Segmentation By Geography
-
1. North America
- 1.1. United States
- 1.2. Canada
- 1.3. Mexico
-
2. South America
- 2.1. Brazil
- 2.2. Argentina
- 2.3. Rest of South America
-
3. Europe
- 3.1. United Kingdom
- 3.2. Germany
- 3.3. France
- 3.4. Italy
- 3.5. Spain
- 3.6. Russia
- 3.7. Benelux
- 3.8. Nordics
- 3.9. Rest of Europe
-
4. Middle East & Africa
- 4.1. Turkey
- 4.2. Israel
- 4.3. GCC
- 4.4. North Africa
- 4.5. South Africa
- 4.6. Rest of Middle East & Africa
-
5. Asia Pacific
- 5.1. China
- 5.2. India
- 5.3. Japan
- 5.4. South Korea
- 5.5. ASEAN
- 5.6. Oceania
- 5.7. Rest of Asia Pacific
US Life and Non-life Insurance Industry Regional Market Share
Geographic Coverage of US Life and Non-life Insurance Industry
US Life and Non-life Insurance Industry REPORT HIGHLIGHTS
| Aspects | Details |
|---|---|
| Study Period | 2020-2034 |
| Base Year | 2025 |
| Estimated Year | 2026 |
| Forecast Period | 2026-2034 |
| Historical Period | 2020-2025 |
| Growth Rate | CAGR of 6.95% from 2020-2034 |
| Segmentation |
|
Table of Contents
- 1. Introduction
- 1.1. Research Scope
- 1.2. Market Segmentation
- 1.3. Research Objective
- 1.4. Definitions and Assumptions
- 2. Executive Summary
- 2.1. Market Snapshot
- 3. Market Dynamics
- 3.1. Market Drivers
- 3.2. Market Restrains
- 3.3. Market Trends
- 3.4. Market Opportunities
- 4. Market Factor Analysis
- 4.1. Porters Five Forces
- 4.1.1. Bargaining Power of Suppliers
- 4.1.2. Bargaining Power of Buyers
- 4.1.3. Threat of New Entrants
- 4.1.4. Threat of Substitutes
- 4.1.5. Competitive Rivalry
- 4.2. PESTEL analysis
- 4.3. BCG Analysis
- 4.3.1. Stars (High Growth, High Market Share)
- 4.3.2. Cash Cows (Low Growth, High Market Share)
- 4.3.3. Question Mark (High Growth, Low Market Share)
- 4.3.4. Dogs (Low Growth, Low Market Share)
- 4.4. Ansoff Matrix Analysis
- 4.5. Supply Chain Analysis
- 4.6. Regulatory Landscape
- 4.7. Current Market Potential and Opportunity Assessment (TAM–SAM–SOM Framework)
- 4.8. TIR Analyst Note
- 4.1. Porters Five Forces
- 5. Market Analysis, Insights and Forecast 2021-2033
- 5.1. Market Analysis, Insights and Forecast - by Insurance type
- 5.1.1. Life Insurance
- 5.1.1.1. Individual
- 5.1.1.2. Group
- 5.1.2. Non-life Insurance
- 5.1.2.1. Home
- 5.1.2.2. Motor
- 5.1.2.3. Other Non-life Insurances
- 5.1.1. Life Insurance
- 5.2. Market Analysis, Insights and Forecast - by Distribution Channel
- 5.2.1. Direct
- 5.2.2. Agency
- 5.2.3. Banks
- 5.2.4. Other Distribution Channels
- 5.3. Market Analysis, Insights and Forecast - by Region
- 5.3.1. North America
- 5.3.2. South America
- 5.3.3. Europe
- 5.3.4. Middle East & Africa
- 5.3.5. Asia Pacific
- 5.1. Market Analysis, Insights and Forecast - by Insurance type
- 6. Global US Life and Non-life Insurance Industry Analysis, Insights and Forecast, 2021-2033
- 6.1. Market Analysis, Insights and Forecast - by Insurance type
- 6.1.1. Life Insurance
- 6.1.1.1. Individual
- 6.1.1.2. Group
- 6.1.2. Non-life Insurance
- 6.1.2.1. Home
- 6.1.2.2. Motor
- 6.1.2.3. Other Non-life Insurances
- 6.1.1. Life Insurance
- 6.2. Market Analysis, Insights and Forecast - by Distribution Channel
- 6.2.1. Direct
- 6.2.2. Agency
- 6.2.3. Banks
- 6.2.4. Other Distribution Channels
- 6.1. Market Analysis, Insights and Forecast - by Insurance type
- 7. North America US Life and Non-life Insurance Industry Analysis, Insights and Forecast, 2020-2032
- 7.1. Market Analysis, Insights and Forecast - by Insurance type
- 7.1.1. Life Insurance
- 7.1.1.1. Individual
- 7.1.1.2. Group
- 7.1.2. Non-life Insurance
- 7.1.2.1. Home
- 7.1.2.2. Motor
- 7.1.2.3. Other Non-life Insurances
- 7.1.1. Life Insurance
- 7.2. Market Analysis, Insights and Forecast - by Distribution Channel
- 7.2.1. Direct
- 7.2.2. Agency
- 7.2.3. Banks
- 7.2.4. Other Distribution Channels
- 7.1. Market Analysis, Insights and Forecast - by Insurance type
- 8. South America US Life and Non-life Insurance Industry Analysis, Insights and Forecast, 2020-2032
- 8.1. Market Analysis, Insights and Forecast - by Insurance type
- 8.1.1. Life Insurance
- 8.1.1.1. Individual
- 8.1.1.2. Group
- 8.1.2. Non-life Insurance
- 8.1.2.1. Home
- 8.1.2.2. Motor
- 8.1.2.3. Other Non-life Insurances
- 8.1.1. Life Insurance
- 8.2. Market Analysis, Insights and Forecast - by Distribution Channel
- 8.2.1. Direct
- 8.2.2. Agency
- 8.2.3. Banks
- 8.2.4. Other Distribution Channels
- 8.1. Market Analysis, Insights and Forecast - by Insurance type
- 9. Europe US Life and Non-life Insurance Industry Analysis, Insights and Forecast, 2020-2032
- 9.1. Market Analysis, Insights and Forecast - by Insurance type
- 9.1.1. Life Insurance
- 9.1.1.1. Individual
- 9.1.1.2. Group
- 9.1.2. Non-life Insurance
- 9.1.2.1. Home
- 9.1.2.2. Motor
- 9.1.2.3. Other Non-life Insurances
- 9.1.1. Life Insurance
- 9.2. Market Analysis, Insights and Forecast - by Distribution Channel
- 9.2.1. Direct
- 9.2.2. Agency
- 9.2.3. Banks
- 9.2.4. Other Distribution Channels
- 9.1. Market Analysis, Insights and Forecast - by Insurance type
- 10. Middle East & Africa US Life and Non-life Insurance Industry Analysis, Insights and Forecast, 2020-2032
- 10.1. Market Analysis, Insights and Forecast - by Insurance type
- 10.1.1. Life Insurance
- 10.1.1.1. Individual
- 10.1.1.2. Group
- 10.1.2. Non-life Insurance
- 10.1.2.1. Home
- 10.1.2.2. Motor
- 10.1.2.3. Other Non-life Insurances
- 10.1.1. Life Insurance
- 10.2. Market Analysis, Insights and Forecast - by Distribution Channel
- 10.2.1. Direct
- 10.2.2. Agency
- 10.2.3. Banks
- 10.2.4. Other Distribution Channels
- 10.1. Market Analysis, Insights and Forecast - by Insurance type
- 11. Asia Pacific US Life and Non-life Insurance Industry Analysis, Insights and Forecast, 2020-2032
- 11.1. Market Analysis, Insights and Forecast - by Insurance type
- 11.1.1. Life Insurance
- 11.1.1.1. Individual
- 11.1.1.2. Group
- 11.1.2. Non-life Insurance
- 11.1.2.1. Home
- 11.1.2.2. Motor
- 11.1.2.3. Other Non-life Insurances
- 11.1.1. Life Insurance
- 11.2. Market Analysis, Insights and Forecast - by Distribution Channel
- 11.2.1. Direct
- 11.2.2. Agency
- 11.2.3. Banks
- 11.2.4. Other Distribution Channels
- 11.1. Market Analysis, Insights and Forecast - by Insurance type
- 12. Competitive Analysis
- 12.1. Company Profiles
- 12.1.1 Massachusetts Mutual Life Insurance Company
- 12.1.1.1. Company Overview
- 12.1.1.2. Products
- 12.1.1.3. Company Financials
- 12.1.1.4. SWOT Analysis
- 12.1.2 UnitedHealth Group Incorporated
- 12.1.2.1. Company Overview
- 12.1.2.2. Products
- 12.1.2.3. Company Financials
- 12.1.2.4. SWOT Analysis
- 12.1.3 Berkshire Hathaway Inc
- 12.1.3.1. Company Overview
- 12.1.3.2. Products
- 12.1.3.3. Company Financials
- 12.1.3.4. SWOT Analysis
- 12.1.4 Cigna Corporation
- 12.1.4.1. Company Overview
- 12.1.4.2. Products
- 12.1.4.3. Company Financials
- 12.1.4.4. SWOT Analysis
- 12.1.5 Metlife Inc
- 12.1.5.1. Company Overview
- 12.1.5.2. Products
- 12.1.5.3. Company Financials
- 12.1.5.4. SWOT Analysis
- 12.1.6 Prudential Financial Inc
- 12.1.6.1. Company Overview
- 12.1.6.2. Products
- 12.1.6.3. Company Financials
- 12.1.6.4. SWOT Analysis
- 12.1.7 Aetna Inc
- 12.1.7.1. Company Overview
- 12.1.7.2. Products
- 12.1.7.3. Company Financials
- 12.1.7.4. SWOT Analysis
- 12.1.8 Centene Corporation
- 12.1.8.1. Company Overview
- 12.1.8.2. Products
- 12.1.8.3. Company Financials
- 12.1.8.4. SWOT Analysis
- 12.1.9 American International Group Inc
- 12.1.9.1. Company Overview
- 12.1.9.2. Products
- 12.1.9.3. Company Financials
- 12.1.9.4. SWOT Analysis
- 12.1.10 State Farm**List Not Exhaustive
- 12.1.10.1. Company Overview
- 12.1.10.2. Products
- 12.1.10.3. Company Financials
- 12.1.10.4. SWOT Analysis
- 12.1.1 Massachusetts Mutual Life Insurance Company
- 12.2. Market Entropy
- 12.2.1 Company's Key Areas Served
- 12.2.2 Recent Developments
- 12.3. Company Market Share Analysis 2025
- 12.3.1 Top 5 Companies Market Share Analysis
- 12.3.2 Top 3 Companies Market Share Analysis
- 12.4. List of Potential Customers
- 13. Research Methodology
List of Figures
- Figure 1: Global US Life and Non-life Insurance Industry Revenue Breakdown (Million, %) by Region 2025 & 2033
- Figure 2: Global US Life and Non-life Insurance Industry Volume Breakdown (Trillion, %) by Region 2025 & 2033
- Figure 3: North America US Life and Non-life Insurance Industry Revenue (Million), by Insurance type 2025 & 2033
- Figure 4: North America US Life and Non-life Insurance Industry Volume (Trillion), by Insurance type 2025 & 2033
- Figure 5: North America US Life and Non-life Insurance Industry Revenue Share (%), by Insurance type 2025 & 2033
- Figure 6: North America US Life and Non-life Insurance Industry Volume Share (%), by Insurance type 2025 & 2033
- Figure 7: North America US Life and Non-life Insurance Industry Revenue (Million), by Distribution Channel 2025 & 2033
- Figure 8: North America US Life and Non-life Insurance Industry Volume (Trillion), by Distribution Channel 2025 & 2033
- Figure 9: North America US Life and Non-life Insurance Industry Revenue Share (%), by Distribution Channel 2025 & 2033
- Figure 10: North America US Life and Non-life Insurance Industry Volume Share (%), by Distribution Channel 2025 & 2033
- Figure 11: North America US Life and Non-life Insurance Industry Revenue (Million), by Country 2025 & 2033
- Figure 12: North America US Life and Non-life Insurance Industry Volume (Trillion), by Country 2025 & 2033
- Figure 13: North America US Life and Non-life Insurance Industry Revenue Share (%), by Country 2025 & 2033
- Figure 14: North America US Life and Non-life Insurance Industry Volume Share (%), by Country 2025 & 2033
- Figure 15: South America US Life and Non-life Insurance Industry Revenue (Million), by Insurance type 2025 & 2033
- Figure 16: South America US Life and Non-life Insurance Industry Volume (Trillion), by Insurance type 2025 & 2033
- Figure 17: South America US Life and Non-life Insurance Industry Revenue Share (%), by Insurance type 2025 & 2033
- Figure 18: South America US Life and Non-life Insurance Industry Volume Share (%), by Insurance type 2025 & 2033
- Figure 19: South America US Life and Non-life Insurance Industry Revenue (Million), by Distribution Channel 2025 & 2033
- Figure 20: South America US Life and Non-life Insurance Industry Volume (Trillion), by Distribution Channel 2025 & 2033
- Figure 21: South America US Life and Non-life Insurance Industry Revenue Share (%), by Distribution Channel 2025 & 2033
- Figure 22: South America US Life and Non-life Insurance Industry Volume Share (%), by Distribution Channel 2025 & 2033
- Figure 23: South America US Life and Non-life Insurance Industry Revenue (Million), by Country 2025 & 2033
- Figure 24: South America US Life and Non-life Insurance Industry Volume (Trillion), by Country 2025 & 2033
- Figure 25: South America US Life and Non-life Insurance Industry Revenue Share (%), by Country 2025 & 2033
- Figure 26: South America US Life and Non-life Insurance Industry Volume Share (%), by Country 2025 & 2033
- Figure 27: Europe US Life and Non-life Insurance Industry Revenue (Million), by Insurance type 2025 & 2033
- Figure 28: Europe US Life and Non-life Insurance Industry Volume (Trillion), by Insurance type 2025 & 2033
- Figure 29: Europe US Life and Non-life Insurance Industry Revenue Share (%), by Insurance type 2025 & 2033
- Figure 30: Europe US Life and Non-life Insurance Industry Volume Share (%), by Insurance type 2025 & 2033
- Figure 31: Europe US Life and Non-life Insurance Industry Revenue (Million), by Distribution Channel 2025 & 2033
- Figure 32: Europe US Life and Non-life Insurance Industry Volume (Trillion), by Distribution Channel 2025 & 2033
- Figure 33: Europe US Life and Non-life Insurance Industry Revenue Share (%), by Distribution Channel 2025 & 2033
- Figure 34: Europe US Life and Non-life Insurance Industry Volume Share (%), by Distribution Channel 2025 & 2033
- Figure 35: Europe US Life and Non-life Insurance Industry Revenue (Million), by Country 2025 & 2033
- Figure 36: Europe US Life and Non-life Insurance Industry Volume (Trillion), by Country 2025 & 2033
- Figure 37: Europe US Life and Non-life Insurance Industry Revenue Share (%), by Country 2025 & 2033
- Figure 38: Europe US Life and Non-life Insurance Industry Volume Share (%), by Country 2025 & 2033
- Figure 39: Middle East & Africa US Life and Non-life Insurance Industry Revenue (Million), by Insurance type 2025 & 2033
- Figure 40: Middle East & Africa US Life and Non-life Insurance Industry Volume (Trillion), by Insurance type 2025 & 2033
- Figure 41: Middle East & Africa US Life and Non-life Insurance Industry Revenue Share (%), by Insurance type 2025 & 2033
- Figure 42: Middle East & Africa US Life and Non-life Insurance Industry Volume Share (%), by Insurance type 2025 & 2033
- Figure 43: Middle East & Africa US Life and Non-life Insurance Industry Revenue (Million), by Distribution Channel 2025 & 2033
- Figure 44: Middle East & Africa US Life and Non-life Insurance Industry Volume (Trillion), by Distribution Channel 2025 & 2033
- Figure 45: Middle East & Africa US Life and Non-life Insurance Industry Revenue Share (%), by Distribution Channel 2025 & 2033
- Figure 46: Middle East & Africa US Life and Non-life Insurance Industry Volume Share (%), by Distribution Channel 2025 & 2033
- Figure 47: Middle East & Africa US Life and Non-life Insurance Industry Revenue (Million), by Country 2025 & 2033
- Figure 48: Middle East & Africa US Life and Non-life Insurance Industry Volume (Trillion), by Country 2025 & 2033
- Figure 49: Middle East & Africa US Life and Non-life Insurance Industry Revenue Share (%), by Country 2025 & 2033
- Figure 50: Middle East & Africa US Life and Non-life Insurance Industry Volume Share (%), by Country 2025 & 2033
- Figure 51: Asia Pacific US Life and Non-life Insurance Industry Revenue (Million), by Insurance type 2025 & 2033
- Figure 52: Asia Pacific US Life and Non-life Insurance Industry Volume (Trillion), by Insurance type 2025 & 2033
- Figure 53: Asia Pacific US Life and Non-life Insurance Industry Revenue Share (%), by Insurance type 2025 & 2033
- Figure 54: Asia Pacific US Life and Non-life Insurance Industry Volume Share (%), by Insurance type 2025 & 2033
- Figure 55: Asia Pacific US Life and Non-life Insurance Industry Revenue (Million), by Distribution Channel 2025 & 2033
- Figure 56: Asia Pacific US Life and Non-life Insurance Industry Volume (Trillion), by Distribution Channel 2025 & 2033
- Figure 57: Asia Pacific US Life and Non-life Insurance Industry Revenue Share (%), by Distribution Channel 2025 & 2033
- Figure 58: Asia Pacific US Life and Non-life Insurance Industry Volume Share (%), by Distribution Channel 2025 & 2033
- Figure 59: Asia Pacific US Life and Non-life Insurance Industry Revenue (Million), by Country 2025 & 2033
- Figure 60: Asia Pacific US Life and Non-life Insurance Industry Volume (Trillion), by Country 2025 & 2033
- Figure 61: Asia Pacific US Life and Non-life Insurance Industry Revenue Share (%), by Country 2025 & 2033
- Figure 62: Asia Pacific US Life and Non-life Insurance Industry Volume Share (%), by Country 2025 & 2033
List of Tables
- Table 1: Global US Life and Non-life Insurance Industry Revenue Million Forecast, by Insurance type 2020 & 2033
- Table 2: Global US Life and Non-life Insurance Industry Volume Trillion Forecast, by Insurance type 2020 & 2033
- Table 3: Global US Life and Non-life Insurance Industry Revenue Million Forecast, by Distribution Channel 2020 & 2033
- Table 4: Global US Life and Non-life Insurance Industry Volume Trillion Forecast, by Distribution Channel 2020 & 2033
- Table 5: Global US Life and Non-life Insurance Industry Revenue Million Forecast, by Region 2020 & 2033
- Table 6: Global US Life and Non-life Insurance Industry Volume Trillion Forecast, by Region 2020 & 2033
- Table 7: Global US Life and Non-life Insurance Industry Revenue Million Forecast, by Insurance type 2020 & 2033
- Table 8: Global US Life and Non-life Insurance Industry Volume Trillion Forecast, by Insurance type 2020 & 2033
- Table 9: Global US Life and Non-life Insurance Industry Revenue Million Forecast, by Distribution Channel 2020 & 2033
- Table 10: Global US Life and Non-life Insurance Industry Volume Trillion Forecast, by Distribution Channel 2020 & 2033
- Table 11: Global US Life and Non-life Insurance Industry Revenue Million Forecast, by Country 2020 & 2033
- Table 12: Global US Life and Non-life Insurance Industry Volume Trillion Forecast, by Country 2020 & 2033
- Table 13: United States US Life and Non-life Insurance Industry Revenue (Million) Forecast, by Application 2020 & 2033
- Table 14: United States US Life and Non-life Insurance Industry Volume (Trillion) Forecast, by Application 2020 & 2033
- Table 15: Canada US Life and Non-life Insurance Industry Revenue (Million) Forecast, by Application 2020 & 2033
- Table 16: Canada US Life and Non-life Insurance Industry Volume (Trillion) Forecast, by Application 2020 & 2033
- Table 17: Mexico US Life and Non-life Insurance Industry Revenue (Million) Forecast, by Application 2020 & 2033
- Table 18: Mexico US Life and Non-life Insurance Industry Volume (Trillion) Forecast, by Application 2020 & 2033
- Table 19: Global US Life and Non-life Insurance Industry Revenue Million Forecast, by Insurance type 2020 & 2033
- Table 20: Global US Life and Non-life Insurance Industry Volume Trillion Forecast, by Insurance type 2020 & 2033
- Table 21: Global US Life and Non-life Insurance Industry Revenue Million Forecast, by Distribution Channel 2020 & 2033
- Table 22: Global US Life and Non-life Insurance Industry Volume Trillion Forecast, by Distribution Channel 2020 & 2033
- Table 23: Global US Life and Non-life Insurance Industry Revenue Million Forecast, by Country 2020 & 2033
- Table 24: Global US Life and Non-life Insurance Industry Volume Trillion Forecast, by Country 2020 & 2033
- Table 25: Brazil US Life and Non-life Insurance Industry Revenue (Million) Forecast, by Application 2020 & 2033
- Table 26: Brazil US Life and Non-life Insurance Industry Volume (Trillion) Forecast, by Application 2020 & 2033
- Table 27: Argentina US Life and Non-life Insurance Industry Revenue (Million) Forecast, by Application 2020 & 2033
- Table 28: Argentina US Life and Non-life Insurance Industry Volume (Trillion) Forecast, by Application 2020 & 2033
- Table 29: Rest of South America US Life and Non-life Insurance Industry Revenue (Million) Forecast, by Application 2020 & 2033
- Table 30: Rest of South America US Life and Non-life Insurance Industry Volume (Trillion) Forecast, by Application 2020 & 2033
- Table 31: Global US Life and Non-life Insurance Industry Revenue Million Forecast, by Insurance type 2020 & 2033
- Table 32: Global US Life and Non-life Insurance Industry Volume Trillion Forecast, by Insurance type 2020 & 2033
- Table 33: Global US Life and Non-life Insurance Industry Revenue Million Forecast, by Distribution Channel 2020 & 2033
- Table 34: Global US Life and Non-life Insurance Industry Volume Trillion Forecast, by Distribution Channel 2020 & 2033
- Table 35: Global US Life and Non-life Insurance Industry Revenue Million Forecast, by Country 2020 & 2033
- Table 36: Global US Life and Non-life Insurance Industry Volume Trillion Forecast, by Country 2020 & 2033
- Table 37: United Kingdom US Life and Non-life Insurance Industry Revenue (Million) Forecast, by Application 2020 & 2033
- Table 38: United Kingdom US Life and Non-life Insurance Industry Volume (Trillion) Forecast, by Application 2020 & 2033
- Table 39: Germany US Life and Non-life Insurance Industry Revenue (Million) Forecast, by Application 2020 & 2033
- Table 40: Germany US Life and Non-life Insurance Industry Volume (Trillion) Forecast, by Application 2020 & 2033
- Table 41: France US Life and Non-life Insurance Industry Revenue (Million) Forecast, by Application 2020 & 2033
- Table 42: France US Life and Non-life Insurance Industry Volume (Trillion) Forecast, by Application 2020 & 2033
- Table 43: Italy US Life and Non-life Insurance Industry Revenue (Million) Forecast, by Application 2020 & 2033
- Table 44: Italy US Life and Non-life Insurance Industry Volume (Trillion) Forecast, by Application 2020 & 2033
- Table 45: Spain US Life and Non-life Insurance Industry Revenue (Million) Forecast, by Application 2020 & 2033
- Table 46: Spain US Life and Non-life Insurance Industry Volume (Trillion) Forecast, by Application 2020 & 2033
- Table 47: Russia US Life and Non-life Insurance Industry Revenue (Million) Forecast, by Application 2020 & 2033
- Table 48: Russia US Life and Non-life Insurance Industry Volume (Trillion) Forecast, by Application 2020 & 2033
- Table 49: Benelux US Life and Non-life Insurance Industry Revenue (Million) Forecast, by Application 2020 & 2033
- Table 50: Benelux US Life and Non-life Insurance Industry Volume (Trillion) Forecast, by Application 2020 & 2033
- Table 51: Nordics US Life and Non-life Insurance Industry Revenue (Million) Forecast, by Application 2020 & 2033
- Table 52: Nordics US Life and Non-life Insurance Industry Volume (Trillion) Forecast, by Application 2020 & 2033
- Table 53: Rest of Europe US Life and Non-life Insurance Industry Revenue (Million) Forecast, by Application 2020 & 2033
- Table 54: Rest of Europe US Life and Non-life Insurance Industry Volume (Trillion) Forecast, by Application 2020 & 2033
- Table 55: Global US Life and Non-life Insurance Industry Revenue Million Forecast, by Insurance type 2020 & 2033
- Table 56: Global US Life and Non-life Insurance Industry Volume Trillion Forecast, by Insurance type 2020 & 2033
- Table 57: Global US Life and Non-life Insurance Industry Revenue Million Forecast, by Distribution Channel 2020 & 2033
- Table 58: Global US Life and Non-life Insurance Industry Volume Trillion Forecast, by Distribution Channel 2020 & 2033
- Table 59: Global US Life and Non-life Insurance Industry Revenue Million Forecast, by Country 2020 & 2033
- Table 60: Global US Life and Non-life Insurance Industry Volume Trillion Forecast, by Country 2020 & 2033
- Table 61: Turkey US Life and Non-life Insurance Industry Revenue (Million) Forecast, by Application 2020 & 2033
- Table 62: Turkey US Life and Non-life Insurance Industry Volume (Trillion) Forecast, by Application 2020 & 2033
- Table 63: Israel US Life and Non-life Insurance Industry Revenue (Million) Forecast, by Application 2020 & 2033
- Table 64: Israel US Life and Non-life Insurance Industry Volume (Trillion) Forecast, by Application 2020 & 2033
- Table 65: GCC US Life and Non-life Insurance Industry Revenue (Million) Forecast, by Application 2020 & 2033
- Table 66: GCC US Life and Non-life Insurance Industry Volume (Trillion) Forecast, by Application 2020 & 2033
- Table 67: North Africa US Life and Non-life Insurance Industry Revenue (Million) Forecast, by Application 2020 & 2033
- Table 68: North Africa US Life and Non-life Insurance Industry Volume (Trillion) Forecast, by Application 2020 & 2033
- Table 69: South Africa US Life and Non-life Insurance Industry Revenue (Million) Forecast, by Application 2020 & 2033
- Table 70: South Africa US Life and Non-life Insurance Industry Volume (Trillion) Forecast, by Application 2020 & 2033
- Table 71: Rest of Middle East & Africa US Life and Non-life Insurance Industry Revenue (Million) Forecast, by Application 2020 & 2033
- Table 72: Rest of Middle East & Africa US Life and Non-life Insurance Industry Volume (Trillion) Forecast, by Application 2020 & 2033
- Table 73: Global US Life and Non-life Insurance Industry Revenue Million Forecast, by Insurance type 2020 & 2033
- Table 74: Global US Life and Non-life Insurance Industry Volume Trillion Forecast, by Insurance type 2020 & 2033
- Table 75: Global US Life and Non-life Insurance Industry Revenue Million Forecast, by Distribution Channel 2020 & 2033
- Table 76: Global US Life and Non-life Insurance Industry Volume Trillion Forecast, by Distribution Channel 2020 & 2033
- Table 77: Global US Life and Non-life Insurance Industry Revenue Million Forecast, by Country 2020 & 2033
- Table 78: Global US Life and Non-life Insurance Industry Volume Trillion Forecast, by Country 2020 & 2033
- Table 79: China US Life and Non-life Insurance Industry Revenue (Million) Forecast, by Application 2020 & 2033
- Table 80: China US Life and Non-life Insurance Industry Volume (Trillion) Forecast, by Application 2020 & 2033
- Table 81: India US Life and Non-life Insurance Industry Revenue (Million) Forecast, by Application 2020 & 2033
- Table 82: India US Life and Non-life Insurance Industry Volume (Trillion) Forecast, by Application 2020 & 2033
- Table 83: Japan US Life and Non-life Insurance Industry Revenue (Million) Forecast, by Application 2020 & 2033
- Table 84: Japan US Life and Non-life Insurance Industry Volume (Trillion) Forecast, by Application 2020 & 2033
- Table 85: South Korea US Life and Non-life Insurance Industry Revenue (Million) Forecast, by Application 2020 & 2033
- Table 86: South Korea US Life and Non-life Insurance Industry Volume (Trillion) Forecast, by Application 2020 & 2033
- Table 87: ASEAN US Life and Non-life Insurance Industry Revenue (Million) Forecast, by Application 2020 & 2033
- Table 88: ASEAN US Life and Non-life Insurance Industry Volume (Trillion) Forecast, by Application 2020 & 2033
- Table 89: Oceania US Life and Non-life Insurance Industry Revenue (Million) Forecast, by Application 2020 & 2033
- Table 90: Oceania US Life and Non-life Insurance Industry Volume (Trillion) Forecast, by Application 2020 & 2033
- Table 91: Rest of Asia Pacific US Life and Non-life Insurance Industry Revenue (Million) Forecast, by Application 2020 & 2033
- Table 92: Rest of Asia Pacific US Life and Non-life Insurance Industry Volume (Trillion) Forecast, by Application 2020 & 2033
Frequently Asked Questions
1. What is the projected Compound Annual Growth Rate (CAGR) of the US Life and Non-life Insurance Industry?
The projected CAGR is approximately 6.95%.
2. Which companies are prominent players in the US Life and Non-life Insurance Industry?
Key companies in the market include Massachusetts Mutual Life Insurance Company, UnitedHealth Group Incorporated, Berkshire Hathaway Inc, Cigna Corporation, Metlife Inc, Prudential Financial Inc, Aetna Inc, Centene Corporation, American International Group Inc, State Farm**List Not Exhaustive.
3. What are the main segments of the US Life and Non-life Insurance Industry?
The market segments include Insurance type, Distribution Channel.
4. Can you provide details about the market size?
The market size is estimated to be USD 2.02 Million as of 2022.
5. What are some drivers contributing to market growth?
N/A
6. What are the notable trends driving market growth?
Growing Insurtech in the United States is Driving the Market.
7. Are there any restraints impacting market growth?
N/A
8. Can you provide examples of recent developments in the market?
In 2022, With a USD100 million investment in health worker diversity, United Health Group advanced health equity and fulfilling its objectives to increase access to care, make it more affordable, and produce better health outcomes.
9. What pricing options are available for accessing the report?
Pricing options include single-user, multi-user, and enterprise licenses priced at USD 3800, USD 4500, and USD 5800 respectively.
10. Is the market size provided in terms of value or volume?
The market size is provided in terms of value, measured in Million and volume, measured in Trillion.
11. Are there any specific market keywords associated with the report?
Yes, the market keyword associated with the report is "US Life and Non-life Insurance Industry," which aids in identifying and referencing the specific market segment covered.
12. How do I determine which pricing option suits my needs best?
The pricing options vary based on user requirements and access needs. Individual users may opt for single-user licenses, while businesses requiring broader access may choose multi-user or enterprise licenses for cost-effective access to the report.
13. Are there any additional resources or data provided in the US Life and Non-life Insurance Industry report?
While the report offers comprehensive insights, it's advisable to review the specific contents or supplementary materials provided to ascertain if additional resources or data are available.
14. How can I stay updated on further developments or reports in the US Life and Non-life Insurance Industry?
To stay informed about further developments, trends, and reports in the US Life and Non-life Insurance Industry, consider subscribing to industry newsletters, following relevant companies and organizations, or regularly checking reputable industry news sources and publications.
Methodology
Step 1 - Identification of Relevant Samples Size from Population Database


Step 2 - Approaches for Defining Global Market Size (Value, Volume* & Price*)

Note*: In applicable scenarios
Step 3 - Data Sources
Primary Research
- Web Analytics
- Survey Reports
- Research Institute
- Latest Research Reports
- Opinion Leaders
Secondary Research
- Annual Reports
- White Paper
- Latest Press Release
- Industry Association
- Paid Database
- Investor Presentations

Step 4 - Data Triangulation
Involves using different sources of information in order to increase the validity of a study
These sources are likely to be stakeholders in a program - participants, other researchers, program staff, other community members, and so on.
Then we put all data in single framework & apply various statistical tools to find out the dynamic on the market.
During the analysis stage, feedback from the stakeholder groups would be compared to determine areas of agreement as well as areas of divergence