

Key Insights
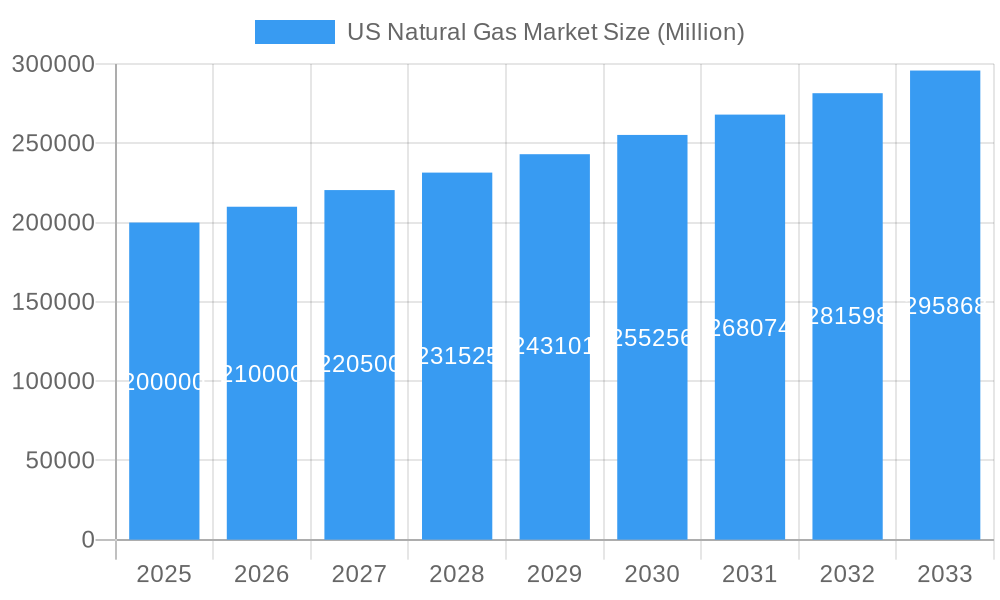
The U.S. natural gas market, valued at $473.4 billion in the base year 2025, is projected to expand significantly. Analysis indicates a compound annual growth rate (CAGR) of approximately 3.5% through 2033. This growth is primarily propelled by escalating demand from the power generation sector, driven by a strategic transition to cleaner energy and the decommissioning of coal facilities. The burgeoning adoption of natural gas vehicles (NGVs) in the automotive sector, alongside sustained industrial consumption in manufacturing and chemical processes, further bolsters market expansion. While residential use remains substantial, its growth rate is anticipated to be more measured. Key growth regions are expected to be the Northeast and Southeast, benefiting from established infrastructure and robust industrial activity.
US Natural Gas Market Market Size (In Billion)
Potential headwinds to market expansion include price volatility influenced by global energy dynamics, environmental concerns surrounding methane emissions, and the potential impact of evolving regulatory frameworks on exploration and production activities. Competition from renewable energy sources, such as solar and wind power, also represents a factor that could shape the long-term market outlook. The market is bifurcated into wet and dry natural gas segments, catering to diverse applications based on their composition. Leading industry participants, including Occidental Petroleum, Shell, ExxonMobil, and Chevron, are poised to leverage their extensive infrastructure and technical expertise. The future trajectory of the U.S. natural gas market hinges on a judicious balance between meeting energy requirements, addressing environmental considerations, and adapting to regulatory shifts and advancements in renewable energy technologies. A thorough grasp of these intertwined factors is essential for accurate market projections and informed strategic planning.
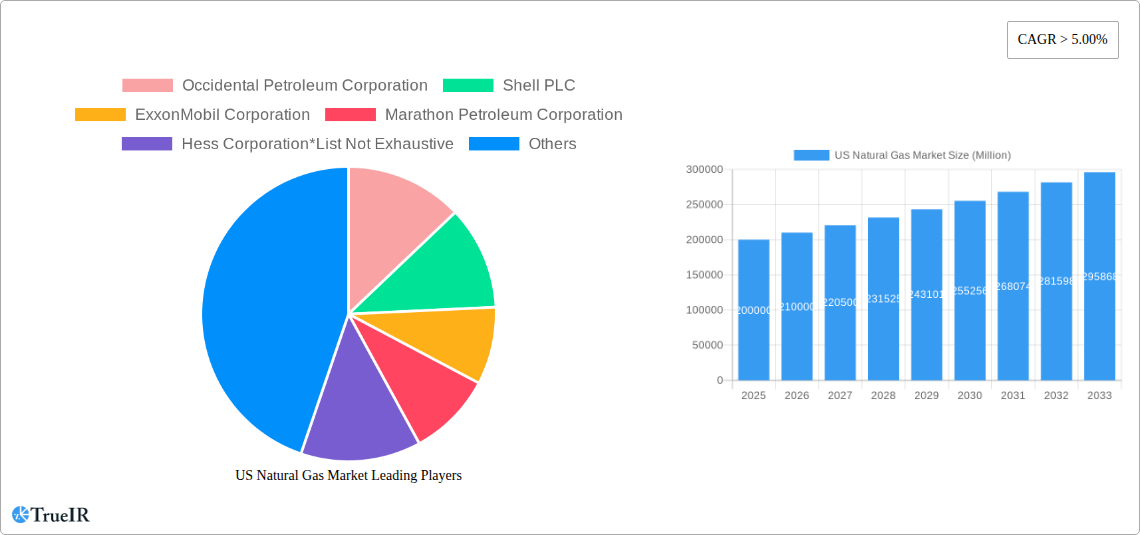
US Natural Gas Market Company Market Share
US Natural Gas Market Report: 2019-2033 Forecast
This comprehensive report provides an in-depth analysis of the US Natural Gas Market, encompassing historical data (2019-2024), current market dynamics (Base Year: 2025), and future projections (Forecast Period: 2025-2033). The report leverages detailed analysis and forecasts to offer valuable insights for industry stakeholders, investors, and policymakers. The US Natural Gas Market is valued at xx Million in 2025 and is projected to reach xx Million by 2033, exhibiting a CAGR of xx%.
US Natural Gas Market Market Structure & Competitive Landscape
The US natural gas market is characterized by a moderately concentrated structure, featuring a dynamic competitive landscape. Prominent players such as Occidental Petroleum Corporation, Shell PLC, ExxonMobil Corporation, Marathon Petroleum Corporation, Hess Corporation, ConocoPhillips, Chevron Corporation, TotalEnergies SE, Phillips 66, and EOG Resources Inc, among others, actively compete for market share. The Herfindahl-Hirschman Index (HHI) is estimated at approximately [Insert HHI Value Here, e.g., 1200], reinforcing the assessment of a moderately concentrated market.
- Key Growth Drivers: Technological advancements, particularly in extraction (e.g., hydraulic fracturing and horizontal drilling), processing, and transportation, are continuously driving efficiency gains and expanding the overall supply of natural gas.
- Regulatory Environment: Federal and state regulations, covering critical areas like environmental protection standards, pipeline safety protocols, and methane emissions reduction targets, exert a significant influence on market operations, investment decisions, and the adoption of best practices.
- Competitive Substitutes: The burgeoning growth of renewable energy sources, including solar and wind power, presents an intensifying competitive challenge, especially within the power generation sector where natural gas has historically been a dominant fuel.
- End-User Segmentation: The market is strategically segmented by end-use, with Power Generation representing the largest and fastest-growing segment. Other key segments include Residential, Industrial, and Automotive, each exhibiting unique growth trajectories influenced by sector-specific demand drivers and evolving energy consumption patterns.
- Mergers & Acquisitions (M&A) Trends: Over the past five years, the market has experienced substantial M&A activity, with an estimated value of [Insert M&A Value Here, e.g., $50 Billion]. This trend is largely driven by consolidation efforts among major industry players, the strategic acquisition of promising assets, and the pursuit of resource diversification to enhance resilience and market positioning.
US Natural Gas Market Market Trends & Opportunities
The US natural gas market is experiencing robust growth, driven by factors such as increased demand from the power generation sector, a relatively stable price environment, and continued investment in domestic production. The market size is projected to experience significant growth, reaching xx Million by 2033. Technological advancements, such as improved drilling techniques and pipeline infrastructure development, are further enhancing production efficiency and expanding access to resources. Consumer preference is shifting towards cleaner energy sources, although natural gas continues to play a significant role in the energy mix, particularly as a transitional fuel in the power generation sector. Increased competition from renewable sources continues to pressure market prices, promoting efficiency improvements within the industry. The market penetration rate for natural gas in power generation is estimated at xx%, with continued growth expected in the forecast period.
Dominant Markets & Segments in US Natural Gas Market
Regional and Sectoral Leadership: The power generation sector is anticipated to be the primary engine of growth, closely followed by the industrial sector, due to the widespread application of natural gas in a multitude of industrial processes. Geographically, the state of Texas continues to assert its dominance as the leading producer of natural gas within the United States.
Dry Natural Gas: This segment holds a commanding position in the market, largely attributed to its broader range of applications and comparatively lower processing costs. Key growth catalysts include:
- An escalating demand surge from the power generation sector.
- Continued expansion and modernization of critical pipeline infrastructure.
- Supportive government incentives aimed at bolstering domestic natural gas production.
Wet Natural Gas: This segment is experiencing moderate but steady growth, influenced by its higher processing requirements and more specialized applications. Primary growth drivers encompass:
- Robust demand for natural gas liquids (NGLs) as essential feedstocks for the petrochemical industry.
- Ongoing advancements in NGL extraction and processing technologies that enhance efficiency and recovery rates.
Power Generation: This remains the cornerstone end-use segment for natural gas, primarily due to its cost-effectiveness and inherent reliability as a power source. Key contributing factors to its sustained dominance include:
- The ongoing retirement of aging coal-fired power plants, creating a demand vacuum.
- A significant increase in overall electricity demand driven by economic growth and electrification trends.
- Favorable government policies and incentives that support the development and operation of natural gas-fired power plants.
US Natural Gas Market Product Analysis
The US natural gas market encompasses a diverse portfolio of products, prominently including dry natural gas, wet natural gas, and associated natural gas liquids (NGLs). Recent breakthroughs in extraction technologies, such as hydraulic fracturing and directional drilling, have significantly improved efficiency and unlocked previously inaccessible reserves. Coupled with enhancements in pipeline infrastructure and sophisticated processing techniques for NGLs, these advancements are bolstering market competitiveness by reducing production costs and ensuring a more consistent and reliable supply. The market fit for these products remains exceptionally strong, underpinned by persistent and growing demand for energy and critical feedstocks across a wide spectrum of industrial applications.
Key Drivers, Barriers & Challenges in US Natural Gas Market
Key Drivers: The primary drivers include increasing energy demand, particularly in the power generation sector; technological advancements in extraction and processing; and the relative affordability of natural gas compared to other fossil fuels. Government policies supporting domestic natural gas production also contribute to market growth.
Key Challenges: Major challenges include environmental concerns regarding methane emissions, fluctuating global prices, infrastructure limitations in certain regions, and increasing competition from renewable energy sources. These challenges potentially limit market growth and necessitate strategic adaptation by market participants. Regulatory complexities and potential supply chain disruptions also pose risks to the stable supply of natural gas.
Growth Drivers in the US Natural Gas Market Market
Increased demand from the power generation sector, coupled with technological advancements in extraction and processing techniques, are key drivers. Favorable government policies promoting domestic production and infrastructure development further bolster market growth. The rising need for cleaner energy sources, even if partially fulfilled by natural gas, acts as another key driver.
Challenges Impacting US Natural Gas Market Growth
The US natural gas market faces several significant headwinds that could impede its growth trajectory. Stringent and evolving environmental regulations, particularly those focused on reducing methane emissions, present substantial compliance and operational challenges. Furthermore, inherent volatility in global energy prices can create market uncertainty, while vulnerabilities within the supply chain can lead to disruptions in gas availability. The escalating competition from renewable energy sources, including solar and wind power, represents another formidable challenge that necessitates strategic adaptation and innovation for sustained market expansion.
Key Players Shaping the US Natural Gas Market Market
- Occidental Petroleum Corporation
- Shell PLC
- ExxonMobil Corporation
- Marathon Petroleum Corporation
- Hess Corporation
- ConocoPhillips
- Chevron Corporation
- TotalEnergies SE
- Phillips 66
- EOG Resources Inc
Significant US Natural Gas Market Industry Milestones
- May 2022: The US Energy Information Administration updated the Natural Gas Pipeline Project Tracker, noting FERC approval of three projects to increase natural gas exports via pipelines and LNG. Two projects connected LNG terminals in Louisiana, including the Evangeline Pass Expansion Project (1.1 billion cubic feet).
- April 2022: TotalEnergies announced an HOA to expand the Cameron LNG facility in Louisiana, adding a fourth train (6.75 Mtpa) and increasing existing capacity by 5%.
Future Outlook for US Natural Gas Market Market
The outlook for the US natural gas market remains robust, characterized by sustained demand, continuous technological innovation, and ongoing development of essential infrastructure. Significant strategic opportunities lie in the expansion of Liquefied Natural Gas (LNG) exports to meet global energy needs, the enhancement of processing capabilities for a wider range of NGLs, and the capitalization on the burgeoning demand from the power generation sector. While the market's long-term potential is substantial, its trajectory will undoubtedly be shaped by evolving global energy policies, the pace of renewable energy integration, and the associated investments in new energy infrastructure.
US Natural Gas Market Segmentation
-
1. Type
- 1.1. Wet Natural Gas
- 1.2. Dry Natural Gas
-
2. End Use
- 2.1. Power Generation
- 2.2. Automotive
- 2.3. Residential
- 2.4. Industries
US Natural Gas Market Segmentation By Geography
-
1. North America
- 1.1. United States
- 1.2. Canada
- 1.3. Mexico
-
2. South America
- 2.1. Brazil
- 2.2. Argentina
- 2.3. Rest of South America
-
3. Europe
- 3.1. United Kingdom
- 3.2. Germany
- 3.3. France
- 3.4. Italy
- 3.5. Spain
- 3.6. Russia
- 3.7. Benelux
- 3.8. Nordics
- 3.9. Rest of Europe
-
4. Middle East & Africa
- 4.1. Turkey
- 4.2. Israel
- 4.3. GCC
- 4.4. North Africa
- 4.5. South Africa
- 4.6. Rest of Middle East & Africa
-
5. Asia Pacific
- 5.1. China
- 5.2. India
- 5.3. Japan
- 5.4. South Korea
- 5.5. ASEAN
- 5.6. Oceania
- 5.7. Rest of Asia Pacific
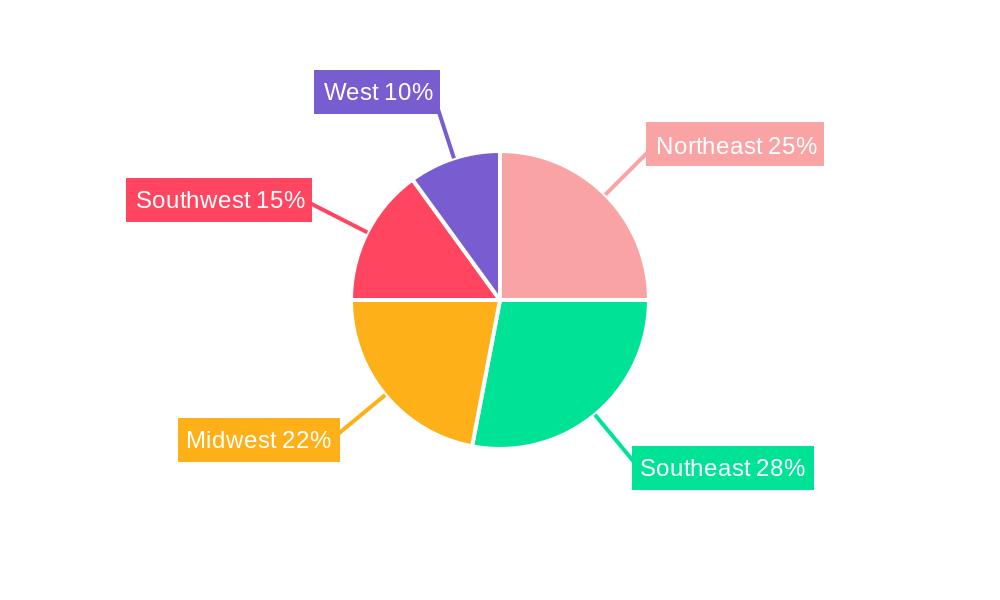
US Natural Gas Market Regional Market Share
Geographic Coverage of US Natural Gas Market
US Natural Gas Market REPORT HIGHLIGHTS
| Aspects | Details |
|---|---|
| Study Period | 2020-2034 |
| Base Year | 2025 |
| Estimated Year | 2026 |
| Forecast Period | 2026-2034 |
| Historical Period | 2020-2025 |
| Growth Rate | CAGR of 3.5% from 2020-2034 |
| Segmentation |
|
Table of Contents
- 1. Introduction
- 1.1. Research Scope
- 1.2. Market Segmentation
- 1.3. Research Objective
- 1.4. Definitions and Assumptions
- 2. Executive Summary
- 2.1. Market Snapshot
- 3. Market Dynamics
- 3.1. Market Drivers
- 3.2. Market Restrains
- 3.3. Market Trends
- 3.4. Market Opportunities
- 4. Market Factor Analysis
- 4.1. Porters Five Forces
- 4.1.1. Bargaining Power of Suppliers
- 4.1.2. Bargaining Power of Buyers
- 4.1.3. Threat of New Entrants
- 4.1.4. Threat of Substitutes
- 4.1.5. Competitive Rivalry
- 4.2. PESTEL analysis
- 4.3. BCG Analysis
- 4.3.1. Stars (High Growth, High Market Share)
- 4.3.2. Cash Cows (Low Growth, High Market Share)
- 4.3.3. Question Mark (High Growth, Low Market Share)
- 4.3.4. Dogs (Low Growth, Low Market Share)
- 4.4. Ansoff Matrix Analysis
- 4.5. Supply Chain Analysis
- 4.6. Regulatory Landscape
- 4.7. Current Market Potential and Opportunity Assessment (TAM–SAM–SOM Framework)
- 4.8. TIR Analyst Note
- 4.1. Porters Five Forces
- 5. Market Analysis, Insights and Forecast 2021-2033
- 5.1. Market Analysis, Insights and Forecast - by Type
- 5.1.1. Wet Natural Gas
- 5.1.2. Dry Natural Gas
- 5.2. Market Analysis, Insights and Forecast - by End Use
- 5.2.1. Power Generation
- 5.2.2. Automotive
- 5.2.3. Residential
- 5.2.4. Industries
- 5.3. Market Analysis, Insights and Forecast - by Region
- 5.3.1. North America
- 5.3.2. South America
- 5.3.3. Europe
- 5.3.4. Middle East & Africa
- 5.3.5. Asia Pacific
- 5.1. Market Analysis, Insights and Forecast - by Type
- 6. Global US Natural Gas Market Analysis, Insights and Forecast, 2021-2033
- 6.1. Market Analysis, Insights and Forecast - by Type
- 6.1.1. Wet Natural Gas
- 6.1.2. Dry Natural Gas
- 6.2. Market Analysis, Insights and Forecast - by End Use
- 6.2.1. Power Generation
- 6.2.2. Automotive
- 6.2.3. Residential
- 6.2.4. Industries
- 6.1. Market Analysis, Insights and Forecast - by Type
- 7. North America US Natural Gas Market Analysis, Insights and Forecast, 2020-2032
- 7.1. Market Analysis, Insights and Forecast - by Type
- 7.1.1. Wet Natural Gas
- 7.1.2. Dry Natural Gas
- 7.2. Market Analysis, Insights and Forecast - by End Use
- 7.2.1. Power Generation
- 7.2.2. Automotive
- 7.2.3. Residential
- 7.2.4. Industries
- 7.1. Market Analysis, Insights and Forecast - by Type
- 8. South America US Natural Gas Market Analysis, Insights and Forecast, 2020-2032
- 8.1. Market Analysis, Insights and Forecast - by Type
- 8.1.1. Wet Natural Gas
- 8.1.2. Dry Natural Gas
- 8.2. Market Analysis, Insights and Forecast - by End Use
- 8.2.1. Power Generation
- 8.2.2. Automotive
- 8.2.3. Residential
- 8.2.4. Industries
- 8.1. Market Analysis, Insights and Forecast - by Type
- 9. Europe US Natural Gas Market Analysis, Insights and Forecast, 2020-2032
- 9.1. Market Analysis, Insights and Forecast - by Type
- 9.1.1. Wet Natural Gas
- 9.1.2. Dry Natural Gas
- 9.2. Market Analysis, Insights and Forecast - by End Use
- 9.2.1. Power Generation
- 9.2.2. Automotive
- 9.2.3. Residential
- 9.2.4. Industries
- 9.1. Market Analysis, Insights and Forecast - by Type
- 10. Middle East & Africa US Natural Gas Market Analysis, Insights and Forecast, 2020-2032
- 10.1. Market Analysis, Insights and Forecast - by Type
- 10.1.1. Wet Natural Gas
- 10.1.2. Dry Natural Gas
- 10.2. Market Analysis, Insights and Forecast - by End Use
- 10.2.1. Power Generation
- 10.2.2. Automotive
- 10.2.3. Residential
- 10.2.4. Industries
- 10.1. Market Analysis, Insights and Forecast - by Type
- 11. Asia Pacific US Natural Gas Market Analysis, Insights and Forecast, 2020-2032
- 11.1. Market Analysis, Insights and Forecast - by Type
- 11.1.1. Wet Natural Gas
- 11.1.2. Dry Natural Gas
- 11.2. Market Analysis, Insights and Forecast - by End Use
- 11.2.1. Power Generation
- 11.2.2. Automotive
- 11.2.3. Residential
- 11.2.4. Industries
- 11.1. Market Analysis, Insights and Forecast - by Type
- 12. Competitive Analysis
- 12.1. Company Profiles
- 12.1.1 Occidental Petroleum Corporation
- 12.1.1.1. Company Overview
- 12.1.1.2. Products
- 12.1.1.3. Company Financials
- 12.1.1.4. SWOT Analysis
- 12.1.2 Shell PLC
- 12.1.2.1. Company Overview
- 12.1.2.2. Products
- 12.1.2.3. Company Financials
- 12.1.2.4. SWOT Analysis
- 12.1.3 ExxonMobil Corporation
- 12.1.3.1. Company Overview
- 12.1.3.2. Products
- 12.1.3.3. Company Financials
- 12.1.3.4. SWOT Analysis
- 12.1.4 Marathon Petroleum Corporation
- 12.1.4.1. Company Overview
- 12.1.4.2. Products
- 12.1.4.3. Company Financials
- 12.1.4.4. SWOT Analysis
- 12.1.5 Hess Corporation*List Not Exhaustive
- 12.1.5.1. Company Overview
- 12.1.5.2. Products
- 12.1.5.3. Company Financials
- 12.1.5.4. SWOT Analysis
- 12.1.6 ConocoPhillips
- 12.1.6.1. Company Overview
- 12.1.6.2. Products
- 12.1.6.3. Company Financials
- 12.1.6.4. SWOT Analysis
- 12.1.7 Chevron Corporation
- 12.1.7.1. Company Overview
- 12.1.7.2. Products
- 12.1.7.3. Company Financials
- 12.1.7.4. SWOT Analysis
- 12.1.8 TotalEnergies SE
- 12.1.8.1. Company Overview
- 12.1.8.2. Products
- 12.1.8.3. Company Financials
- 12.1.8.4. SWOT Analysis
- 12.1.9 Phillips
- 12.1.9.1. Company Overview
- 12.1.9.2. Products
- 12.1.9.3. Company Financials
- 12.1.9.4. SWOT Analysis
- 12.1.10 EOG Resources Inc
- 12.1.10.1. Company Overview
- 12.1.10.2. Products
- 12.1.10.3. Company Financials
- 12.1.10.4. SWOT Analysis
- 12.1.1 Occidental Petroleum Corporation
- 12.2. Market Entropy
- 12.2.1 Company's Key Areas Served
- 12.2.2 Recent Developments
- 12.3. Company Market Share Analysis 2025
- 12.3.1 Top 5 Companies Market Share Analysis
- 12.3.2 Top 3 Companies Market Share Analysis
- 12.4. List of Potential Customers
- 13. Research Methodology
List of Figures
- Figure 1: Global US Natural Gas Market Revenue Breakdown (billion, %) by Region 2025 & 2033
- Figure 2: Global US Natural Gas Market Volume Breakdown (Tonnes, %) by Region 2025 & 2033
- Figure 3: North America US Natural Gas Market Revenue (billion), by Type 2025 & 2033
- Figure 4: North America US Natural Gas Market Volume (Tonnes), by Type 2025 & 2033
- Figure 5: North America US Natural Gas Market Revenue Share (%), by Type 2025 & 2033
- Figure 6: North America US Natural Gas Market Volume Share (%), by Type 2025 & 2033
- Figure 7: North America US Natural Gas Market Revenue (billion), by End Use 2025 & 2033
- Figure 8: North America US Natural Gas Market Volume (Tonnes), by End Use 2025 & 2033
- Figure 9: North America US Natural Gas Market Revenue Share (%), by End Use 2025 & 2033
- Figure 10: North America US Natural Gas Market Volume Share (%), by End Use 2025 & 2033
- Figure 11: North America US Natural Gas Market Revenue (billion), by Country 2025 & 2033
- Figure 12: North America US Natural Gas Market Volume (Tonnes), by Country 2025 & 2033
- Figure 13: North America US Natural Gas Market Revenue Share (%), by Country 2025 & 2033
- Figure 14: North America US Natural Gas Market Volume Share (%), by Country 2025 & 2033
- Figure 15: South America US Natural Gas Market Revenue (billion), by Type 2025 & 2033
- Figure 16: South America US Natural Gas Market Volume (Tonnes), by Type 2025 & 2033
- Figure 17: South America US Natural Gas Market Revenue Share (%), by Type 2025 & 2033
- Figure 18: South America US Natural Gas Market Volume Share (%), by Type 2025 & 2033
- Figure 19: South America US Natural Gas Market Revenue (billion), by End Use 2025 & 2033
- Figure 20: South America US Natural Gas Market Volume (Tonnes), by End Use 2025 & 2033
- Figure 21: South America US Natural Gas Market Revenue Share (%), by End Use 2025 & 2033
- Figure 22: South America US Natural Gas Market Volume Share (%), by End Use 2025 & 2033
- Figure 23: South America US Natural Gas Market Revenue (billion), by Country 2025 & 2033
- Figure 24: South America US Natural Gas Market Volume (Tonnes), by Country 2025 & 2033
- Figure 25: South America US Natural Gas Market Revenue Share (%), by Country 2025 & 2033
- Figure 26: South America US Natural Gas Market Volume Share (%), by Country 2025 & 2033
- Figure 27: Europe US Natural Gas Market Revenue (billion), by Type 2025 & 2033
- Figure 28: Europe US Natural Gas Market Volume (Tonnes), by Type 2025 & 2033
- Figure 29: Europe US Natural Gas Market Revenue Share (%), by Type 2025 & 2033
- Figure 30: Europe US Natural Gas Market Volume Share (%), by Type 2025 & 2033
- Figure 31: Europe US Natural Gas Market Revenue (billion), by End Use 2025 & 2033
- Figure 32: Europe US Natural Gas Market Volume (Tonnes), by End Use 2025 & 2033
- Figure 33: Europe US Natural Gas Market Revenue Share (%), by End Use 2025 & 2033
- Figure 34: Europe US Natural Gas Market Volume Share (%), by End Use 2025 & 2033
- Figure 35: Europe US Natural Gas Market Revenue (billion), by Country 2025 & 2033
- Figure 36: Europe US Natural Gas Market Volume (Tonnes), by Country 2025 & 2033
- Figure 37: Europe US Natural Gas Market Revenue Share (%), by Country 2025 & 2033
- Figure 38: Europe US Natural Gas Market Volume Share (%), by Country 2025 & 2033
- Figure 39: Middle East & Africa US Natural Gas Market Revenue (billion), by Type 2025 & 2033
- Figure 40: Middle East & Africa US Natural Gas Market Volume (Tonnes), by Type 2025 & 2033
- Figure 41: Middle East & Africa US Natural Gas Market Revenue Share (%), by Type 2025 & 2033
- Figure 42: Middle East & Africa US Natural Gas Market Volume Share (%), by Type 2025 & 2033
- Figure 43: Middle East & Africa US Natural Gas Market Revenue (billion), by End Use 2025 & 2033
- Figure 44: Middle East & Africa US Natural Gas Market Volume (Tonnes), by End Use 2025 & 2033
- Figure 45: Middle East & Africa US Natural Gas Market Revenue Share (%), by End Use 2025 & 2033
- Figure 46: Middle East & Africa US Natural Gas Market Volume Share (%), by End Use 2025 & 2033
- Figure 47: Middle East & Africa US Natural Gas Market Revenue (billion), by Country 2025 & 2033
- Figure 48: Middle East & Africa US Natural Gas Market Volume (Tonnes), by Country 2025 & 2033
- Figure 49: Middle East & Africa US Natural Gas Market Revenue Share (%), by Country 2025 & 2033
- Figure 50: Middle East & Africa US Natural Gas Market Volume Share (%), by Country 2025 & 2033
- Figure 51: Asia Pacific US Natural Gas Market Revenue (billion), by Type 2025 & 2033
- Figure 52: Asia Pacific US Natural Gas Market Volume (Tonnes), by Type 2025 & 2033
- Figure 53: Asia Pacific US Natural Gas Market Revenue Share (%), by Type 2025 & 2033
- Figure 54: Asia Pacific US Natural Gas Market Volume Share (%), by Type 2025 & 2033
- Figure 55: Asia Pacific US Natural Gas Market Revenue (billion), by End Use 2025 & 2033
- Figure 56: Asia Pacific US Natural Gas Market Volume (Tonnes), by End Use 2025 & 2033
- Figure 57: Asia Pacific US Natural Gas Market Revenue Share (%), by End Use 2025 & 2033
- Figure 58: Asia Pacific US Natural Gas Market Volume Share (%), by End Use 2025 & 2033
- Figure 59: Asia Pacific US Natural Gas Market Revenue (billion), by Country 2025 & 2033
- Figure 60: Asia Pacific US Natural Gas Market Volume (Tonnes), by Country 2025 & 2033
- Figure 61: Asia Pacific US Natural Gas Market Revenue Share (%), by Country 2025 & 2033
- Figure 62: Asia Pacific US Natural Gas Market Volume Share (%), by Country 2025 & 2033
List of Tables
- Table 1: Global US Natural Gas Market Revenue billion Forecast, by Type 2020 & 2033
- Table 2: Global US Natural Gas Market Volume Tonnes Forecast, by Type 2020 & 2033
- Table 3: Global US Natural Gas Market Revenue billion Forecast, by End Use 2020 & 2033
- Table 4: Global US Natural Gas Market Volume Tonnes Forecast, by End Use 2020 & 2033
- Table 5: Global US Natural Gas Market Revenue billion Forecast, by Region 2020 & 2033
- Table 6: Global US Natural Gas Market Volume Tonnes Forecast, by Region 2020 & 2033
- Table 7: Global US Natural Gas Market Revenue billion Forecast, by Type 2020 & 2033
- Table 8: Global US Natural Gas Market Volume Tonnes Forecast, by Type 2020 & 2033
- Table 9: Global US Natural Gas Market Revenue billion Forecast, by End Use 2020 & 2033
- Table 10: Global US Natural Gas Market Volume Tonnes Forecast, by End Use 2020 & 2033
- Table 11: Global US Natural Gas Market Revenue billion Forecast, by Country 2020 & 2033
- Table 12: Global US Natural Gas Market Volume Tonnes Forecast, by Country 2020 & 2033
- Table 13: United States US Natural Gas Market Revenue (billion) Forecast, by Application 2020 & 2033
- Table 14: United States US Natural Gas Market Volume (Tonnes) Forecast, by Application 2020 & 2033
- Table 15: Canada US Natural Gas Market Revenue (billion) Forecast, by Application 2020 & 2033
- Table 16: Canada US Natural Gas Market Volume (Tonnes) Forecast, by Application 2020 & 2033
- Table 17: Mexico US Natural Gas Market Revenue (billion) Forecast, by Application 2020 & 2033
- Table 18: Mexico US Natural Gas Market Volume (Tonnes) Forecast, by Application 2020 & 2033
- Table 19: Global US Natural Gas Market Revenue billion Forecast, by Type 2020 & 2033
- Table 20: Global US Natural Gas Market Volume Tonnes Forecast, by Type 2020 & 2033
- Table 21: Global US Natural Gas Market Revenue billion Forecast, by End Use 2020 & 2033
- Table 22: Global US Natural Gas Market Volume Tonnes Forecast, by End Use 2020 & 2033
- Table 23: Global US Natural Gas Market Revenue billion Forecast, by Country 2020 & 2033
- Table 24: Global US Natural Gas Market Volume Tonnes Forecast, by Country 2020 & 2033
- Table 25: Brazil US Natural Gas Market Revenue (billion) Forecast, by Application 2020 & 2033
- Table 26: Brazil US Natural Gas Market Volume (Tonnes) Forecast, by Application 2020 & 2033
- Table 27: Argentina US Natural Gas Market Revenue (billion) Forecast, by Application 2020 & 2033
- Table 28: Argentina US Natural Gas Market Volume (Tonnes) Forecast, by Application 2020 & 2033
- Table 29: Rest of South America US Natural Gas Market Revenue (billion) Forecast, by Application 2020 & 2033
- Table 30: Rest of South America US Natural Gas Market Volume (Tonnes) Forecast, by Application 2020 & 2033
- Table 31: Global US Natural Gas Market Revenue billion Forecast, by Type 2020 & 2033
- Table 32: Global US Natural Gas Market Volume Tonnes Forecast, by Type 2020 & 2033
- Table 33: Global US Natural Gas Market Revenue billion Forecast, by End Use 2020 & 2033
- Table 34: Global US Natural Gas Market Volume Tonnes Forecast, by End Use 2020 & 2033
- Table 35: Global US Natural Gas Market Revenue billion Forecast, by Country 2020 & 2033
- Table 36: Global US Natural Gas Market Volume Tonnes Forecast, by Country 2020 & 2033
- Table 37: United Kingdom US Natural Gas Market Revenue (billion) Forecast, by Application 2020 & 2033
- Table 38: United Kingdom US Natural Gas Market Volume (Tonnes) Forecast, by Application 2020 & 2033
- Table 39: Germany US Natural Gas Market Revenue (billion) Forecast, by Application 2020 & 2033
- Table 40: Germany US Natural Gas Market Volume (Tonnes) Forecast, by Application 2020 & 2033
- Table 41: France US Natural Gas Market Revenue (billion) Forecast, by Application 2020 & 2033
- Table 42: France US Natural Gas Market Volume (Tonnes) Forecast, by Application 2020 & 2033
- Table 43: Italy US Natural Gas Market Revenue (billion) Forecast, by Application 2020 & 2033
- Table 44: Italy US Natural Gas Market Volume (Tonnes) Forecast, by Application 2020 & 2033
- Table 45: Spain US Natural Gas Market Revenue (billion) Forecast, by Application 2020 & 2033
- Table 46: Spain US Natural Gas Market Volume (Tonnes) Forecast, by Application 2020 & 2033
- Table 47: Russia US Natural Gas Market Revenue (billion) Forecast, by Application 2020 & 2033
- Table 48: Russia US Natural Gas Market Volume (Tonnes) Forecast, by Application 2020 & 2033
- Table 49: Benelux US Natural Gas Market Revenue (billion) Forecast, by Application 2020 & 2033
- Table 50: Benelux US Natural Gas Market Volume (Tonnes) Forecast, by Application 2020 & 2033
- Table 51: Nordics US Natural Gas Market Revenue (billion) Forecast, by Application 2020 & 2033
- Table 52: Nordics US Natural Gas Market Volume (Tonnes) Forecast, by Application 2020 & 2033
- Table 53: Rest of Europe US Natural Gas Market Revenue (billion) Forecast, by Application 2020 & 2033
- Table 54: Rest of Europe US Natural Gas Market Volume (Tonnes) Forecast, by Application 2020 & 2033
- Table 55: Global US Natural Gas Market Revenue billion Forecast, by Type 2020 & 2033
- Table 56: Global US Natural Gas Market Volume Tonnes Forecast, by Type 2020 & 2033
- Table 57: Global US Natural Gas Market Revenue billion Forecast, by End Use 2020 & 2033
- Table 58: Global US Natural Gas Market Volume Tonnes Forecast, by End Use 2020 & 2033
- Table 59: Global US Natural Gas Market Revenue billion Forecast, by Country 2020 & 2033
- Table 60: Global US Natural Gas Market Volume Tonnes Forecast, by Country 2020 & 2033
- Table 61: Turkey US Natural Gas Market Revenue (billion) Forecast, by Application 2020 & 2033
- Table 62: Turkey US Natural Gas Market Volume (Tonnes) Forecast, by Application 2020 & 2033
- Table 63: Israel US Natural Gas Market Revenue (billion) Forecast, by Application 2020 & 2033
- Table 64: Israel US Natural Gas Market Volume (Tonnes) Forecast, by Application 2020 & 2033
- Table 65: GCC US Natural Gas Market Revenue (billion) Forecast, by Application 2020 & 2033
- Table 66: GCC US Natural Gas Market Volume (Tonnes) Forecast, by Application 2020 & 2033
- Table 67: North Africa US Natural Gas Market Revenue (billion) Forecast, by Application 2020 & 2033
- Table 68: North Africa US Natural Gas Market Volume (Tonnes) Forecast, by Application 2020 & 2033
- Table 69: South Africa US Natural Gas Market Revenue (billion) Forecast, by Application 2020 & 2033
- Table 70: South Africa US Natural Gas Market Volume (Tonnes) Forecast, by Application 2020 & 2033
- Table 71: Rest of Middle East & Africa US Natural Gas Market Revenue (billion) Forecast, by Application 2020 & 2033
- Table 72: Rest of Middle East & Africa US Natural Gas Market Volume (Tonnes) Forecast, by Application 2020 & 2033
- Table 73: Global US Natural Gas Market Revenue billion Forecast, by Type 2020 & 2033
- Table 74: Global US Natural Gas Market Volume Tonnes Forecast, by Type 2020 & 2033
- Table 75: Global US Natural Gas Market Revenue billion Forecast, by End Use 2020 & 2033
- Table 76: Global US Natural Gas Market Volume Tonnes Forecast, by End Use 2020 & 2033
- Table 77: Global US Natural Gas Market Revenue billion Forecast, by Country 2020 & 2033
- Table 78: Global US Natural Gas Market Volume Tonnes Forecast, by Country 2020 & 2033
- Table 79: China US Natural Gas Market Revenue (billion) Forecast, by Application 2020 & 2033
- Table 80: China US Natural Gas Market Volume (Tonnes) Forecast, by Application 2020 & 2033
- Table 81: India US Natural Gas Market Revenue (billion) Forecast, by Application 2020 & 2033
- Table 82: India US Natural Gas Market Volume (Tonnes) Forecast, by Application 2020 & 2033
- Table 83: Japan US Natural Gas Market Revenue (billion) Forecast, by Application 2020 & 2033
- Table 84: Japan US Natural Gas Market Volume (Tonnes) Forecast, by Application 2020 & 2033
- Table 85: South Korea US Natural Gas Market Revenue (billion) Forecast, by Application 2020 & 2033
- Table 86: South Korea US Natural Gas Market Volume (Tonnes) Forecast, by Application 2020 & 2033
- Table 87: ASEAN US Natural Gas Market Revenue (billion) Forecast, by Application 2020 & 2033
- Table 88: ASEAN US Natural Gas Market Volume (Tonnes) Forecast, by Application 2020 & 2033
- Table 89: Oceania US Natural Gas Market Revenue (billion) Forecast, by Application 2020 & 2033
- Table 90: Oceania US Natural Gas Market Volume (Tonnes) Forecast, by Application 2020 & 2033
- Table 91: Rest of Asia Pacific US Natural Gas Market Revenue (billion) Forecast, by Application 2020 & 2033
- Table 92: Rest of Asia Pacific US Natural Gas Market Volume (Tonnes) Forecast, by Application 2020 & 2033
Frequently Asked Questions
1. What is the projected Compound Annual Growth Rate (CAGR) of the US Natural Gas Market?
The projected CAGR is approximately 3.5%.
2. Which companies are prominent players in the US Natural Gas Market?
Key companies in the market include Occidental Petroleum Corporation, Shell PLC, ExxonMobil Corporation, Marathon Petroleum Corporation, Hess Corporation*List Not Exhaustive, ConocoPhillips, Chevron Corporation, TotalEnergies SE, Phillips, EOG Resources Inc.
3. What are the main segments of the US Natural Gas Market?
The market segments include Type, End Use.
4. Can you provide details about the market size?
The market size is estimated to be USD 473.4 billion as of 2022.
5. What are some drivers contributing to market growth?
Increasing Global Demand for Refined Petroleum Products4.; Economic Growth and Industrialization.
6. What are the notable trends driving market growth?
Power Generation Segment to Dominate the Market.
7. Are there any restraints impacting market growth?
Environmental Concerns and Regulations.
8. Can you provide examples of recent developments in the market?
May 2022: According to the US Energy Information Administration, the Natural Gas Pipeline Project Tracker was updated with recent approvals and completions of pipeline projects. As of the end of the first quarter of 2022, the Federal Energy Regulatory Commission (FERC) approved three projects to increase the export of US natural gas by pipeline and LNG. FERC approved two projects connecting LNG terminals in Louisiana. The Evangeline Pass Expansion Project, owned by Tennessee Gas Pipeline Company, is 1.1 billion cubic feet in size. It is intended that the proposed Plaquemines LNG Project in Plaquemines Parish, Louisiana, be supplied with natural gas by constructing 13.1 miles of new pipeline and two new compressor stations.
9. What pricing options are available for accessing the report?
Pricing options include single-user, multi-user, and enterprise licenses priced at USD 3800, USD 4500, and USD 5800 respectively.
10. Is the market size provided in terms of value or volume?
The market size is provided in terms of value, measured in billion and volume, measured in Tonnes.
11. Are there any specific market keywords associated with the report?
Yes, the market keyword associated with the report is "US Natural Gas Market," which aids in identifying and referencing the specific market segment covered.
12. How do I determine which pricing option suits my needs best?
The pricing options vary based on user requirements and access needs. Individual users may opt for single-user licenses, while businesses requiring broader access may choose multi-user or enterprise licenses for cost-effective access to the report.
13. Are there any additional resources or data provided in the US Natural Gas Market report?
While the report offers comprehensive insights, it's advisable to review the specific contents or supplementary materials provided to ascertain if additional resources or data are available.
14. How can I stay updated on further developments or reports in the US Natural Gas Market?
To stay informed about further developments, trends, and reports in the US Natural Gas Market, consider subscribing to industry newsletters, following relevant companies and organizations, or regularly checking reputable industry news sources and publications.
Methodology
Step 1 - Identification of Relevant Samples Size from Population Database


Step 2 - Approaches for Defining Global Market Size (Value, Volume* & Price*)

Note*: In applicable scenarios
Step 3 - Data Sources
Primary Research
- Web Analytics
- Survey Reports
- Research Institute
- Latest Research Reports
- Opinion Leaders
Secondary Research
- Annual Reports
- White Paper
- Latest Press Release
- Industry Association
- Paid Database
- Investor Presentations

Step 4 - Data Triangulation
Involves using different sources of information in order to increase the validity of a study
These sources are likely to be stakeholders in a program - participants, other researchers, program staff, other community members, and so on.
Then we put all data in single framework & apply various statistical tools to find out the dynamic on the market.
During the analysis stage, feedback from the stakeholder groups would be compared to determine areas of agreement as well as areas of divergence