

Key Insights
The global Vapor Recovery Units (VRUs) market is projected to reach an estimated market size of USD 0.94 billion by 2025, with a Compound Annual Growth Rate (CAGR) of 6.11% during the forecast period. This expansion is primarily fueled by increasingly stringent environmental regulations worldwide, mandating the adoption of advanced technologies for Volatile Organic Compound (VOC) emission control. The Oil & Gas sector remains a key driver, focusing on minimizing hydrocarbon losses across exploration, production, refining, and transportation. The Chemical & Petrochemical industry also significantly contributes, investing in VRUs for improved operational efficiency and regulatory compliance.
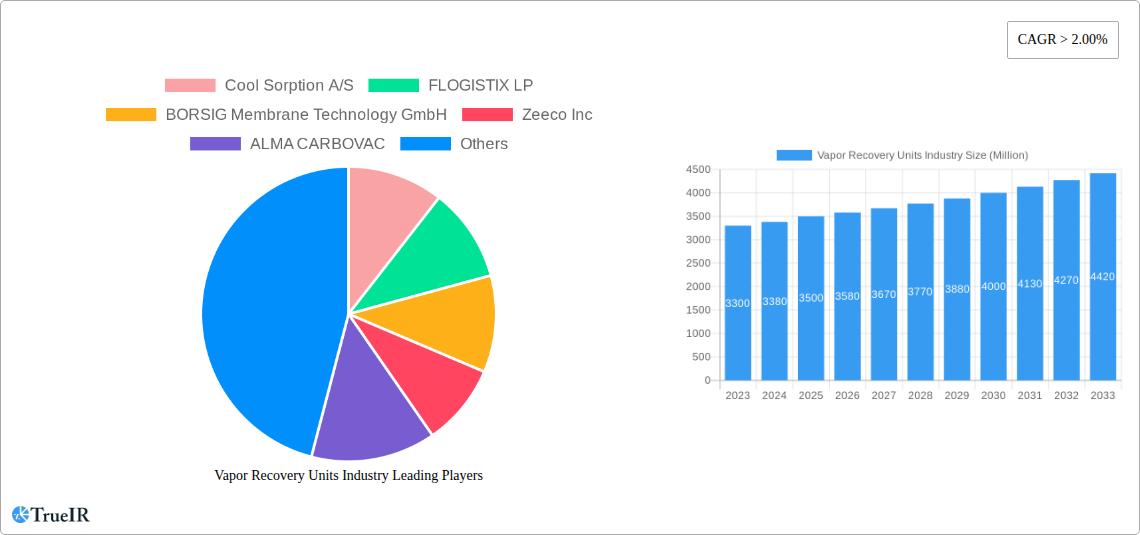
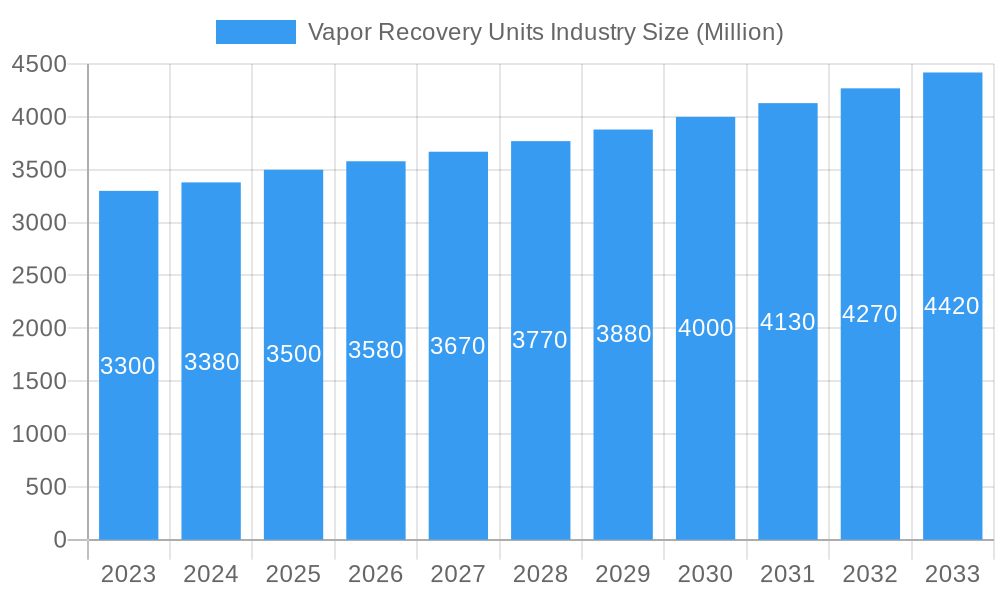
Vapor Recovery Units Industry Market Size (In Million)
Key market trends include the growing adoption of energy-efficient, compact membrane-based VRUs and the integration of smart technologies and IoT for real-time monitoring and predictive maintenance. While high initial capital investment and fluctuating crude oil prices present potential restraints, the long-term benefits of reduced environmental impact, enhanced product recovery, and improved safety are expected to propel market growth across processing, storage, and transportation applications. Leading players such as Cool Sorption A/S, Zeeco Inc., and John Zink Company LLC are actively innovating to meet evolving market demands in this vital environmental technology sector.
Vapor Recovery Units Industry Company Market Share
Vapor Recovery Units Industry Market Structure & Competitive Landscape
The global Vapor Recovery Units (VRUs) market exhibits a moderately fragmented structure, with a mix of large, established players and a growing number of specialized technology providers. Key companies actively shaping this landscape include Cool Sorption A/S, FLOGISTIX LP, BORSIG Membrane Technology GmbH, Zeeco Inc, ALMA CARBOVAC, Kappa GI, John Zink Company LLC, Kilburn Engineering Ltd, AEREON, Symex GmbH & Co KG, Hy-Bon Engineering Company Inc, and VOCZero Ltd. The competitive intensity is driven by continuous innovation in membrane and adsorption technologies, coupled with stringent environmental regulations mandating vapor emission control. Product substitutes, such as flares and thermal oxidizers, exist but often present higher operational costs and lower recovery efficiency, positioning VRUs favorably. End-user segmentation, primarily dominated by the Oil & Gas sector, followed by Chemical & Petrochemical industries, highlights the critical need for efficient vapor management. Mergers and acquisitions (M&A) activity, though not extensively documented in terms of sheer volume, is crucial for market consolidation and technology integration, allowing larger entities to expand their service portfolios and geographic reach. For instance, strategic acquisitions by major players aim to bolster their offerings in specific applications like storage and transportation. The market concentration ratio is estimated to be around 35-45%, indicating a healthy competitive environment with scope for smaller players to carve out niches.
Vapor Recovery Units Industry Market Trends & Opportunities
The Vapor Recovery Units (VRUs) industry is poised for significant expansion, driven by escalating environmental consciousness, stricter governmental regulations concerning volatile organic compound (VOC) emissions, and the inherent economic benefits of recovering valuable hydrocarbons. The global VRU market is projected to reach an estimated value of over $5,500 Million by 2033, experiencing a robust Compound Annual Growth Rate (CAGR) of approximately 7.2% from the base year 2025. This growth trajectory is underpinned by several prevailing trends. Firstly, the increasing demand for enhanced emission control solutions across the Oil & Gas sector, from upstream exploration and production to midstream transportation and downstream refining, is a primary catalyst. As companies strive to meet evolving environmental standards and reduce their carbon footprint, investments in advanced VRU technologies, particularly those offering high recovery rates and operational efficiency, are accelerating.
Technological advancements are continuously reshaping the VRU landscape. The shift towards more energy-efficient and compact VRU systems, including membrane-based and advanced adsorption units, is a notable trend. These innovations offer improved performance, lower maintenance requirements, and reduced footprint, making them more attractive for a wider range of applications. Membrane VRUs, for example, are gaining traction due to their inherent simplicity and low power consumption, while regenerative thermal oxidizers with heat recovery capabilities are also seeing increased adoption for their effectiveness in destroying VOCs while minimizing energy expenditure.
Consumer preferences are increasingly leaning towards solutions that offer a strong return on investment (ROI) through hydrocarbon recovery. The economic value of recovered vapors, which can be reintroduced into the process or sold, provides a compelling financial incentive for adopting VRU technology. This trend is particularly pronounced in regions with high hydrocarbon prices and stringent emission controls. Furthermore, the growing emphasis on circular economy principles and sustainable industrial practices is bolstering the demand for VRUs as they contribute to resource conservation and waste reduction.
Competitive dynamics are characterized by a focus on technological differentiation, cost-effectiveness, and comprehensive service offerings. Key players are investing heavily in research and development to enhance the efficiency and reliability of their VRU systems, while also expanding their service networks to provide installation, maintenance, and retrofitting solutions. The market penetration rate of VRUs is steadily increasing, especially in emerging economies that are beginning to implement stricter environmental regulations. The opportunities for market expansion are substantial, particularly in sectors dealing with large volumes of volatile liquids, such as bulk liquid storage terminals and loading/unloading facilities. The increasing adoption of VRUs at these points of emission is crucial for achieving compliance and mitigating environmental impact.
Dominant Markets & Segments in Vapor Recovery Units Industry
The Vapor Recovery Units (VRU) industry is experiencing its most significant traction within the Oil & Gas end-user segment, accounting for an estimated 65% of the total market share. This dominance is directly attributable to the inherent nature of oil and gas operations, which involve the handling of highly volatile hydrocarbons across various stages. The critical need for regulatory compliance, coupled with the economic imperative to recover valuable product, makes VRUs indispensable in this sector. Within the Oil & Gas sector, the Storage application segment emerges as a particularly strong performer, projected to represent over 35% of the total VRU market by 2033. This is driven by the large number of storage tanks at refineries, terminals, and production sites where vapor displacement during filling and breathing losses during temperature fluctuations lead to substantial VOC emissions.
The Chemical & Petrochemical end-user segment represents the second-largest market for VRUs, holding an estimated 25% of the market share. Similar to Oil & Gas, this sector deals with a wide array of volatile and hazardous chemical compounds, necessitating robust emission control measures. The Processing application within this segment is a key growth area, as chemical plants often involve complex distillation, reaction, and separation processes that generate significant vapor streams requiring recovery.
The Transportation application, encompassing loading and unloading operations at pipelines, marine terminals, and road tanker facilities, is also a significant contributor to the VRU market, projected to account for approximately 15% of the overall market by 2033. As regulatory scrutiny intensifies on fugitive emissions during these transfer operations, the demand for effective vapor capture and recovery systems is on the rise.
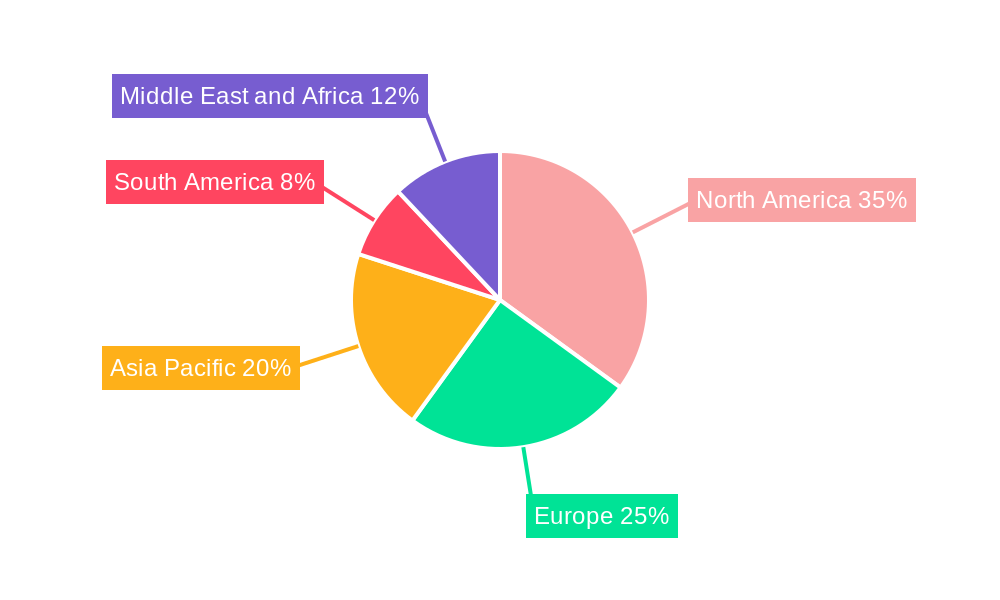
Geographically, North America is currently the leading region, driven by a mature Oil & Gas industry, stringent environmental regulations enacted by agencies like the EPA, and a high adoption rate of advanced technologies. The United States, in particular, exhibits substantial demand for VRUs in its prolific shale plays and extensive refining infrastructure. Europe follows as another dominant market, propelled by the European Union's ambitious climate goals and directives aimed at reducing industrial emissions. Countries like Germany, the UK, and Norway are at the forefront of VRU adoption, particularly in their petrochemical and offshore oil and gas sectors.
Emerging markets in Asia Pacific, particularly China and India, are exhibiting the fastest growth rates. This expansion is fueled by rapid industrialization, increasing domestic demand for oil and gas products, and a growing awareness and implementation of environmental protection policies. As these regions develop their infrastructure, the integration of VRU technology becomes a critical component of sustainable industrial growth. The "Others" end-user segment, which includes industries like paints and coatings, pharmaceuticals, and food processing, is also witnessing a steady rise in VRU adoption, albeit from a smaller base, as environmental regulations become more comprehensive across various industrial sectors.
Vapor Recovery Units Industry Product Analysis
VRU products are characterized by their technological diversity, primarily revolving around adsorption (e.g., carbon adsorption) and membrane separation systems. Adsorption-based VRUs excel in capturing a broad spectrum of VOCs with high efficiency, making them ideal for high-concentration vapor streams. Membrane VRUs, on the other hand, offer a more energy-efficient and compact solution, particularly suitable for lower-pressure applications and situations where specific hydrocarbon separation is desired. Innovations are focused on enhancing recovery rates, reducing energy consumption, improving system reliability, and developing modular designs for easier installation and scalability. The competitive advantage of these products lies in their ability to meet increasingly stringent emission standards while simultaneously offering economic benefits through hydrocarbon recovery, thus ensuring a strong market fit across various industrial applications.
Key Drivers, Barriers & Challenges in Vapor Recovery Units Industry
Key Drivers:
- Stringent Environmental Regulations: Mandates from governmental bodies worldwide to limit VOC emissions are the primary catalyst for VRU adoption.
- Economic Incentives: The recovery of valuable hydrocarbons, which can be resold or reprocessed, provides a significant return on investment.
- Technological Advancements: Development of more efficient, energy-saving, and compact VRU technologies enhances their appeal.
- Growing Oil & Gas and Petrochemical Industries: Increased exploration, production, and processing activities necessitate effective emission control.
Challenges:
- High Initial Capital Investment: The upfront cost of VRU systems can be a barrier for some smaller operators.
- Operational Complexity and Maintenance: Certain VRU technologies require specialized maintenance and skilled personnel.
- Fluctuating Hydrocarbon Prices: While recovery is beneficial, extreme price volatility can impact the ROI calculations for some applications.
- Supply Chain Disruptions: Global events can impact the availability of critical components and lead times.
Growth Drivers in the Vapor Recovery Units Industry Market
The Vapor Recovery Units (VRU) industry's growth is primarily propelled by a confluence of factors. Stringent environmental regulations globally, focusing on the reduction of volatile organic compounds (VOCs) and hazardous air pollutants, are a monumental driver. Agencies like the EPA in the US and the European Environment Agency are continuously tightening emission standards, forcing industries to invest in effective abatement technologies like VRUs. Secondly, the economic benefits of hydrocarbon recovery are increasingly recognized. Recovered vapors, which would otherwise be lost to the atmosphere, represent valuable product that can be reintroduced into the process or sold, offering a compelling return on investment. Technological advancements, such as the development of more efficient membrane-based and adsorption-based VRUs that offer higher recovery rates and lower energy consumption, are also significantly contributing to market growth. The expansion of oil and gas exploration and production, coupled with the burgeoning chemical and petrochemical industries, especially in emerging economies, creates a larger installed base requiring effective vapor management solutions.
Challenges Impacting Vapor Recovery Units Industry Growth
Despite robust growth prospects, the Vapor Recovery Units (VRU) industry faces several significant challenges. High initial capital expenditure for sophisticated VRU systems can pose a substantial barrier, particularly for smaller and medium-sized enterprises with limited budgets. The complexity of certain VRU technologies necessitates skilled personnel for operation and maintenance, which can be a constraint in regions with a shortage of trained technicians. Furthermore, the fluctuating global prices of crude oil and natural gas can impact the perceived economic viability of hydrocarbon recovery, potentially influencing investment decisions. Supply chain vulnerabilities, exacerbated by geopolitical events and logistical challenges, can lead to extended lead times for critical components and affect project timelines. Additionally, evolving regulatory landscapes in different regions, while driving adoption, can also create compliance complexities and require frequent system upgrades, adding to the cost burden.
Key Players Shaping the Vapor Recovery Units Industry Market
- Cool Sorption A/S
- FLOGISTIX LP
- BORSIG Membrane Technology GmbH
- Zeeco Inc
- ALMA CARBOVAC
- Kappa GI
- John Zink Company LLC
- Kilburn Engineering Ltd
- AEREON
- Symex GmbH & Co KG
- Hy-Bon Engineering Company Inc
- VOCZero Ltd
Significant Vapor Recovery Units Industry Industry Milestones
- 2019: Increased adoption of advanced membrane technology for enhanced energy efficiency in VRUs.
- 2020: Introduction of modular and compact VRU designs catering to smaller facilities and remote locations.
- 2021: Growing emphasis on IoT integration in VRU systems for remote monitoring and predictive maintenance.
- 2022: Major oil and gas companies commit to substantial investments in emission reduction technologies, including VRUs.
- 2023: Development of VRUs with higher recovery rates for challenging VOC mixtures.
- 2024: Enhanced focus on circular economy principles driving demand for VRUs in waste-to-energy applications.
- 2025 (Estimated): Widespread implementation of AI-powered optimization in VRU operations for maximum efficiency.
- 2026 (Projected): Advancements in materials science leading to more durable and cost-effective VRU components.
- 2027 (Projected): Integration of VRUs with carbon capture technologies for a dual approach to emission control.
- 2028 (Projected): Significant market penetration of VRUs in emerging economies due to stricter environmental enforcement.
- 2029 (Projected): Development of self-optimizing VRU systems requiring minimal human intervention.
- 2030 (Projected): Increased adoption of VRUs in non-traditional sectors like pharmaceutical manufacturing.
- 2031 (Projected): Focus on lifecycle assessment and sustainability in VRU manufacturing and operation.
- 2032 (Projected): Development of VRU solutions specifically for hydrogen production facilities.
- 2033 (Projected): VRU technology becomes a standard component in all new industrial facilities handling volatile substances.
Future Outlook for Vapor Recovery Units Industry Market
The future outlook for the Vapor Recovery Units (VRU) industry is exceptionally positive, driven by sustained global efforts towards environmental sustainability and the increasing economic imperative to conserve resources. Market growth will be fueled by ongoing technological innovations, leading to more efficient, cost-effective, and intelligent VRU systems. The expanding adoption of digital technologies, including AI and IoT, will enable predictive maintenance, remote diagnostics, and optimized operational performance, further enhancing the value proposition of VRUs. Strategic opportunities lie in the expanding application across nascent industries and in emerging economies that are rapidly industrializing and implementing stricter environmental regulations. The industry is poised to play a pivotal role in helping businesses achieve their decarbonization goals and transition towards a more circular economy.
Vapor Recovery Units Industry Segmentation
-
1. Application
- 1.1. Processing
- 1.2. Storage
- 1.3. Transportation
-
2. End-User
- 2.1. Oil & Gas
- 2.2. Chemical & Petrochemical
- 2.3. Others
Vapor Recovery Units Industry Segmentation By Geography
- 1. North America
- 2. Europe
- 3. Asia Pacific
- 4. South America
- 5. Middle East and Africa
Vapor Recovery Units Industry Regional Market Share
Geographic Coverage of Vapor Recovery Units Industry
Vapor Recovery Units Industry REPORT HIGHLIGHTS
| Aspects | Details |
|---|---|
| Study Period | 2020-2034 |
| Base Year | 2025 |
| Estimated Year | 2026 |
| Forecast Period | 2026-2034 |
| Historical Period | 2020-2025 |
| Growth Rate | CAGR of 6.11% from 2020-2034 |
| Segmentation |
|
Table of Contents
- 1. Introduction
- 1.1. Research Scope
- 1.2. Market Segmentation
- 1.3. Research Objective
- 1.4. Definitions and Assumptions
- 2. Executive Summary
- 2.1. Market Snapshot
- 3. Market Dynamics
- 3.1. Market Drivers
- 3.2. Market Restrains
- 3.3. Market Trends
- 3.4. Market Opportunities
- 4. Market Factor Analysis
- 4.1. Porters Five Forces
- 4.1.1. Bargaining Power of Suppliers
- 4.1.2. Bargaining Power of Buyers
- 4.1.3. Threat of New Entrants
- 4.1.4. Threat of Substitutes
- 4.1.5. Competitive Rivalry
- 4.2. PESTEL analysis
- 4.3. BCG Analysis
- 4.3.1. Stars (High Growth, High Market Share)
- 4.3.2. Cash Cows (Low Growth, High Market Share)
- 4.3.3. Question Mark (High Growth, Low Market Share)
- 4.3.4. Dogs (Low Growth, Low Market Share)
- 4.4. Ansoff Matrix Analysis
- 4.5. Supply Chain Analysis
- 4.6. Regulatory Landscape
- 4.7. Current Market Potential and Opportunity Assessment (TAM–SAM–SOM Framework)
- 4.8. TIR Analyst Note
- 4.1. Porters Five Forces
- 5. Market Analysis, Insights and Forecast 2021-2033
- 5.1. Market Analysis, Insights and Forecast - by Application
- 5.1.1. Processing
- 5.1.2. Storage
- 5.1.3. Transportation
- 5.2. Market Analysis, Insights and Forecast - by End-User
- 5.2.1. Oil & Gas
- 5.2.2. Chemical & Petrochemical
- 5.2.3. Others
- 5.3. Market Analysis, Insights and Forecast - by Region
- 5.3.1. North America
- 5.3.2. Europe
- 5.3.3. Asia Pacific
- 5.3.4. South America
- 5.3.5. Middle East and Africa
- 5.1. Market Analysis, Insights and Forecast - by Application
- 6. Global Vapor Recovery Units Industry Analysis, Insights and Forecast, 2021-2033
- 6.1. Market Analysis, Insights and Forecast - by Application
- 6.1.1. Processing
- 6.1.2. Storage
- 6.1.3. Transportation
- 6.2. Market Analysis, Insights and Forecast - by End-User
- 6.2.1. Oil & Gas
- 6.2.2. Chemical & Petrochemical
- 6.2.3. Others
- 6.1. Market Analysis, Insights and Forecast - by Application
- 7. North America Vapor Recovery Units Industry Analysis, Insights and Forecast, 2020-2032
- 7.1. Market Analysis, Insights and Forecast - by Application
- 7.1.1. Processing
- 7.1.2. Storage
- 7.1.3. Transportation
- 7.2. Market Analysis, Insights and Forecast - by End-User
- 7.2.1. Oil & Gas
- 7.2.2. Chemical & Petrochemical
- 7.2.3. Others
- 7.1. Market Analysis, Insights and Forecast - by Application
- 8. Europe Vapor Recovery Units Industry Analysis, Insights and Forecast, 2020-2032
- 8.1. Market Analysis, Insights and Forecast - by Application
- 8.1.1. Processing
- 8.1.2. Storage
- 8.1.3. Transportation
- 8.2. Market Analysis, Insights and Forecast - by End-User
- 8.2.1. Oil & Gas
- 8.2.2. Chemical & Petrochemical
- 8.2.3. Others
- 8.1. Market Analysis, Insights and Forecast - by Application
- 9. Asia Pacific Vapor Recovery Units Industry Analysis, Insights and Forecast, 2020-2032
- 9.1. Market Analysis, Insights and Forecast - by Application
- 9.1.1. Processing
- 9.1.2. Storage
- 9.1.3. Transportation
- 9.2. Market Analysis, Insights and Forecast - by End-User
- 9.2.1. Oil & Gas
- 9.2.2. Chemical & Petrochemical
- 9.2.3. Others
- 9.1. Market Analysis, Insights and Forecast - by Application
- 10. South America Vapor Recovery Units Industry Analysis, Insights and Forecast, 2020-2032
- 10.1. Market Analysis, Insights and Forecast - by Application
- 10.1.1. Processing
- 10.1.2. Storage
- 10.1.3. Transportation
- 10.2. Market Analysis, Insights and Forecast - by End-User
- 10.2.1. Oil & Gas
- 10.2.2. Chemical & Petrochemical
- 10.2.3. Others
- 10.1. Market Analysis, Insights and Forecast - by Application
- 11. Middle East and Africa Vapor Recovery Units Industry Analysis, Insights and Forecast, 2020-2032
- 11.1. Market Analysis, Insights and Forecast - by Application
- 11.1.1. Processing
- 11.1.2. Storage
- 11.1.3. Transportation
- 11.2. Market Analysis, Insights and Forecast - by End-User
- 11.2.1. Oil & Gas
- 11.2.2. Chemical & Petrochemical
- 11.2.3. Others
- 11.1. Market Analysis, Insights and Forecast - by Application
- 12. Competitive Analysis
- 12.1. Company Profiles
- 12.1.1 Cool Sorption A/S
- 12.1.1.1. Company Overview
- 12.1.1.2. Products
- 12.1.1.3. Company Financials
- 12.1.1.4. SWOT Analysis
- 12.1.2 FLOGISTIX LP
- 12.1.2.1. Company Overview
- 12.1.2.2. Products
- 12.1.2.3. Company Financials
- 12.1.2.4. SWOT Analysis
- 12.1.3 BORSIG Membrane Technology GmbH
- 12.1.3.1. Company Overview
- 12.1.3.2. Products
- 12.1.3.3. Company Financials
- 12.1.3.4. SWOT Analysis
- 12.1.4 Zeeco Inc
- 12.1.4.1. Company Overview
- 12.1.4.2. Products
- 12.1.4.3. Company Financials
- 12.1.4.4. SWOT Analysis
- 12.1.5 ALMA CARBOVAC
- 12.1.5.1. Company Overview
- 12.1.5.2. Products
- 12.1.5.3. Company Financials
- 12.1.5.4. SWOT Analysis
- 12.1.6 Kappa GI
- 12.1.6.1. Company Overview
- 12.1.6.2. Products
- 12.1.6.3. Company Financials
- 12.1.6.4. SWOT Analysis
- 12.1.7 John Zink Company LLC
- 12.1.7.1. Company Overview
- 12.1.7.2. Products
- 12.1.7.3. Company Financials
- 12.1.7.4. SWOT Analysis
- 12.1.8 Kilburn Engineering Ltd*List Not Exhaustive
- 12.1.8.1. Company Overview
- 12.1.8.2. Products
- 12.1.8.3. Company Financials
- 12.1.8.4. SWOT Analysis
- 12.1.9 AEREON
- 12.1.9.1. Company Overview
- 12.1.9.2. Products
- 12.1.9.3. Company Financials
- 12.1.9.4. SWOT Analysis
- 12.1.10 Symex GmbH & Co KG
- 12.1.10.1. Company Overview
- 12.1.10.2. Products
- 12.1.10.3. Company Financials
- 12.1.10.4. SWOT Analysis
- 12.1.11 Hy-Bon Engineering Company Inc
- 12.1.11.1. Company Overview
- 12.1.11.2. Products
- 12.1.11.3. Company Financials
- 12.1.11.4. SWOT Analysis
- 12.1.12 VOCZero Ltd
- 12.1.12.1. Company Overview
- 12.1.12.2. Products
- 12.1.12.3. Company Financials
- 12.1.12.4. SWOT Analysis
- 12.1.1 Cool Sorption A/S
- 12.2. Market Entropy
- 12.2.1 Company's Key Areas Served
- 12.2.2 Recent Developments
- 12.3. Company Market Share Analysis 2025
- 12.3.1 Top 5 Companies Market Share Analysis
- 12.3.2 Top 3 Companies Market Share Analysis
- 12.4. List of Potential Customers
- 13. Research Methodology
List of Figures
- Figure 1: Global Vapor Recovery Units Industry Revenue Breakdown (billion, %) by Region 2025 & 2033
- Figure 2: North America Vapor Recovery Units Industry Revenue (billion), by Application 2025 & 2033
- Figure 3: North America Vapor Recovery Units Industry Revenue Share (%), by Application 2025 & 2033
- Figure 4: North America Vapor Recovery Units Industry Revenue (billion), by End-User 2025 & 2033
- Figure 5: North America Vapor Recovery Units Industry Revenue Share (%), by End-User 2025 & 2033
- Figure 6: North America Vapor Recovery Units Industry Revenue (billion), by Country 2025 & 2033
- Figure 7: North America Vapor Recovery Units Industry Revenue Share (%), by Country 2025 & 2033
- Figure 8: Europe Vapor Recovery Units Industry Revenue (billion), by Application 2025 & 2033
- Figure 9: Europe Vapor Recovery Units Industry Revenue Share (%), by Application 2025 & 2033
- Figure 10: Europe Vapor Recovery Units Industry Revenue (billion), by End-User 2025 & 2033
- Figure 11: Europe Vapor Recovery Units Industry Revenue Share (%), by End-User 2025 & 2033
- Figure 12: Europe Vapor Recovery Units Industry Revenue (billion), by Country 2025 & 2033
- Figure 13: Europe Vapor Recovery Units Industry Revenue Share (%), by Country 2025 & 2033
- Figure 14: Asia Pacific Vapor Recovery Units Industry Revenue (billion), by Application 2025 & 2033
- Figure 15: Asia Pacific Vapor Recovery Units Industry Revenue Share (%), by Application 2025 & 2033
- Figure 16: Asia Pacific Vapor Recovery Units Industry Revenue (billion), by End-User 2025 & 2033
- Figure 17: Asia Pacific Vapor Recovery Units Industry Revenue Share (%), by End-User 2025 & 2033
- Figure 18: Asia Pacific Vapor Recovery Units Industry Revenue (billion), by Country 2025 & 2033
- Figure 19: Asia Pacific Vapor Recovery Units Industry Revenue Share (%), by Country 2025 & 2033
- Figure 20: South America Vapor Recovery Units Industry Revenue (billion), by Application 2025 & 2033
- Figure 21: South America Vapor Recovery Units Industry Revenue Share (%), by Application 2025 & 2033
- Figure 22: South America Vapor Recovery Units Industry Revenue (billion), by End-User 2025 & 2033
- Figure 23: South America Vapor Recovery Units Industry Revenue Share (%), by End-User 2025 & 2033
- Figure 24: South America Vapor Recovery Units Industry Revenue (billion), by Country 2025 & 2033
- Figure 25: South America Vapor Recovery Units Industry Revenue Share (%), by Country 2025 & 2033
- Figure 26: Middle East and Africa Vapor Recovery Units Industry Revenue (billion), by Application 2025 & 2033
- Figure 27: Middle East and Africa Vapor Recovery Units Industry Revenue Share (%), by Application 2025 & 2033
- Figure 28: Middle East and Africa Vapor Recovery Units Industry Revenue (billion), by End-User 2025 & 2033
- Figure 29: Middle East and Africa Vapor Recovery Units Industry Revenue Share (%), by End-User 2025 & 2033
- Figure 30: Middle East and Africa Vapor Recovery Units Industry Revenue (billion), by Country 2025 & 2033
- Figure 31: Middle East and Africa Vapor Recovery Units Industry Revenue Share (%), by Country 2025 & 2033
List of Tables
- Table 1: Global Vapor Recovery Units Industry Revenue billion Forecast, by Application 2020 & 2033
- Table 2: Global Vapor Recovery Units Industry Revenue billion Forecast, by End-User 2020 & 2033
- Table 3: Global Vapor Recovery Units Industry Revenue billion Forecast, by Region 2020 & 2033
- Table 4: Global Vapor Recovery Units Industry Revenue billion Forecast, by Application 2020 & 2033
- Table 5: Global Vapor Recovery Units Industry Revenue billion Forecast, by End-User 2020 & 2033
- Table 6: Global Vapor Recovery Units Industry Revenue billion Forecast, by Country 2020 & 2033
- Table 7: Global Vapor Recovery Units Industry Revenue billion Forecast, by Application 2020 & 2033
- Table 8: Global Vapor Recovery Units Industry Revenue billion Forecast, by End-User 2020 & 2033
- Table 9: Global Vapor Recovery Units Industry Revenue billion Forecast, by Country 2020 & 2033
- Table 10: Global Vapor Recovery Units Industry Revenue billion Forecast, by Application 2020 & 2033
- Table 11: Global Vapor Recovery Units Industry Revenue billion Forecast, by End-User 2020 & 2033
- Table 12: Global Vapor Recovery Units Industry Revenue billion Forecast, by Country 2020 & 2033
- Table 13: Global Vapor Recovery Units Industry Revenue billion Forecast, by Application 2020 & 2033
- Table 14: Global Vapor Recovery Units Industry Revenue billion Forecast, by End-User 2020 & 2033
- Table 15: Global Vapor Recovery Units Industry Revenue billion Forecast, by Country 2020 & 2033
- Table 16: Global Vapor Recovery Units Industry Revenue billion Forecast, by Application 2020 & 2033
- Table 17: Global Vapor Recovery Units Industry Revenue billion Forecast, by End-User 2020 & 2033
- Table 18: Global Vapor Recovery Units Industry Revenue billion Forecast, by Country 2020 & 2033
Frequently Asked Questions
1. What is the projected Compound Annual Growth Rate (CAGR) of the Vapor Recovery Units Industry?
The projected CAGR is approximately 6.11%.
2. Which companies are prominent players in the Vapor Recovery Units Industry?
Key companies in the market include Cool Sorption A/S, FLOGISTIX LP, BORSIG Membrane Technology GmbH, Zeeco Inc, ALMA CARBOVAC, Kappa GI, John Zink Company LLC, Kilburn Engineering Ltd*List Not Exhaustive, AEREON, Symex GmbH & Co KG, Hy-Bon Engineering Company Inc, VOCZero Ltd.
3. What are the main segments of the Vapor Recovery Units Industry?
The market segments include Application, End-User.
4. Can you provide details about the market size?
The market size is estimated to be USD 0.94 billion as of 2022.
5. What are some drivers contributing to market growth?
4.; Rising Environmental Concerns and Energy Security in the Country4.; Increasing Focus on Renewable Energy.
6. What are the notable trends driving market growth?
Oil & gas Sector to Dominate the Market.
7. Are there any restraints impacting market growth?
4.; Availability of Abundance Natural Fossil Fuel Reserves.
8. Can you provide examples of recent developments in the market?
N/A
9. What pricing options are available for accessing the report?
Pricing options include single-user, multi-user, and enterprise licenses priced at USD 4750, USD 5250, and USD 8750 respectively.
10. Is the market size provided in terms of value or volume?
The market size is provided in terms of value, measured in billion.
11. Are there any specific market keywords associated with the report?
Yes, the market keyword associated with the report is "Vapor Recovery Units Industry," which aids in identifying and referencing the specific market segment covered.
12. How do I determine which pricing option suits my needs best?
The pricing options vary based on user requirements and access needs. Individual users may opt for single-user licenses, while businesses requiring broader access may choose multi-user or enterprise licenses for cost-effective access to the report.
13. Are there any additional resources or data provided in the Vapor Recovery Units Industry report?
While the report offers comprehensive insights, it's advisable to review the specific contents or supplementary materials provided to ascertain if additional resources or data are available.
14. How can I stay updated on further developments or reports in the Vapor Recovery Units Industry?
To stay informed about further developments, trends, and reports in the Vapor Recovery Units Industry, consider subscribing to industry newsletters, following relevant companies and organizations, or regularly checking reputable industry news sources and publications.
Methodology
Step 1 - Identification of Relevant Samples Size from Population Database


Step 2 - Approaches for Defining Global Market Size (Value, Volume* & Price*)

Note*: In applicable scenarios
Step 3 - Data Sources
Primary Research
- Web Analytics
- Survey Reports
- Research Institute
- Latest Research Reports
- Opinion Leaders
Secondary Research
- Annual Reports
- White Paper
- Latest Press Release
- Industry Association
- Paid Database
- Investor Presentations

Step 4 - Data Triangulation
Involves using different sources of information in order to increase the validity of a study
These sources are likely to be stakeholders in a program - participants, other researchers, program staff, other community members, and so on.
Then we put all data in single framework & apply various statistical tools to find out the dynamic on the market.
During the analysis stage, feedback from the stakeholder groups would be compared to determine areas of agreement as well as areas of divergence