

Key Insights
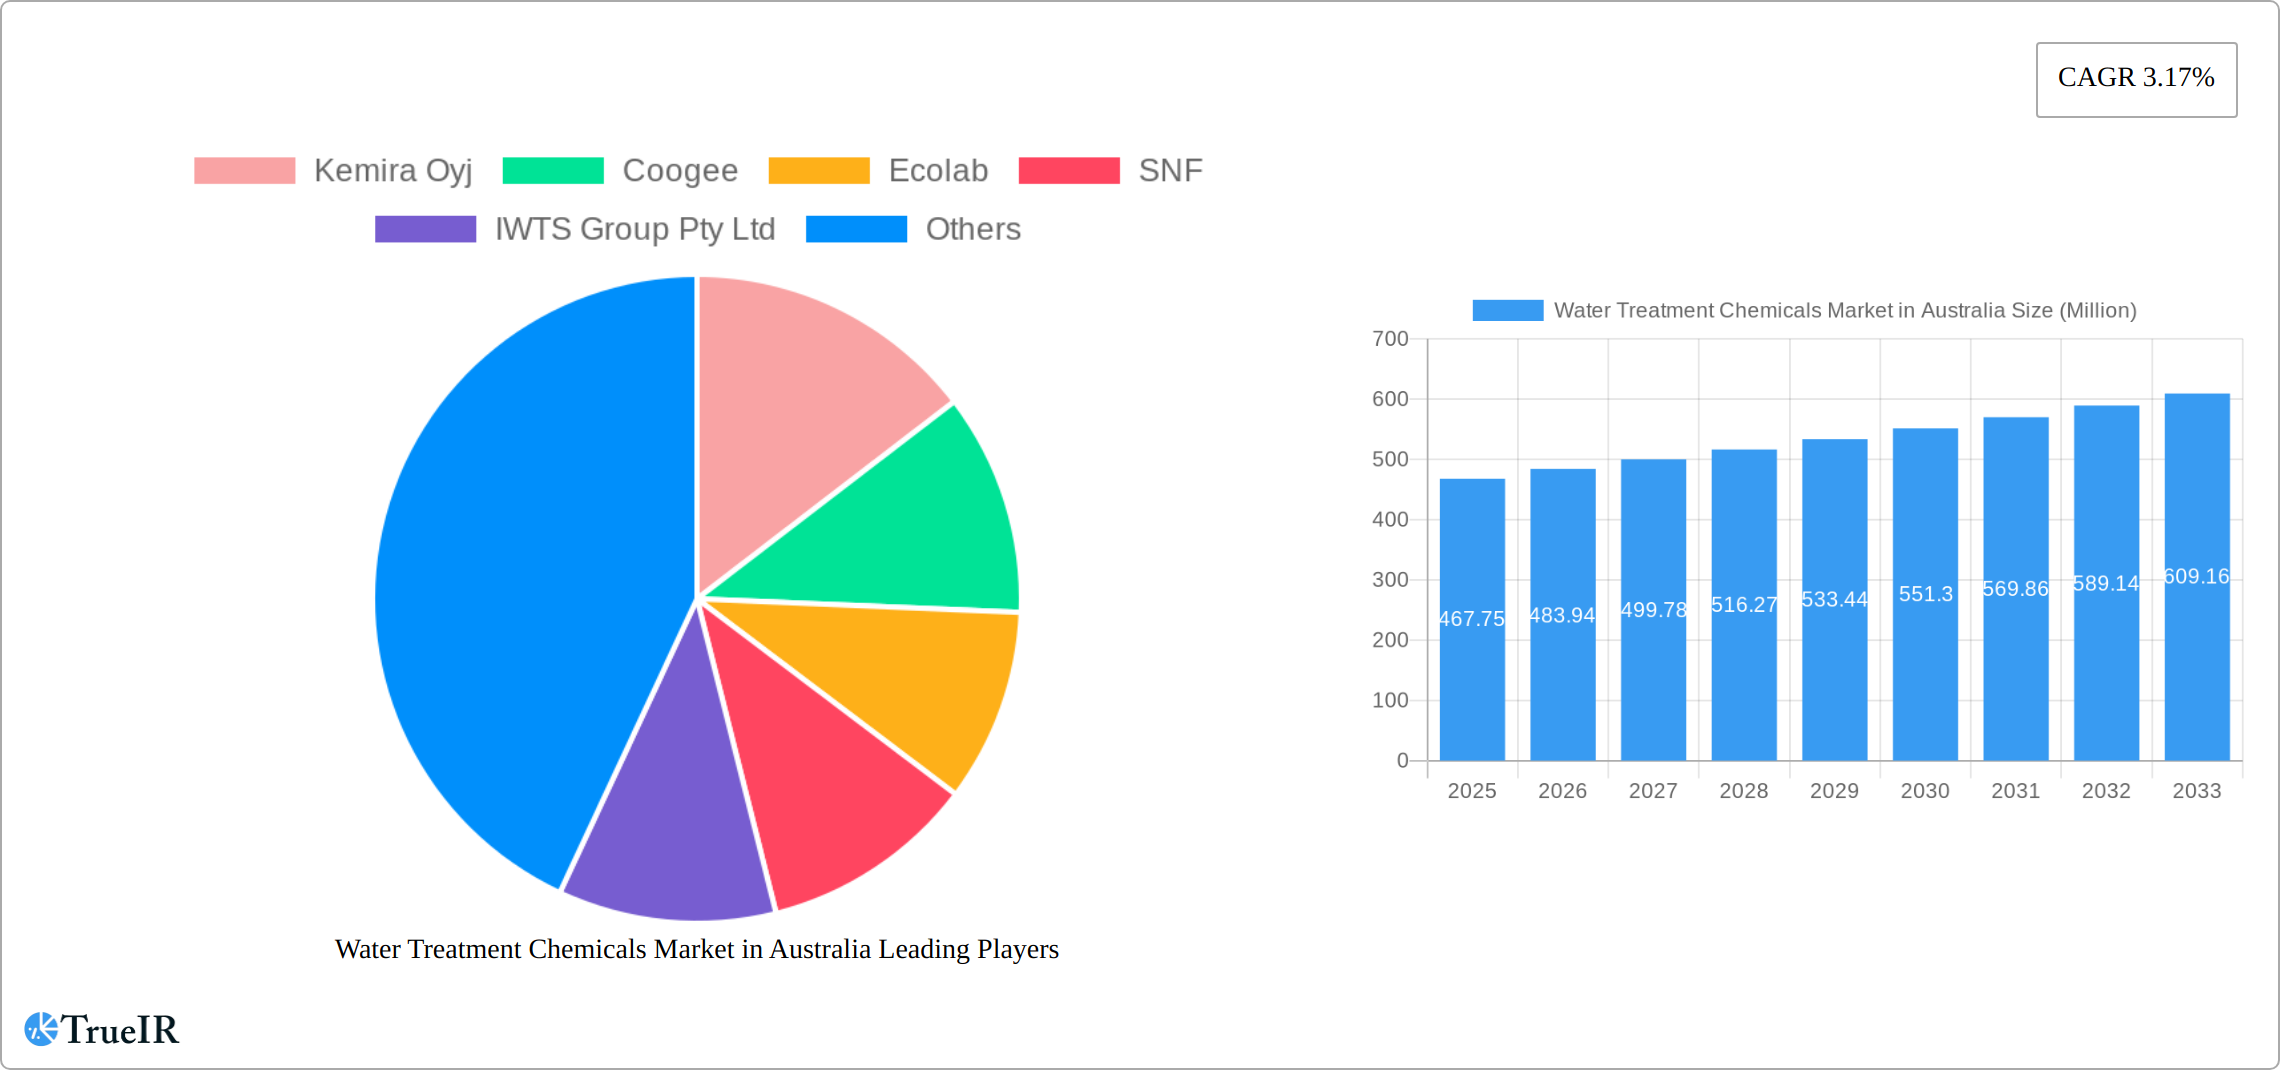
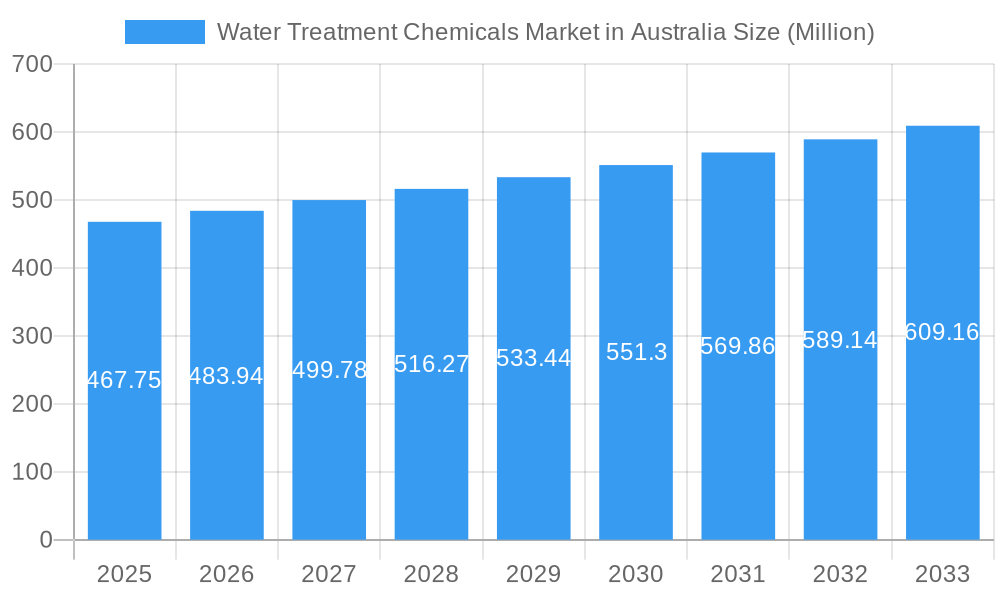
The Australian water treatment chemicals market, valued at $467.75 million in 2025, is projected to experience steady growth, driven by increasing industrialization, stringent environmental regulations, and the rising demand for potable water. The market's Compound Annual Growth Rate (CAGR) of 3.17% from 2019 to 2024 indicates a consistent upward trajectory. Key segments driving this growth include biocides and disinfectants, crucial for maintaining water quality, and coagulants and flocculants, essential for removing impurities. The power generation, oil and gas, and mining sectors are major end-users, contributing significantly to market demand. Growth is further fueled by the increasing adoption of advanced water treatment technologies and a growing focus on sustainable water management practices. While specific data on individual restraints is unavailable, potential challenges might include fluctuations in raw material prices and the competitive landscape characterized by both multinational corporations and regional players. However, the long-term outlook remains positive, given Australia's ongoing investments in infrastructure development and its commitment to water resource management.
Water Treatment Chemicals Market in Australia Market Size (In Million)
The market’s segmentation reveals a diverse landscape. Product types like corrosion and scale inhibitors, defoamers, and pH conditioners play significant roles, catering to specific needs within various end-user industries. Companies like Kemira Oyj, Ecolab, and Solvay hold significant market share, leveraging their technological expertise and established distribution networks. Regional variations within Australia might exist, influenced by factors such as population density and industrial activity. The forecast period (2025-2033) suggests continued expansion, influenced by consistent economic growth and the nation’s focus on water security. The market's positive trajectory is expected to attract further investment and innovation, leading to the development of more efficient and environmentally friendly water treatment solutions.
Water Treatment Chemicals Market in Australia Company Market Share
Water Treatment Chemicals Market in Australia: A Comprehensive Report (2019-2033)
This dynamic report provides a detailed analysis of the Australian water treatment chemicals market, offering invaluable insights for industry professionals, investors, and strategic decision-makers. Leveraging extensive market research and data analysis covering the period 2019-2033 (Base Year: 2025), this report unveils the market's structure, competitive landscape, key trends, and future prospects. The market is projected to reach xx Million by 2033, showcasing significant growth opportunities.
Water Treatment Chemicals Market in Australia Market Structure & Competitive Landscape
The Australian water treatment chemicals market exhibits a moderately concentrated structure, with several multinational corporations and regional players vying for market share. The Herfindahl-Hirschman Index (HHI) for 2024 is estimated at xx, indicating a moderately competitive landscape. Key players actively participate in mergers and acquisitions (M&A) to expand their market presence and product portfolios. The volume of M&A transactions in the sector between 2019 and 2024 totalled approximately xx deals, contributing to market consolidation.
Innovation is a crucial driver, with companies continuously developing sustainable and high-performance chemicals. Stringent environmental regulations are shaping market dynamics, favoring eco-friendly solutions. Product substitution is a considerable factor, driven by advancements in technology and the rising demand for sustainable alternatives. The market displays a diverse end-user segmentation, encompassing municipal water treatment, industrial applications (power generation, mining, food and beverage), and other sectors.
Water Treatment Chemicals Market in Australia Market Trends & Opportunities
The Australian water treatment chemicals market is experiencing robust and dynamic growth, projected to achieve a Compound Annual Growth Rate (CAGR) of approximately 7.5% during the forecast period (2025-2033). This significant expansion is primarily fueled by the confluence of increasing urbanization, continuous industrial development, and increasingly stringent water quality regulations mandated by government bodies. Furthermore, rapid technological advancements, such as the groundbreaking adoption of nanotechnology and the implementation of advanced oxidation processes, are actively creating novel and lucrative opportunities for market participants. The market is witnessing a pronounced and growing preference for sustainable and environmentally conscious water treatment solutions, compelling manufacturers to prioritize and accelerate innovation in this critical direction. Competitive dynamics remain intensely focused, with leading companies strategically concentrating on product differentiation, pioneering technological innovation, and forging strategic partnerships to secure and expand their competitive edge. Market penetration rates for eco-friendly and sustainable solutions are steadily and positively increasing, projected to reach around 45% by 2033.
Dominant Markets & Segments in Water Treatment Chemicals Market in Australia
The Municipal segment currently holds a dominant position within the end-user industry landscape, accounting for approximately 55% of the total market share in 2024. This strong dominance is directly attributable to substantial and ongoing investments in essential water infrastructure development and critical upgrades across various municipalities nationwide. Among the product types, Coagulants and Flocculants continue to command the largest market share, a trend driven by their indispensable and widespread application in fundamental water purification processes.
-
Key Growth Drivers for Municipal Segment:
- Sustained and increasing government investments in crucial water infrastructure projects.
- The implementation and enforcement of stringent regulations pertaining to water quality and effluent discharge standards.
- A rising societal awareness and proactive approach towards water conservation and the imperative for efficient water management practices.
-
Key Growth Drivers for Coagulants and Flocculants:
- A continuously growing demand originating from municipal water treatment plants.
- Expanding industrial applications across a diverse range of key sectors.
- Significant technological advancements that are consistently leading to higher levels of efficiency and enhanced efficacy.
A detailed regional analysis reveals a strong concentration of market activity and demand within the eastern states of Australia, primarily driven by higher population density and robust industrial activity in these regions.
Water Treatment Chemicals Market in Australia Product Analysis
The market is witnessing significant advancements in product innovation, with a focus on developing environmentally benign, highly efficient, and cost-effective solutions. Biocides are increasingly incorporating advanced formulations to enhance effectiveness against a wider range of pathogens. Coagulants and flocculants are seeing improvements in their performance under varying water conditions, enhancing their versatility. These advancements are driving increased market adoption and contributing to the market's overall growth trajectory.
Key Drivers, Barriers & Challenges in Water Treatment Chemicals Market in Australia
Key Drivers: The market is propelled by a combination of factors including stringent environmental regulations that actively promote and incentivize sustainable water treatment practices, increasing industrialization and rapid urbanization which collectively boost the demand for effective water treatment solutions, and continuous technological advancements that significantly enhance the overall efficiency and effectiveness of water treatment chemicals.
Challenges: Significant challenges persist, including potential supply chain disruptions that can impact the availability and cost of essential raw materials, intense competition from both well-established domestic and emerging international players, and the persistent need for continuous and substantial investment in research and development to adapt to the ever-evolving regulatory landscape and dynamic consumer demands. The cumulative impact of these challenges is estimated to potentially temper the overall market growth by approximately 5-8% by 2033.
Growth Drivers in the Water Treatment Chemicals Market in Australia Market
Government initiatives promoting sustainable water management, increasing investments in water infrastructure projects, and rising demand from various industrial sectors are key growth drivers.
Challenges Impacting Water Treatment Chemicals Market in Australia Growth
Navigating regulatory hurdles associated with chemical approvals and the adherence to stringent safety standards, managing fluctuations in raw material prices, and contending with intense competition from both established industry giants and agile emerging players represent the principal challenges currently impacting the robust growth of the Australian water treatment chemicals market.
Key Players Shaping the Water Treatment Chemicals Market in Australia Market
- Kemira Oyj
- Coogee
- Ecolab
- SNF
- IWTS Group Pty Ltd
- Solvay
- Buckman
- Aquasol
- Dow
- Solenis
- Ixom
- Albemarle Corporation
- Veolia (Veolia Water Technologies)
Significant Water Treatment Chemicals Market in Australia Industry Milestones
- June 2022: Kemira Oyj and Veolia launch ViviMag technology for phosphorus recovery from sewage sludge.
- April 2022: Veolia Group partners with Sydney Water to explore circular economy opportunities for sustainable water services.
Future Outlook for Water Treatment Chemicals Market in Australia Market
The Australian water treatment chemicals market is strongly poised for continued and sustained growth in the foreseeable future. This positive trajectory will be primarily driven by ongoing and substantial investments in critical water infrastructure, increasing demand from a diverse array of end-use industries, and the unwavering global and national focus on developing and implementing sustainable and eco-friendly water treatment solutions. Strategic partnerships, continued technological innovations, and targeted expansion into specialized niche segments present significant and exciting opportunities for forward-thinking market players. The market is confidently expected to maintain a robust and upward growth trajectory throughout the entire forecast period.
Water Treatment Chemicals Market in Australia Segmentation
-
1. Product Type
- 1.1. Biocides and Disinfectants
- 1.2. Coagulants and Flocculants
- 1.3. Corrosion and Scale Inhibitors
- 1.4. Defoamers and Defoaming Agents
- 1.5. pH Conditioners/Adjusters
- 1.6. Other Product Types
-
2. End-user Industry
- 2.1. Power Generation
- 2.2. Oil and Gas
- 2.3. Chemical Manufacturing
- 2.4. Mining and Mineral Processing
- 2.5. Municipal
- 2.6. Food and Beverage
- 2.7. Pulp and Paper
- 2.8. Other End-user Industries
Water Treatment Chemicals Market in Australia Segmentation By Geography
-
1. North America
- 1.1. United States
- 1.2. Canada
- 1.3. Mexico
-
2. South America
- 2.1. Brazil
- 2.2. Argentina
- 2.3. Rest of South America
-
3. Europe
- 3.1. United Kingdom
- 3.2. Germany
- 3.3. France
- 3.4. Italy
- 3.5. Spain
- 3.6. Russia
- 3.7. Benelux
- 3.8. Nordics
- 3.9. Rest of Europe
-
4. Middle East & Africa
- 4.1. Turkey
- 4.2. Israel
- 4.3. GCC
- 4.4. North Africa
- 4.5. South Africa
- 4.6. Rest of Middle East & Africa
-
5. Asia Pacific
- 5.1. China
- 5.2. India
- 5.3. Japan
- 5.4. South Korea
- 5.5. ASEAN
- 5.6. Oceania
- 5.7. Rest of Asia Pacific
Water Treatment Chemicals Market in Australia Regional Market Share
Geographic Coverage of Water Treatment Chemicals Market in Australia
Water Treatment Chemicals Market in Australia REPORT HIGHLIGHTS
| Aspects | Details |
|---|---|
| Study Period | 2020-2034 |
| Base Year | 2025 |
| Estimated Year | 2026 |
| Forecast Period | 2026-2034 |
| Historical Period | 2020-2025 |
| Growth Rate | CAGR of 3.17% from 2020-2034 |
| Segmentation |
|
Table of Contents
- 1. Introduction
- 1.1. Research Scope
- 1.2. Market Segmentation
- 1.3. Research Objective
- 1.4. Definitions and Assumptions
- 2. Executive Summary
- 2.1. Market Snapshot
- 3. Market Dynamics
- 3.1. Market Drivers
- 3.2. Market Restrains
- 3.3. Market Trends
- 3.4. Market Opportunities
- 4. Market Factor Analysis
- 4.1. Porters Five Forces
- 4.1.1. Bargaining Power of Suppliers
- 4.1.2. Bargaining Power of Buyers
- 4.1.3. Threat of New Entrants
- 4.1.4. Threat of Substitutes
- 4.1.5. Competitive Rivalry
- 4.2. PESTEL analysis
- 4.3. BCG Analysis
- 4.3.1. Stars (High Growth, High Market Share)
- 4.3.2. Cash Cows (Low Growth, High Market Share)
- 4.3.3. Question Mark (High Growth, Low Market Share)
- 4.3.4. Dogs (Low Growth, Low Market Share)
- 4.4. Ansoff Matrix Analysis
- 4.5. Supply Chain Analysis
- 4.6. Regulatory Landscape
- 4.7. Current Market Potential and Opportunity Assessment (TAM–SAM–SOM Framework)
- 4.8. TIR Analyst Note
- 4.1. Porters Five Forces
- 5. Market Analysis, Insights and Forecast 2021-2033
- 5.1. Market Analysis, Insights and Forecast - by Product Type
- 5.1.1. Biocides and Disinfectants
- 5.1.2. Coagulants and Flocculants
- 5.1.3. Corrosion and Scale Inhibitors
- 5.1.4. Defoamers and Defoaming Agents
- 5.1.5. pH Conditioners/Adjusters
- 5.1.6. Other Product Types
- 5.2. Market Analysis, Insights and Forecast - by End-user Industry
- 5.2.1. Power Generation
- 5.2.2. Oil and Gas
- 5.2.3. Chemical Manufacturing
- 5.2.4. Mining and Mineral Processing
- 5.2.5. Municipal
- 5.2.6. Food and Beverage
- 5.2.7. Pulp and Paper
- 5.2.8. Other End-user Industries
- 5.3. Market Analysis, Insights and Forecast - by Region
- 5.3.1. North America
- 5.3.2. South America
- 5.3.3. Europe
- 5.3.4. Middle East & Africa
- 5.3.5. Asia Pacific
- 5.1. Market Analysis, Insights and Forecast - by Product Type
- 6. Global Water Treatment Chemicals Market in Australia Analysis, Insights and Forecast, 2021-2033
- 6.1. Market Analysis, Insights and Forecast - by Product Type
- 6.1.1. Biocides and Disinfectants
- 6.1.2. Coagulants and Flocculants
- 6.1.3. Corrosion and Scale Inhibitors
- 6.1.4. Defoamers and Defoaming Agents
- 6.1.5. pH Conditioners/Adjusters
- 6.1.6. Other Product Types
- 6.2. Market Analysis, Insights and Forecast - by End-user Industry
- 6.2.1. Power Generation
- 6.2.2. Oil and Gas
- 6.2.3. Chemical Manufacturing
- 6.2.4. Mining and Mineral Processing
- 6.2.5. Municipal
- 6.2.6. Food and Beverage
- 6.2.7. Pulp and Paper
- 6.2.8. Other End-user Industries
- 6.1. Market Analysis, Insights and Forecast - by Product Type
- 7. North America Water Treatment Chemicals Market in Australia Analysis, Insights and Forecast, 2020-2032
- 7.1. Market Analysis, Insights and Forecast - by Product Type
- 7.1.1. Biocides and Disinfectants
- 7.1.2. Coagulants and Flocculants
- 7.1.3. Corrosion and Scale Inhibitors
- 7.1.4. Defoamers and Defoaming Agents
- 7.1.5. pH Conditioners/Adjusters
- 7.1.6. Other Product Types
- 7.2. Market Analysis, Insights and Forecast - by End-user Industry
- 7.2.1. Power Generation
- 7.2.2. Oil and Gas
- 7.2.3. Chemical Manufacturing
- 7.2.4. Mining and Mineral Processing
- 7.2.5. Municipal
- 7.2.6. Food and Beverage
- 7.2.7. Pulp and Paper
- 7.2.8. Other End-user Industries
- 7.1. Market Analysis, Insights and Forecast - by Product Type
- 8. South America Water Treatment Chemicals Market in Australia Analysis, Insights and Forecast, 2020-2032
- 8.1. Market Analysis, Insights and Forecast - by Product Type
- 8.1.1. Biocides and Disinfectants
- 8.1.2. Coagulants and Flocculants
- 8.1.3. Corrosion and Scale Inhibitors
- 8.1.4. Defoamers and Defoaming Agents
- 8.1.5. pH Conditioners/Adjusters
- 8.1.6. Other Product Types
- 8.2. Market Analysis, Insights and Forecast - by End-user Industry
- 8.2.1. Power Generation
- 8.2.2. Oil and Gas
- 8.2.3. Chemical Manufacturing
- 8.2.4. Mining and Mineral Processing
- 8.2.5. Municipal
- 8.2.6. Food and Beverage
- 8.2.7. Pulp and Paper
- 8.2.8. Other End-user Industries
- 8.1. Market Analysis, Insights and Forecast - by Product Type
- 9. Europe Water Treatment Chemicals Market in Australia Analysis, Insights and Forecast, 2020-2032
- 9.1. Market Analysis, Insights and Forecast - by Product Type
- 9.1.1. Biocides and Disinfectants
- 9.1.2. Coagulants and Flocculants
- 9.1.3. Corrosion and Scale Inhibitors
- 9.1.4. Defoamers and Defoaming Agents
- 9.1.5. pH Conditioners/Adjusters
- 9.1.6. Other Product Types
- 9.2. Market Analysis, Insights and Forecast - by End-user Industry
- 9.2.1. Power Generation
- 9.2.2. Oil and Gas
- 9.2.3. Chemical Manufacturing
- 9.2.4. Mining and Mineral Processing
- 9.2.5. Municipal
- 9.2.6. Food and Beverage
- 9.2.7. Pulp and Paper
- 9.2.8. Other End-user Industries
- 9.1. Market Analysis, Insights and Forecast - by Product Type
- 10. Middle East & Africa Water Treatment Chemicals Market in Australia Analysis, Insights and Forecast, 2020-2032
- 10.1. Market Analysis, Insights and Forecast - by Product Type
- 10.1.1. Biocides and Disinfectants
- 10.1.2. Coagulants and Flocculants
- 10.1.3. Corrosion and Scale Inhibitors
- 10.1.4. Defoamers and Defoaming Agents
- 10.1.5. pH Conditioners/Adjusters
- 10.1.6. Other Product Types
- 10.2. Market Analysis, Insights and Forecast - by End-user Industry
- 10.2.1. Power Generation
- 10.2.2. Oil and Gas
- 10.2.3. Chemical Manufacturing
- 10.2.4. Mining and Mineral Processing
- 10.2.5. Municipal
- 10.2.6. Food and Beverage
- 10.2.7. Pulp and Paper
- 10.2.8. Other End-user Industries
- 10.1. Market Analysis, Insights and Forecast - by Product Type
- 11. Asia Pacific Water Treatment Chemicals Market in Australia Analysis, Insights and Forecast, 2020-2032
- 11.1. Market Analysis, Insights and Forecast - by Product Type
- 11.1.1. Biocides and Disinfectants
- 11.1.2. Coagulants and Flocculants
- 11.1.3. Corrosion and Scale Inhibitors
- 11.1.4. Defoamers and Defoaming Agents
- 11.1.5. pH Conditioners/Adjusters
- 11.1.6. Other Product Types
- 11.2. Market Analysis, Insights and Forecast - by End-user Industry
- 11.2.1. Power Generation
- 11.2.2. Oil and Gas
- 11.2.3. Chemical Manufacturing
- 11.2.4. Mining and Mineral Processing
- 11.2.5. Municipal
- 11.2.6. Food and Beverage
- 11.2.7. Pulp and Paper
- 11.2.8. Other End-user Industries
- 11.1. Market Analysis, Insights and Forecast - by Product Type
- 12. Competitive Analysis
- 12.1. Company Profiles
- 12.1.1 Kemira Oyj
- 12.1.1.1. Company Overview
- 12.1.1.2. Products
- 12.1.1.3. Company Financials
- 12.1.1.4. SWOT Analysis
- 12.1.2 Coogee
- 12.1.2.1. Company Overview
- 12.1.2.2. Products
- 12.1.2.3. Company Financials
- 12.1.2.4. SWOT Analysis
- 12.1.3 Ecolab
- 12.1.3.1. Company Overview
- 12.1.3.2. Products
- 12.1.3.3. Company Financials
- 12.1.3.4. SWOT Analysis
- 12.1.4 SNF
- 12.1.4.1. Company Overview
- 12.1.4.2. Products
- 12.1.4.3. Company Financials
- 12.1.4.4. SWOT Analysis
- 12.1.5 IWTS Group Pty Ltd
- 12.1.5.1. Company Overview
- 12.1.5.2. Products
- 12.1.5.3. Company Financials
- 12.1.5.4. SWOT Analysis
- 12.1.6 Solvay
- 12.1.6.1. Company Overview
- 12.1.6.2. Products
- 12.1.6.3. Company Financials
- 12.1.6.4. SWOT Analysis
- 12.1.7 Buckman
- 12.1.7.1. Company Overview
- 12.1.7.2. Products
- 12.1.7.3. Company Financials
- 12.1.7.4. SWOT Analysis
- 12.1.8 Aquasol
- 12.1.8.1. Company Overview
- 12.1.8.2. Products
- 12.1.8.3. Company Financials
- 12.1.8.4. SWOT Analysis
- 12.1.9 Dow
- 12.1.9.1. Company Overview
- 12.1.9.2. Products
- 12.1.9.3. Company Financials
- 12.1.9.4. SWOT Analysis
- 12.1.10 Solenis
- 12.1.10.1. Company Overview
- 12.1.10.2. Products
- 12.1.10.3. Company Financials
- 12.1.10.4. SWOT Analysis
- 12.1.11 Ixom
- 12.1.11.1. Company Overview
- 12.1.11.2. Products
- 12.1.11.3. Company Financials
- 12.1.11.4. SWOT Analysis
- 12.1.12 Albemarle Corporation
- 12.1.12.1. Company Overview
- 12.1.12.2. Products
- 12.1.12.3. Company Financials
- 12.1.12.4. SWOT Analysis
- 12.1.13 Veolia (Veolia Water Technologies)
- 12.1.13.1. Company Overview
- 12.1.13.2. Products
- 12.1.13.3. Company Financials
- 12.1.13.4. SWOT Analysis
- 12.1.1 Kemira Oyj
- 12.2. Market Entropy
- 12.2.1 Company's Key Areas Served
- 12.2.2 Recent Developments
- 12.3. Company Market Share Analysis 2025
- 12.3.1 Top 5 Companies Market Share Analysis
- 12.3.2 Top 3 Companies Market Share Analysis
- 12.4. List of Potential Customers
- 13. Research Methodology
List of Figures
- Figure 1: Global Water Treatment Chemicals Market in Australia Revenue Breakdown (Million, %) by Region 2025 & 2033
- Figure 2: Global Water Treatment Chemicals Market in Australia Volume Breakdown (K Tons, %) by Region 2025 & 2033
- Figure 3: North America Water Treatment Chemicals Market in Australia Revenue (Million), by Product Type 2025 & 2033
- Figure 4: North America Water Treatment Chemicals Market in Australia Volume (K Tons), by Product Type 2025 & 2033
- Figure 5: North America Water Treatment Chemicals Market in Australia Revenue Share (%), by Product Type 2025 & 2033
- Figure 6: North America Water Treatment Chemicals Market in Australia Volume Share (%), by Product Type 2025 & 2033
- Figure 7: North America Water Treatment Chemicals Market in Australia Revenue (Million), by End-user Industry 2025 & 2033
- Figure 8: North America Water Treatment Chemicals Market in Australia Volume (K Tons), by End-user Industry 2025 & 2033
- Figure 9: North America Water Treatment Chemicals Market in Australia Revenue Share (%), by End-user Industry 2025 & 2033
- Figure 10: North America Water Treatment Chemicals Market in Australia Volume Share (%), by End-user Industry 2025 & 2033
- Figure 11: North America Water Treatment Chemicals Market in Australia Revenue (Million), by Country 2025 & 2033
- Figure 12: North America Water Treatment Chemicals Market in Australia Volume (K Tons), by Country 2025 & 2033
- Figure 13: North America Water Treatment Chemicals Market in Australia Revenue Share (%), by Country 2025 & 2033
- Figure 14: North America Water Treatment Chemicals Market in Australia Volume Share (%), by Country 2025 & 2033
- Figure 15: South America Water Treatment Chemicals Market in Australia Revenue (Million), by Product Type 2025 & 2033
- Figure 16: South America Water Treatment Chemicals Market in Australia Volume (K Tons), by Product Type 2025 & 2033
- Figure 17: South America Water Treatment Chemicals Market in Australia Revenue Share (%), by Product Type 2025 & 2033
- Figure 18: South America Water Treatment Chemicals Market in Australia Volume Share (%), by Product Type 2025 & 2033
- Figure 19: South America Water Treatment Chemicals Market in Australia Revenue (Million), by End-user Industry 2025 & 2033
- Figure 20: South America Water Treatment Chemicals Market in Australia Volume (K Tons), by End-user Industry 2025 & 2033
- Figure 21: South America Water Treatment Chemicals Market in Australia Revenue Share (%), by End-user Industry 2025 & 2033
- Figure 22: South America Water Treatment Chemicals Market in Australia Volume Share (%), by End-user Industry 2025 & 2033
- Figure 23: South America Water Treatment Chemicals Market in Australia Revenue (Million), by Country 2025 & 2033
- Figure 24: South America Water Treatment Chemicals Market in Australia Volume (K Tons), by Country 2025 & 2033
- Figure 25: South America Water Treatment Chemicals Market in Australia Revenue Share (%), by Country 2025 & 2033
- Figure 26: South America Water Treatment Chemicals Market in Australia Volume Share (%), by Country 2025 & 2033
- Figure 27: Europe Water Treatment Chemicals Market in Australia Revenue (Million), by Product Type 2025 & 2033
- Figure 28: Europe Water Treatment Chemicals Market in Australia Volume (K Tons), by Product Type 2025 & 2033
- Figure 29: Europe Water Treatment Chemicals Market in Australia Revenue Share (%), by Product Type 2025 & 2033
- Figure 30: Europe Water Treatment Chemicals Market in Australia Volume Share (%), by Product Type 2025 & 2033
- Figure 31: Europe Water Treatment Chemicals Market in Australia Revenue (Million), by End-user Industry 2025 & 2033
- Figure 32: Europe Water Treatment Chemicals Market in Australia Volume (K Tons), by End-user Industry 2025 & 2033
- Figure 33: Europe Water Treatment Chemicals Market in Australia Revenue Share (%), by End-user Industry 2025 & 2033
- Figure 34: Europe Water Treatment Chemicals Market in Australia Volume Share (%), by End-user Industry 2025 & 2033
- Figure 35: Europe Water Treatment Chemicals Market in Australia Revenue (Million), by Country 2025 & 2033
- Figure 36: Europe Water Treatment Chemicals Market in Australia Volume (K Tons), by Country 2025 & 2033
- Figure 37: Europe Water Treatment Chemicals Market in Australia Revenue Share (%), by Country 2025 & 2033
- Figure 38: Europe Water Treatment Chemicals Market in Australia Volume Share (%), by Country 2025 & 2033
- Figure 39: Middle East & Africa Water Treatment Chemicals Market in Australia Revenue (Million), by Product Type 2025 & 2033
- Figure 40: Middle East & Africa Water Treatment Chemicals Market in Australia Volume (K Tons), by Product Type 2025 & 2033
- Figure 41: Middle East & Africa Water Treatment Chemicals Market in Australia Revenue Share (%), by Product Type 2025 & 2033
- Figure 42: Middle East & Africa Water Treatment Chemicals Market in Australia Volume Share (%), by Product Type 2025 & 2033
- Figure 43: Middle East & Africa Water Treatment Chemicals Market in Australia Revenue (Million), by End-user Industry 2025 & 2033
- Figure 44: Middle East & Africa Water Treatment Chemicals Market in Australia Volume (K Tons), by End-user Industry 2025 & 2033
- Figure 45: Middle East & Africa Water Treatment Chemicals Market in Australia Revenue Share (%), by End-user Industry 2025 & 2033
- Figure 46: Middle East & Africa Water Treatment Chemicals Market in Australia Volume Share (%), by End-user Industry 2025 & 2033
- Figure 47: Middle East & Africa Water Treatment Chemicals Market in Australia Revenue (Million), by Country 2025 & 2033
- Figure 48: Middle East & Africa Water Treatment Chemicals Market in Australia Volume (K Tons), by Country 2025 & 2033
- Figure 49: Middle East & Africa Water Treatment Chemicals Market in Australia Revenue Share (%), by Country 2025 & 2033
- Figure 50: Middle East & Africa Water Treatment Chemicals Market in Australia Volume Share (%), by Country 2025 & 2033
- Figure 51: Asia Pacific Water Treatment Chemicals Market in Australia Revenue (Million), by Product Type 2025 & 2033
- Figure 52: Asia Pacific Water Treatment Chemicals Market in Australia Volume (K Tons), by Product Type 2025 & 2033
- Figure 53: Asia Pacific Water Treatment Chemicals Market in Australia Revenue Share (%), by Product Type 2025 & 2033
- Figure 54: Asia Pacific Water Treatment Chemicals Market in Australia Volume Share (%), by Product Type 2025 & 2033
- Figure 55: Asia Pacific Water Treatment Chemicals Market in Australia Revenue (Million), by End-user Industry 2025 & 2033
- Figure 56: Asia Pacific Water Treatment Chemicals Market in Australia Volume (K Tons), by End-user Industry 2025 & 2033
- Figure 57: Asia Pacific Water Treatment Chemicals Market in Australia Revenue Share (%), by End-user Industry 2025 & 2033
- Figure 58: Asia Pacific Water Treatment Chemicals Market in Australia Volume Share (%), by End-user Industry 2025 & 2033
- Figure 59: Asia Pacific Water Treatment Chemicals Market in Australia Revenue (Million), by Country 2025 & 2033
- Figure 60: Asia Pacific Water Treatment Chemicals Market in Australia Volume (K Tons), by Country 2025 & 2033
- Figure 61: Asia Pacific Water Treatment Chemicals Market in Australia Revenue Share (%), by Country 2025 & 2033
- Figure 62: Asia Pacific Water Treatment Chemicals Market in Australia Volume Share (%), by Country 2025 & 2033
List of Tables
- Table 1: Global Water Treatment Chemicals Market in Australia Revenue Million Forecast, by Product Type 2020 & 2033
- Table 2: Global Water Treatment Chemicals Market in Australia Volume K Tons Forecast, by Product Type 2020 & 2033
- Table 3: Global Water Treatment Chemicals Market in Australia Revenue Million Forecast, by End-user Industry 2020 & 2033
- Table 4: Global Water Treatment Chemicals Market in Australia Volume K Tons Forecast, by End-user Industry 2020 & 2033
- Table 5: Global Water Treatment Chemicals Market in Australia Revenue Million Forecast, by Region 2020 & 2033
- Table 6: Global Water Treatment Chemicals Market in Australia Volume K Tons Forecast, by Region 2020 & 2033
- Table 7: Global Water Treatment Chemicals Market in Australia Revenue Million Forecast, by Product Type 2020 & 2033
- Table 8: Global Water Treatment Chemicals Market in Australia Volume K Tons Forecast, by Product Type 2020 & 2033
- Table 9: Global Water Treatment Chemicals Market in Australia Revenue Million Forecast, by End-user Industry 2020 & 2033
- Table 10: Global Water Treatment Chemicals Market in Australia Volume K Tons Forecast, by End-user Industry 2020 & 2033
- Table 11: Global Water Treatment Chemicals Market in Australia Revenue Million Forecast, by Country 2020 & 2033
- Table 12: Global Water Treatment Chemicals Market in Australia Volume K Tons Forecast, by Country 2020 & 2033
- Table 13: United States Water Treatment Chemicals Market in Australia Revenue (Million) Forecast, by Application 2020 & 2033
- Table 14: United States Water Treatment Chemicals Market in Australia Volume (K Tons) Forecast, by Application 2020 & 2033
- Table 15: Canada Water Treatment Chemicals Market in Australia Revenue (Million) Forecast, by Application 2020 & 2033
- Table 16: Canada Water Treatment Chemicals Market in Australia Volume (K Tons) Forecast, by Application 2020 & 2033
- Table 17: Mexico Water Treatment Chemicals Market in Australia Revenue (Million) Forecast, by Application 2020 & 2033
- Table 18: Mexico Water Treatment Chemicals Market in Australia Volume (K Tons) Forecast, by Application 2020 & 2033
- Table 19: Global Water Treatment Chemicals Market in Australia Revenue Million Forecast, by Product Type 2020 & 2033
- Table 20: Global Water Treatment Chemicals Market in Australia Volume K Tons Forecast, by Product Type 2020 & 2033
- Table 21: Global Water Treatment Chemicals Market in Australia Revenue Million Forecast, by End-user Industry 2020 & 2033
- Table 22: Global Water Treatment Chemicals Market in Australia Volume K Tons Forecast, by End-user Industry 2020 & 2033
- Table 23: Global Water Treatment Chemicals Market in Australia Revenue Million Forecast, by Country 2020 & 2033
- Table 24: Global Water Treatment Chemicals Market in Australia Volume K Tons Forecast, by Country 2020 & 2033
- Table 25: Brazil Water Treatment Chemicals Market in Australia Revenue (Million) Forecast, by Application 2020 & 2033
- Table 26: Brazil Water Treatment Chemicals Market in Australia Volume (K Tons) Forecast, by Application 2020 & 2033
- Table 27: Argentina Water Treatment Chemicals Market in Australia Revenue (Million) Forecast, by Application 2020 & 2033
- Table 28: Argentina Water Treatment Chemicals Market in Australia Volume (K Tons) Forecast, by Application 2020 & 2033
- Table 29: Rest of South America Water Treatment Chemicals Market in Australia Revenue (Million) Forecast, by Application 2020 & 2033
- Table 30: Rest of South America Water Treatment Chemicals Market in Australia Volume (K Tons) Forecast, by Application 2020 & 2033
- Table 31: Global Water Treatment Chemicals Market in Australia Revenue Million Forecast, by Product Type 2020 & 2033
- Table 32: Global Water Treatment Chemicals Market in Australia Volume K Tons Forecast, by Product Type 2020 & 2033
- Table 33: Global Water Treatment Chemicals Market in Australia Revenue Million Forecast, by End-user Industry 2020 & 2033
- Table 34: Global Water Treatment Chemicals Market in Australia Volume K Tons Forecast, by End-user Industry 2020 & 2033
- Table 35: Global Water Treatment Chemicals Market in Australia Revenue Million Forecast, by Country 2020 & 2033
- Table 36: Global Water Treatment Chemicals Market in Australia Volume K Tons Forecast, by Country 2020 & 2033
- Table 37: United Kingdom Water Treatment Chemicals Market in Australia Revenue (Million) Forecast, by Application 2020 & 2033
- Table 38: United Kingdom Water Treatment Chemicals Market in Australia Volume (K Tons) Forecast, by Application 2020 & 2033
- Table 39: Germany Water Treatment Chemicals Market in Australia Revenue (Million) Forecast, by Application 2020 & 2033
- Table 40: Germany Water Treatment Chemicals Market in Australia Volume (K Tons) Forecast, by Application 2020 & 2033
- Table 41: France Water Treatment Chemicals Market in Australia Revenue (Million) Forecast, by Application 2020 & 2033
- Table 42: France Water Treatment Chemicals Market in Australia Volume (K Tons) Forecast, by Application 2020 & 2033
- Table 43: Italy Water Treatment Chemicals Market in Australia Revenue (Million) Forecast, by Application 2020 & 2033
- Table 44: Italy Water Treatment Chemicals Market in Australia Volume (K Tons) Forecast, by Application 2020 & 2033
- Table 45: Spain Water Treatment Chemicals Market in Australia Revenue (Million) Forecast, by Application 2020 & 2033
- Table 46: Spain Water Treatment Chemicals Market in Australia Volume (K Tons) Forecast, by Application 2020 & 2033
- Table 47: Russia Water Treatment Chemicals Market in Australia Revenue (Million) Forecast, by Application 2020 & 2033
- Table 48: Russia Water Treatment Chemicals Market in Australia Volume (K Tons) Forecast, by Application 2020 & 2033
- Table 49: Benelux Water Treatment Chemicals Market in Australia Revenue (Million) Forecast, by Application 2020 & 2033
- Table 50: Benelux Water Treatment Chemicals Market in Australia Volume (K Tons) Forecast, by Application 2020 & 2033
- Table 51: Nordics Water Treatment Chemicals Market in Australia Revenue (Million) Forecast, by Application 2020 & 2033
- Table 52: Nordics Water Treatment Chemicals Market in Australia Volume (K Tons) Forecast, by Application 2020 & 2033
- Table 53: Rest of Europe Water Treatment Chemicals Market in Australia Revenue (Million) Forecast, by Application 2020 & 2033
- Table 54: Rest of Europe Water Treatment Chemicals Market in Australia Volume (K Tons) Forecast, by Application 2020 & 2033
- Table 55: Global Water Treatment Chemicals Market in Australia Revenue Million Forecast, by Product Type 2020 & 2033
- Table 56: Global Water Treatment Chemicals Market in Australia Volume K Tons Forecast, by Product Type 2020 & 2033
- Table 57: Global Water Treatment Chemicals Market in Australia Revenue Million Forecast, by End-user Industry 2020 & 2033
- Table 58: Global Water Treatment Chemicals Market in Australia Volume K Tons Forecast, by End-user Industry 2020 & 2033
- Table 59: Global Water Treatment Chemicals Market in Australia Revenue Million Forecast, by Country 2020 & 2033
- Table 60: Global Water Treatment Chemicals Market in Australia Volume K Tons Forecast, by Country 2020 & 2033
- Table 61: Turkey Water Treatment Chemicals Market in Australia Revenue (Million) Forecast, by Application 2020 & 2033
- Table 62: Turkey Water Treatment Chemicals Market in Australia Volume (K Tons) Forecast, by Application 2020 & 2033
- Table 63: Israel Water Treatment Chemicals Market in Australia Revenue (Million) Forecast, by Application 2020 & 2033
- Table 64: Israel Water Treatment Chemicals Market in Australia Volume (K Tons) Forecast, by Application 2020 & 2033
- Table 65: GCC Water Treatment Chemicals Market in Australia Revenue (Million) Forecast, by Application 2020 & 2033
- Table 66: GCC Water Treatment Chemicals Market in Australia Volume (K Tons) Forecast, by Application 2020 & 2033
- Table 67: North Africa Water Treatment Chemicals Market in Australia Revenue (Million) Forecast, by Application 2020 & 2033
- Table 68: North Africa Water Treatment Chemicals Market in Australia Volume (K Tons) Forecast, by Application 2020 & 2033
- Table 69: South Africa Water Treatment Chemicals Market in Australia Revenue (Million) Forecast, by Application 2020 & 2033
- Table 70: South Africa Water Treatment Chemicals Market in Australia Volume (K Tons) Forecast, by Application 2020 & 2033
- Table 71: Rest of Middle East & Africa Water Treatment Chemicals Market in Australia Revenue (Million) Forecast, by Application 2020 & 2033
- Table 72: Rest of Middle East & Africa Water Treatment Chemicals Market in Australia Volume (K Tons) Forecast, by Application 2020 & 2033
- Table 73: Global Water Treatment Chemicals Market in Australia Revenue Million Forecast, by Product Type 2020 & 2033
- Table 74: Global Water Treatment Chemicals Market in Australia Volume K Tons Forecast, by Product Type 2020 & 2033
- Table 75: Global Water Treatment Chemicals Market in Australia Revenue Million Forecast, by End-user Industry 2020 & 2033
- Table 76: Global Water Treatment Chemicals Market in Australia Volume K Tons Forecast, by End-user Industry 2020 & 2033
- Table 77: Global Water Treatment Chemicals Market in Australia Revenue Million Forecast, by Country 2020 & 2033
- Table 78: Global Water Treatment Chemicals Market in Australia Volume K Tons Forecast, by Country 2020 & 2033
- Table 79: China Water Treatment Chemicals Market in Australia Revenue (Million) Forecast, by Application 2020 & 2033
- Table 80: China Water Treatment Chemicals Market in Australia Volume (K Tons) Forecast, by Application 2020 & 2033
- Table 81: India Water Treatment Chemicals Market in Australia Revenue (Million) Forecast, by Application 2020 & 2033
- Table 82: India Water Treatment Chemicals Market in Australia Volume (K Tons) Forecast, by Application 2020 & 2033
- Table 83: Japan Water Treatment Chemicals Market in Australia Revenue (Million) Forecast, by Application 2020 & 2033
- Table 84: Japan Water Treatment Chemicals Market in Australia Volume (K Tons) Forecast, by Application 2020 & 2033
- Table 85: South Korea Water Treatment Chemicals Market in Australia Revenue (Million) Forecast, by Application 2020 & 2033
- Table 86: South Korea Water Treatment Chemicals Market in Australia Volume (K Tons) Forecast, by Application 2020 & 2033
- Table 87: ASEAN Water Treatment Chemicals Market in Australia Revenue (Million) Forecast, by Application 2020 & 2033
- Table 88: ASEAN Water Treatment Chemicals Market in Australia Volume (K Tons) Forecast, by Application 2020 & 2033
- Table 89: Oceania Water Treatment Chemicals Market in Australia Revenue (Million) Forecast, by Application 2020 & 2033
- Table 90: Oceania Water Treatment Chemicals Market in Australia Volume (K Tons) Forecast, by Application 2020 & 2033
- Table 91: Rest of Asia Pacific Water Treatment Chemicals Market in Australia Revenue (Million) Forecast, by Application 2020 & 2033
- Table 92: Rest of Asia Pacific Water Treatment Chemicals Market in Australia Volume (K Tons) Forecast, by Application 2020 & 2033
Frequently Asked Questions
1. What is the projected Compound Annual Growth Rate (CAGR) of the Water Treatment Chemicals Market in Australia?
The projected CAGR is approximately 3.17%.
2. Which companies are prominent players in the Water Treatment Chemicals Market in Australia?
Key companies in the market include Kemira Oyj, Coogee, Ecolab, SNF, IWTS Group Pty Ltd, Solvay, Buckman, Aquasol, Dow, Solenis, Ixom, Albemarle Corporation, Veolia (Veolia Water Technologies).
3. What are the main segments of the Water Treatment Chemicals Market in Australia?
The market segments include Product Type, End-user Industry.
4. Can you provide details about the market size?
The market size is estimated to be USD 467.75 Million as of 2022.
5. What are some drivers contributing to market growth?
Rising Groundwater and Surface Water Pollution; Growing Demand From Power and Industrial Applications; Increasing Government Intervention in Reliable Wastewater Management.
6. What are the notable trends driving market growth?
Municipal End-user Industry to Dominate the Market.
7. Are there any restraints impacting market growth?
Hazardous Nature of Hydrazine; Emerging Alternatives to Water Treatment Chemicals.
8. Can you provide examples of recent developments in the market?
In June 2022, Kemira Oyj announced a new collaboration with a France-based company, Veolia, to launch a new technology named ViviMag. This technology can recover phosphorus and other valuable resources, such as iron, from sewage sludge. Phosphorus causes the overfertilization of the surface waters if not removed properly, causing a major environmental problem. This new technology will help Kemira OYJ strengthen its position in the water treatment sector.
9. What pricing options are available for accessing the report?
Pricing options include single-user, multi-user, and enterprise licenses priced at USD 3,950, USD 4,950, and USD 6,950 respectively.
10. Is the market size provided in terms of value or volume?
The market size is provided in terms of value, measured in Million and volume, measured in K Tons.
11. Are there any specific market keywords associated with the report?
Yes, the market keyword associated with the report is "Water Treatment Chemicals Market in Australia," which aids in identifying and referencing the specific market segment covered.
12. How do I determine which pricing option suits my needs best?
The pricing options vary based on user requirements and access needs. Individual users may opt for single-user licenses, while businesses requiring broader access may choose multi-user or enterprise licenses for cost-effective access to the report.
13. Are there any additional resources or data provided in the Water Treatment Chemicals Market in Australia report?
While the report offers comprehensive insights, it's advisable to review the specific contents or supplementary materials provided to ascertain if additional resources or data are available.
14. How can I stay updated on further developments or reports in the Water Treatment Chemicals Market in Australia?
To stay informed about further developments, trends, and reports in the Water Treatment Chemicals Market in Australia, consider subscribing to industry newsletters, following relevant companies and organizations, or regularly checking reputable industry news sources and publications.
Methodology
Step 1 - Identification of Relevant Samples Size from Population Database


Step 2 - Approaches for Defining Global Market Size (Value, Volume* & Price*)

Note*: In applicable scenarios
Step 3 - Data Sources
Primary Research
- Web Analytics
- Survey Reports
- Research Institute
- Latest Research Reports
- Opinion Leaders
Secondary Research
- Annual Reports
- White Paper
- Latest Press Release
- Industry Association
- Paid Database
- Investor Presentations

Step 4 - Data Triangulation
Involves using different sources of information in order to increase the validity of a study
These sources are likely to be stakeholders in a program - participants, other researchers, program staff, other community members, and so on.
Then we put all data in single framework & apply various statistical tools to find out the dynamic on the market.
During the analysis stage, feedback from the stakeholder groups would be compared to determine areas of agreement as well as areas of divergence