

Key Insights
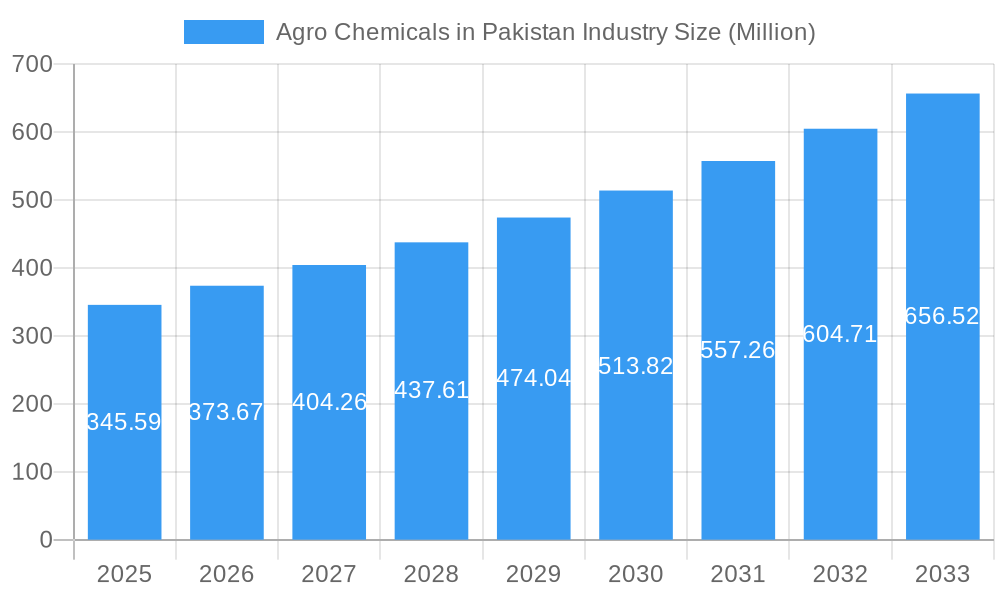
The Pakistan agrochemicals market, valued at $345.59 million in 2025, is projected to experience robust growth, driven by a Compound Annual Growth Rate (CAGR) of 7.99% from 2025 to 2033. This expansion is fueled by several key factors. Firstly, Pakistan's predominantly agrarian economy relies heavily on agricultural output, creating consistent demand for fertilizers, pesticides, and other agrochemicals to enhance crop yields and combat pests and diseases. Secondly, increasing government initiatives promoting sustainable agricultural practices and improving farming techniques are bolstering market growth. Furthermore, the rising adoption of high-yielding crop varieties necessitates greater use of agrochemicals to maximize their potential. The market is segmented by product type (fertilizers, pesticides, adjuvants, plant growth regulators) and application (grains and cereals, pulses and oilseeds, fruits and vegetables, turfs and ornamentals). While the market faces challenges such as fluctuating weather patterns impacting crop production and concerns surrounding the environmental impact of certain agrochemicals, the overall growth trajectory remains positive. Major players like Syngenta, BASF SE, and Bayer AG are actively involved, contributing to market competitiveness and technological advancements.
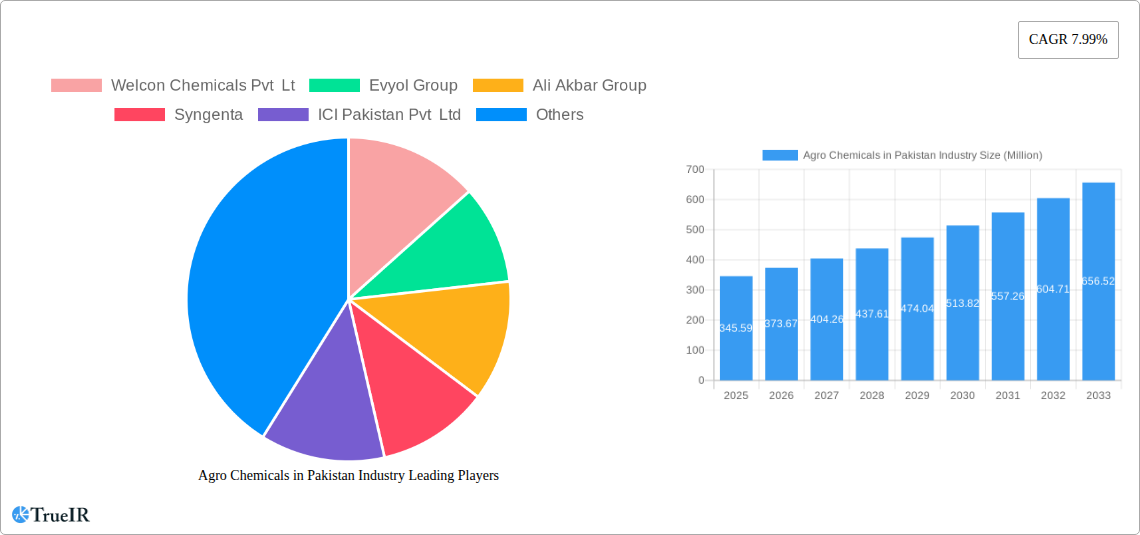
Agro Chemicals in Pakistan Industry Market Size (In Million)
The market segmentation reveals a diverse landscape. Fertilizers likely constitute the largest segment, given the fundamental role of nutrient replenishment in agriculture. Pesticides are vital in protecting crops from various pests and diseases, and their segment is expected to grow alongside the overall market. The adjuvants and plant growth regulators segments will likely see growth driven by increased awareness and adoption of precision agriculture techniques among farmers. The application segments are largely correlated with Pakistan's agricultural production profile, with grains and cereals, pulses and oilseeds, and fruits and vegetables being the major consumers of agrochemicals. The "Other Applications" segment reflects the diverse uses of agrochemicals beyond core food production. This dynamic interplay of factors contributes to the promising future of the Pakistan agrochemicals market.
Agro Chemicals in Pakistan Industry Company Market Share
Pakistan Agrochemicals Market: A Comprehensive Report (2019-2033)
This dynamic report provides a detailed analysis of the Pakistan agrochemicals industry, offering invaluable insights for investors, industry professionals, and researchers. Focusing on the period 2019-2033, with a base year of 2025, this study unveils the market's structure, competitive landscape, trends, and future outlook. We project a market size of xx Million USD by 2025, showcasing significant growth opportunities. This report leverages high-impact keywords like "Pakistan agrochemicals market," "pesticides Pakistan," "fertilizers Pakistan," and "agrochemical industry Pakistan" to ensure optimal search engine visibility.
Agro Chemicals in Pakistan Industry Market Structure & Competitive Landscape
The Pakistan agrochemicals market exhibits a moderately concentrated structure, with a handful of multinational corporations (MNCs) and several large domestic players dominating the landscape. The Herfindahl-Hirschman Index (HHI) for 2024 is estimated at xx, suggesting moderate concentration. Innovation is driven by the need to enhance crop yields, address pest resistance, and meet the demands of a growing population. Regulatory impacts, primarily from the Pakistan Agricultural Research Council (PARC) and the Ministry of National Food Security and Research, significantly influence market dynamics. Product substitutes, such as organic farming methods, are gaining traction but represent a small portion of the overall market. The market is segmented by end-user into grains and cereals, pulses and oilseeds, fruits and vegetables, turfs and ornamentals, and other applications. M&A activity has been relatively moderate in recent years, with a total transaction value of approximately xx Million USD recorded between 2019 and 2024.
- Key Market Characteristics: Moderate concentration, increasing innovation, stringent regulations, growing adoption of organic alternatives.
- Competitive Dynamics: Intense competition among MNCs and domestic players, characterized by price wars and product differentiation strategies.
- M&A Trends: Consolidation expected to increase in the coming years driven by a need for market expansion and cost synergies.
Agro Chemicals in Pakistan Industry Market Trends & Opportunities
The Pakistan agrochemicals market demonstrates robust growth, driven by increasing agricultural production, rising population, and government initiatives to boost agricultural yields. The market is expected to experience a Compound Annual Growth Rate (CAGR) of xx% during the forecast period (2025-2033). Technological advancements, such as the adoption of precision agriculture techniques and the development of biopesticides, are reshaping the industry. Consumer preferences are shifting towards sustainable and eco-friendly agrochemicals, creating opportunities for companies offering such products. Market penetration rates for various products vary widely, with fertilizers having high penetration compared to newer technologies like biopesticides. Competitive dynamics are characterized by both price-based and value-based competition, with MNCs leveraging their technological advantages and domestic players focusing on cost-effectiveness.
Dominant Markets & Segments in Agro Chemicals in Pakistan Industry
The Punjab and Sindh provinces represent the most significant agrochemicals markets in Pakistan due to their extensive agricultural lands and high crop production. Within product segments, fertilizers constitute the largest share of the market, followed by pesticides. The application segments dominated by grains and cereals and pulses and oilseeds, reflect Pakistan's reliance on these crops.
- Key Growth Drivers (Punjab & Sindh): Extensive arable land, high agricultural production, supportive government policies, well-developed infrastructure.
- Market Dominance: Fertilizers hold the largest market share due to high demand from intensive farming practices. Grains and cereals represent the largest application segment, driven by wheat and rice cultivation.
Agro Chemicals in Pakistan Industry Product Analysis
Product innovation focuses on developing more efficient, targeted, and environmentally friendly agrochemicals. Technological advancements, such as nanotechnology-based formulations and biopesticides, are improving efficacy and reducing environmental impact. The market prioritizes products with high crop yield enhancement, robust pest control, and minimal environmental risks, reflecting increasing consumer awareness and regulatory pressures.
Key Drivers, Barriers & Challenges in Agro Chemicals in Pakistan Industry
Key Drivers: Rising agricultural output, government support for the agricultural sector through subsidies and development programs, growing demand for food due to a rising population, adoption of advanced farming practices.
Challenges: Fluctuations in agricultural commodity prices, climate change and its impact on crop yields, counterfeiting of agrochemical products, stringent regulatory approvals. Supply chain disruptions due to infrastructural limitations can result in significant delays and increased costs, impacting profitability and market access, potentially reducing supply availability by xx% in peak seasons.
Growth Drivers in the Agro Chemicals in Pakistan Industry Market
Increased government investment in agricultural research and development, favorable climate conditions in certain regions, the rising adoption of high-yielding crop varieties and efficient farming techniques, and increasing consumer demand for food will all contribute to the expansion of this market.
Challenges Impacting Agro Chemicals in Pakistan Industry Growth
Water scarcity impacting irrigation, climate change, the high cost of imported raw materials impacting production costs, and fluctuating exchange rates causing price volatility, represent significant challenges to sustained growth in this sector.
Key Players Shaping the Agro Chemicals in Pakistan Industry Market
- Welcon Chemicals Pvt Lt
- Evyol Group
- Ali Akbar Group
- Syngenta
- ICI Pakistan Pvt Ltd
- BASF SE
- FMC Corporation
- Pakistan Agro Chemicals Pvt Ltd
- Bayer Ag
Significant Agro Chemicals in Pakistan Industry Industry Milestones
- February 2023: Bayer partnered with Kimitec to introduce next-generation biological crop protection and biostimulant products.
- February 2021: Engro Fertilizers and BASF SE launched Sefina insecticide for cotton and vegetable crops.
- January 2021: HANARO, a Bistrifluron 10% EC product, was launched to manage whiteflies in cotton cultivation.
Future Outlook for Agro Chemicals in Pakistan Industry Market
The Pakistan agrochemicals market is poised for continued growth, fueled by rising agricultural output, technological advancements, and government support. Strategic opportunities lie in developing sustainable and environmentally friendly products, investing in research and development, and leveraging advanced technologies like precision agriculture. The market's potential is significant, given the country's large agricultural sector and increasing demand for food.
Agro Chemicals in Pakistan Industry Segmentation
- 1. Production Analysis
- 2. Consumption Analysis
- 3. Import Market Analysis (Value & Volume)
- 4. Export Market Analysis (Value & Volume)
- 5. Price Trend Analysis
Agro Chemicals in Pakistan Industry Segmentation By Geography
-
1. North America
- 1.1. United States
- 1.2. Canada
- 1.3. Mexico
-
2. South America
- 2.1. Brazil
- 2.2. Argentina
- 2.3. Rest of South America
-
3. Europe
- 3.1. United Kingdom
- 3.2. Germany
- 3.3. France
- 3.4. Italy
- 3.5. Spain
- 3.6. Russia
- 3.7. Benelux
- 3.8. Nordics
- 3.9. Rest of Europe
-
4. Middle East & Africa
- 4.1. Turkey
- 4.2. Israel
- 4.3. GCC
- 4.4. North Africa
- 4.5. South Africa
- 4.6. Rest of Middle East & Africa
-
5. Asia Pacific
- 5.1. China
- 5.2. India
- 5.3. Japan
- 5.4. South Korea
- 5.5. ASEAN
- 5.6. Oceania
- 5.7. Rest of Asia Pacific
Agro Chemicals in Pakistan Industry Regional Market Share
Geographic Coverage of Agro Chemicals in Pakistan Industry
Agro Chemicals in Pakistan Industry REPORT HIGHLIGHTS
| Aspects | Details |
|---|---|
| Study Period | 2020-2034 |
| Base Year | 2025 |
| Estimated Year | 2026 |
| Forecast Period | 2026-2034 |
| Historical Period | 2020-2025 |
| Growth Rate | CAGR of 7.99% from 2020-2034 |
| Segmentation |
|
Table of Contents
- 1. Introduction
- 1.1. Research Scope
- 1.2. Market Segmentation
- 1.3. Research Methodology
- 1.4. Definitions and Assumptions
- 2. Executive Summary
- 2.1. Introduction
- 3. Market Dynamics
- 3.1. Introduction
- 3.2. Market Drivers
- 3.2.1. Increasing Berry Consumption for Health Benefits; Increasing Adoption of High-Technology Farm Practices; Growing Usage of Berries in the Food and Beverage Industries
- 3.3. Market Restrains
- 3.3.1. High Production Cost Involved in Berry Production; Increasing Disease and Pest Infestations
- 3.4. Market Trends
- 3.4.1. Need for Increased Land Productivity
- 4. Market Factor Analysis
- 4.1. Porters Five Forces
- 4.2. Supply/Value Chain
- 4.3. PESTEL analysis
- 4.4. Market Entropy
- 4.5. Patent/Trademark Analysis
- 5. Global Agro Chemicals in Pakistan Industry Analysis, Insights and Forecast, 2020-2032
- 5.1. Market Analysis, Insights and Forecast - by Production Analysis
- 5.2. Market Analysis, Insights and Forecast - by Consumption Analysis
- 5.3. Market Analysis, Insights and Forecast - by Import Market Analysis (Value & Volume)
- 5.4. Market Analysis, Insights and Forecast - by Export Market Analysis (Value & Volume)
- 5.5. Market Analysis, Insights and Forecast - by Price Trend Analysis
- 5.6. Market Analysis, Insights and Forecast - by Region
- 5.6.1. North America
- 5.6.2. South America
- 5.6.3. Europe
- 5.6.4. Middle East & Africa
- 5.6.5. Asia Pacific
- 5.1. Market Analysis, Insights and Forecast - by Production Analysis
- 6. North America Agro Chemicals in Pakistan Industry Analysis, Insights and Forecast, 2020-2032
- 6.1. Market Analysis, Insights and Forecast - by Production Analysis
- 6.2. Market Analysis, Insights and Forecast - by Consumption Analysis
- 6.3. Market Analysis, Insights and Forecast - by Import Market Analysis (Value & Volume)
- 6.4. Market Analysis, Insights and Forecast - by Export Market Analysis (Value & Volume)
- 6.5. Market Analysis, Insights and Forecast - by Price Trend Analysis
- 6.1. Market Analysis, Insights and Forecast - by Production Analysis
- 7. South America Agro Chemicals in Pakistan Industry Analysis, Insights and Forecast, 2020-2032
- 7.1. Market Analysis, Insights and Forecast - by Production Analysis
- 7.2. Market Analysis, Insights and Forecast - by Consumption Analysis
- 7.3. Market Analysis, Insights and Forecast - by Import Market Analysis (Value & Volume)
- 7.4. Market Analysis, Insights and Forecast - by Export Market Analysis (Value & Volume)
- 7.5. Market Analysis, Insights and Forecast - by Price Trend Analysis
- 7.1. Market Analysis, Insights and Forecast - by Production Analysis
- 8. Europe Agro Chemicals in Pakistan Industry Analysis, Insights and Forecast, 2020-2032
- 8.1. Market Analysis, Insights and Forecast - by Production Analysis
- 8.2. Market Analysis, Insights and Forecast - by Consumption Analysis
- 8.3. Market Analysis, Insights and Forecast - by Import Market Analysis (Value & Volume)
- 8.4. Market Analysis, Insights and Forecast - by Export Market Analysis (Value & Volume)
- 8.5. Market Analysis, Insights and Forecast - by Price Trend Analysis
- 8.1. Market Analysis, Insights and Forecast - by Production Analysis
- 9. Middle East & Africa Agro Chemicals in Pakistan Industry Analysis, Insights and Forecast, 2020-2032
- 9.1. Market Analysis, Insights and Forecast - by Production Analysis
- 9.2. Market Analysis, Insights and Forecast - by Consumption Analysis
- 9.3. Market Analysis, Insights and Forecast - by Import Market Analysis (Value & Volume)
- 9.4. Market Analysis, Insights and Forecast - by Export Market Analysis (Value & Volume)
- 9.5. Market Analysis, Insights and Forecast - by Price Trend Analysis
- 9.1. Market Analysis, Insights and Forecast - by Production Analysis
- 10. Asia Pacific Agro Chemicals in Pakistan Industry Analysis, Insights and Forecast, 2020-2032
- 10.1. Market Analysis, Insights and Forecast - by Production Analysis
- 10.2. Market Analysis, Insights and Forecast - by Consumption Analysis
- 10.3. Market Analysis, Insights and Forecast - by Import Market Analysis (Value & Volume)
- 10.4. Market Analysis, Insights and Forecast - by Export Market Analysis (Value & Volume)
- 10.5. Market Analysis, Insights and Forecast - by Price Trend Analysis
- 10.1. Market Analysis, Insights and Forecast - by Production Analysis
- 11. Competitive Analysis
- 11.1. Global Market Share Analysis 2025
- 11.2. Company Profiles
- 11.2.1 Welcon Chemicals Pvt Lt
- 11.2.1.1. Overview
- 11.2.1.2. Products
- 11.2.1.3. SWOT Analysis
- 11.2.1.4. Recent Developments
- 11.2.1.5. Financials (Based on Availability)
- 11.2.2 Evyol Group
- 11.2.2.1. Overview
- 11.2.2.2. Products
- 11.2.2.3. SWOT Analysis
- 11.2.2.4. Recent Developments
- 11.2.2.5. Financials (Based on Availability)
- 11.2.3 Ali Akbar Group
- 11.2.3.1. Overview
- 11.2.3.2. Products
- 11.2.3.3. SWOT Analysis
- 11.2.3.4. Recent Developments
- 11.2.3.5. Financials (Based on Availability)
- 11.2.4 Syngenta
- 11.2.4.1. Overview
- 11.2.4.2. Products
- 11.2.4.3. SWOT Analysis
- 11.2.4.4. Recent Developments
- 11.2.4.5. Financials (Based on Availability)
- 11.2.5 ICI Pakistan Pvt Ltd
- 11.2.5.1. Overview
- 11.2.5.2. Products
- 11.2.5.3. SWOT Analysis
- 11.2.5.4. Recent Developments
- 11.2.5.5. Financials (Based on Availability)
- 11.2.6 BASF SE
- 11.2.6.1. Overview
- 11.2.6.2. Products
- 11.2.6.3. SWOT Analysis
- 11.2.6.4. Recent Developments
- 11.2.6.5. Financials (Based on Availability)
- 11.2.7 FMC Corporation
- 11.2.7.1. Overview
- 11.2.7.2. Products
- 11.2.7.3. SWOT Analysis
- 11.2.7.4. Recent Developments
- 11.2.7.5. Financials (Based on Availability)
- 11.2.8 Pakistan Agro Chemicals Pvt Ltd
- 11.2.8.1. Overview
- 11.2.8.2. Products
- 11.2.8.3. SWOT Analysis
- 11.2.8.4. Recent Developments
- 11.2.8.5. Financials (Based on Availability)
- 11.2.9 Bayer Ag
- 11.2.9.1. Overview
- 11.2.9.2. Products
- 11.2.9.3. SWOT Analysis
- 11.2.9.4. Recent Developments
- 11.2.9.5. Financials (Based on Availability)
- 11.2.1 Welcon Chemicals Pvt Lt
List of Figures
- Figure 1: Global Agro Chemicals in Pakistan Industry Revenue Breakdown (Million, %) by Region 2025 & 2033
- Figure 2: North America Agro Chemicals in Pakistan Industry Revenue (Million), by Production Analysis 2025 & 2033
- Figure 3: North America Agro Chemicals in Pakistan Industry Revenue Share (%), by Production Analysis 2025 & 2033
- Figure 4: North America Agro Chemicals in Pakistan Industry Revenue (Million), by Consumption Analysis 2025 & 2033
- Figure 5: North America Agro Chemicals in Pakistan Industry Revenue Share (%), by Consumption Analysis 2025 & 2033
- Figure 6: North America Agro Chemicals in Pakistan Industry Revenue (Million), by Import Market Analysis (Value & Volume) 2025 & 2033
- Figure 7: North America Agro Chemicals in Pakistan Industry Revenue Share (%), by Import Market Analysis (Value & Volume) 2025 & 2033
- Figure 8: North America Agro Chemicals in Pakistan Industry Revenue (Million), by Export Market Analysis (Value & Volume) 2025 & 2033
- Figure 9: North America Agro Chemicals in Pakistan Industry Revenue Share (%), by Export Market Analysis (Value & Volume) 2025 & 2033
- Figure 10: North America Agro Chemicals in Pakistan Industry Revenue (Million), by Price Trend Analysis 2025 & 2033
- Figure 11: North America Agro Chemicals in Pakistan Industry Revenue Share (%), by Price Trend Analysis 2025 & 2033
- Figure 12: North America Agro Chemicals in Pakistan Industry Revenue (Million), by Country 2025 & 2033
- Figure 13: North America Agro Chemicals in Pakistan Industry Revenue Share (%), by Country 2025 & 2033
- Figure 14: South America Agro Chemicals in Pakistan Industry Revenue (Million), by Production Analysis 2025 & 2033
- Figure 15: South America Agro Chemicals in Pakistan Industry Revenue Share (%), by Production Analysis 2025 & 2033
- Figure 16: South America Agro Chemicals in Pakistan Industry Revenue (Million), by Consumption Analysis 2025 & 2033
- Figure 17: South America Agro Chemicals in Pakistan Industry Revenue Share (%), by Consumption Analysis 2025 & 2033
- Figure 18: South America Agro Chemicals in Pakistan Industry Revenue (Million), by Import Market Analysis (Value & Volume) 2025 & 2033
- Figure 19: South America Agro Chemicals in Pakistan Industry Revenue Share (%), by Import Market Analysis (Value & Volume) 2025 & 2033
- Figure 20: South America Agro Chemicals in Pakistan Industry Revenue (Million), by Export Market Analysis (Value & Volume) 2025 & 2033
- Figure 21: South America Agro Chemicals in Pakistan Industry Revenue Share (%), by Export Market Analysis (Value & Volume) 2025 & 2033
- Figure 22: South America Agro Chemicals in Pakistan Industry Revenue (Million), by Price Trend Analysis 2025 & 2033
- Figure 23: South America Agro Chemicals in Pakistan Industry Revenue Share (%), by Price Trend Analysis 2025 & 2033
- Figure 24: South America Agro Chemicals in Pakistan Industry Revenue (Million), by Country 2025 & 2033
- Figure 25: South America Agro Chemicals in Pakistan Industry Revenue Share (%), by Country 2025 & 2033
- Figure 26: Europe Agro Chemicals in Pakistan Industry Revenue (Million), by Production Analysis 2025 & 2033
- Figure 27: Europe Agro Chemicals in Pakistan Industry Revenue Share (%), by Production Analysis 2025 & 2033
- Figure 28: Europe Agro Chemicals in Pakistan Industry Revenue (Million), by Consumption Analysis 2025 & 2033
- Figure 29: Europe Agro Chemicals in Pakistan Industry Revenue Share (%), by Consumption Analysis 2025 & 2033
- Figure 30: Europe Agro Chemicals in Pakistan Industry Revenue (Million), by Import Market Analysis (Value & Volume) 2025 & 2033
- Figure 31: Europe Agro Chemicals in Pakistan Industry Revenue Share (%), by Import Market Analysis (Value & Volume) 2025 & 2033
- Figure 32: Europe Agro Chemicals in Pakistan Industry Revenue (Million), by Export Market Analysis (Value & Volume) 2025 & 2033
- Figure 33: Europe Agro Chemicals in Pakistan Industry Revenue Share (%), by Export Market Analysis (Value & Volume) 2025 & 2033
- Figure 34: Europe Agro Chemicals in Pakistan Industry Revenue (Million), by Price Trend Analysis 2025 & 2033
- Figure 35: Europe Agro Chemicals in Pakistan Industry Revenue Share (%), by Price Trend Analysis 2025 & 2033
- Figure 36: Europe Agro Chemicals in Pakistan Industry Revenue (Million), by Country 2025 & 2033
- Figure 37: Europe Agro Chemicals in Pakistan Industry Revenue Share (%), by Country 2025 & 2033
- Figure 38: Middle East & Africa Agro Chemicals in Pakistan Industry Revenue (Million), by Production Analysis 2025 & 2033
- Figure 39: Middle East & Africa Agro Chemicals in Pakistan Industry Revenue Share (%), by Production Analysis 2025 & 2033
- Figure 40: Middle East & Africa Agro Chemicals in Pakistan Industry Revenue (Million), by Consumption Analysis 2025 & 2033
- Figure 41: Middle East & Africa Agro Chemicals in Pakistan Industry Revenue Share (%), by Consumption Analysis 2025 & 2033
- Figure 42: Middle East & Africa Agro Chemicals in Pakistan Industry Revenue (Million), by Import Market Analysis (Value & Volume) 2025 & 2033
- Figure 43: Middle East & Africa Agro Chemicals in Pakistan Industry Revenue Share (%), by Import Market Analysis (Value & Volume) 2025 & 2033
- Figure 44: Middle East & Africa Agro Chemicals in Pakistan Industry Revenue (Million), by Export Market Analysis (Value & Volume) 2025 & 2033
- Figure 45: Middle East & Africa Agro Chemicals in Pakistan Industry Revenue Share (%), by Export Market Analysis (Value & Volume) 2025 & 2033
- Figure 46: Middle East & Africa Agro Chemicals in Pakistan Industry Revenue (Million), by Price Trend Analysis 2025 & 2033
- Figure 47: Middle East & Africa Agro Chemicals in Pakistan Industry Revenue Share (%), by Price Trend Analysis 2025 & 2033
- Figure 48: Middle East & Africa Agro Chemicals in Pakistan Industry Revenue (Million), by Country 2025 & 2033
- Figure 49: Middle East & Africa Agro Chemicals in Pakistan Industry Revenue Share (%), by Country 2025 & 2033
- Figure 50: Asia Pacific Agro Chemicals in Pakistan Industry Revenue (Million), by Production Analysis 2025 & 2033
- Figure 51: Asia Pacific Agro Chemicals in Pakistan Industry Revenue Share (%), by Production Analysis 2025 & 2033
- Figure 52: Asia Pacific Agro Chemicals in Pakistan Industry Revenue (Million), by Consumption Analysis 2025 & 2033
- Figure 53: Asia Pacific Agro Chemicals in Pakistan Industry Revenue Share (%), by Consumption Analysis 2025 & 2033
- Figure 54: Asia Pacific Agro Chemicals in Pakistan Industry Revenue (Million), by Import Market Analysis (Value & Volume) 2025 & 2033
- Figure 55: Asia Pacific Agro Chemicals in Pakistan Industry Revenue Share (%), by Import Market Analysis (Value & Volume) 2025 & 2033
- Figure 56: Asia Pacific Agro Chemicals in Pakistan Industry Revenue (Million), by Export Market Analysis (Value & Volume) 2025 & 2033
- Figure 57: Asia Pacific Agro Chemicals in Pakistan Industry Revenue Share (%), by Export Market Analysis (Value & Volume) 2025 & 2033
- Figure 58: Asia Pacific Agro Chemicals in Pakistan Industry Revenue (Million), by Price Trend Analysis 2025 & 2033
- Figure 59: Asia Pacific Agro Chemicals in Pakistan Industry Revenue Share (%), by Price Trend Analysis 2025 & 2033
- Figure 60: Asia Pacific Agro Chemicals in Pakistan Industry Revenue (Million), by Country 2025 & 2033
- Figure 61: Asia Pacific Agro Chemicals in Pakistan Industry Revenue Share (%), by Country 2025 & 2033
List of Tables
- Table 1: Global Agro Chemicals in Pakistan Industry Revenue Million Forecast, by Production Analysis 2020 & 2033
- Table 2: Global Agro Chemicals in Pakistan Industry Revenue Million Forecast, by Consumption Analysis 2020 & 2033
- Table 3: Global Agro Chemicals in Pakistan Industry Revenue Million Forecast, by Import Market Analysis (Value & Volume) 2020 & 2033
- Table 4: Global Agro Chemicals in Pakistan Industry Revenue Million Forecast, by Export Market Analysis (Value & Volume) 2020 & 2033
- Table 5: Global Agro Chemicals in Pakistan Industry Revenue Million Forecast, by Price Trend Analysis 2020 & 2033
- Table 6: Global Agro Chemicals in Pakistan Industry Revenue Million Forecast, by Region 2020 & 2033
- Table 7: Global Agro Chemicals in Pakistan Industry Revenue Million Forecast, by Production Analysis 2020 & 2033
- Table 8: Global Agro Chemicals in Pakistan Industry Revenue Million Forecast, by Consumption Analysis 2020 & 2033
- Table 9: Global Agro Chemicals in Pakistan Industry Revenue Million Forecast, by Import Market Analysis (Value & Volume) 2020 & 2033
- Table 10: Global Agro Chemicals in Pakistan Industry Revenue Million Forecast, by Export Market Analysis (Value & Volume) 2020 & 2033
- Table 11: Global Agro Chemicals in Pakistan Industry Revenue Million Forecast, by Price Trend Analysis 2020 & 2033
- Table 12: Global Agro Chemicals in Pakistan Industry Revenue Million Forecast, by Country 2020 & 2033
- Table 13: United States Agro Chemicals in Pakistan Industry Revenue (Million) Forecast, by Application 2020 & 2033
- Table 14: Canada Agro Chemicals in Pakistan Industry Revenue (Million) Forecast, by Application 2020 & 2033
- Table 15: Mexico Agro Chemicals in Pakistan Industry Revenue (Million) Forecast, by Application 2020 & 2033
- Table 16: Global Agro Chemicals in Pakistan Industry Revenue Million Forecast, by Production Analysis 2020 & 2033
- Table 17: Global Agro Chemicals in Pakistan Industry Revenue Million Forecast, by Consumption Analysis 2020 & 2033
- Table 18: Global Agro Chemicals in Pakistan Industry Revenue Million Forecast, by Import Market Analysis (Value & Volume) 2020 & 2033
- Table 19: Global Agro Chemicals in Pakistan Industry Revenue Million Forecast, by Export Market Analysis (Value & Volume) 2020 & 2033
- Table 20: Global Agro Chemicals in Pakistan Industry Revenue Million Forecast, by Price Trend Analysis 2020 & 2033
- Table 21: Global Agro Chemicals in Pakistan Industry Revenue Million Forecast, by Country 2020 & 2033
- Table 22: Brazil Agro Chemicals in Pakistan Industry Revenue (Million) Forecast, by Application 2020 & 2033
- Table 23: Argentina Agro Chemicals in Pakistan Industry Revenue (Million) Forecast, by Application 2020 & 2033
- Table 24: Rest of South America Agro Chemicals in Pakistan Industry Revenue (Million) Forecast, by Application 2020 & 2033
- Table 25: Global Agro Chemicals in Pakistan Industry Revenue Million Forecast, by Production Analysis 2020 & 2033
- Table 26: Global Agro Chemicals in Pakistan Industry Revenue Million Forecast, by Consumption Analysis 2020 & 2033
- Table 27: Global Agro Chemicals in Pakistan Industry Revenue Million Forecast, by Import Market Analysis (Value & Volume) 2020 & 2033
- Table 28: Global Agro Chemicals in Pakistan Industry Revenue Million Forecast, by Export Market Analysis (Value & Volume) 2020 & 2033
- Table 29: Global Agro Chemicals in Pakistan Industry Revenue Million Forecast, by Price Trend Analysis 2020 & 2033
- Table 30: Global Agro Chemicals in Pakistan Industry Revenue Million Forecast, by Country 2020 & 2033
- Table 31: United Kingdom Agro Chemicals in Pakistan Industry Revenue (Million) Forecast, by Application 2020 & 2033
- Table 32: Germany Agro Chemicals in Pakistan Industry Revenue (Million) Forecast, by Application 2020 & 2033
- Table 33: France Agro Chemicals in Pakistan Industry Revenue (Million) Forecast, by Application 2020 & 2033
- Table 34: Italy Agro Chemicals in Pakistan Industry Revenue (Million) Forecast, by Application 2020 & 2033
- Table 35: Spain Agro Chemicals in Pakistan Industry Revenue (Million) Forecast, by Application 2020 & 2033
- Table 36: Russia Agro Chemicals in Pakistan Industry Revenue (Million) Forecast, by Application 2020 & 2033
- Table 37: Benelux Agro Chemicals in Pakistan Industry Revenue (Million) Forecast, by Application 2020 & 2033
- Table 38: Nordics Agro Chemicals in Pakistan Industry Revenue (Million) Forecast, by Application 2020 & 2033
- Table 39: Rest of Europe Agro Chemicals in Pakistan Industry Revenue (Million) Forecast, by Application 2020 & 2033
- Table 40: Global Agro Chemicals in Pakistan Industry Revenue Million Forecast, by Production Analysis 2020 & 2033
- Table 41: Global Agro Chemicals in Pakistan Industry Revenue Million Forecast, by Consumption Analysis 2020 & 2033
- Table 42: Global Agro Chemicals in Pakistan Industry Revenue Million Forecast, by Import Market Analysis (Value & Volume) 2020 & 2033
- Table 43: Global Agro Chemicals in Pakistan Industry Revenue Million Forecast, by Export Market Analysis (Value & Volume) 2020 & 2033
- Table 44: Global Agro Chemicals in Pakistan Industry Revenue Million Forecast, by Price Trend Analysis 2020 & 2033
- Table 45: Global Agro Chemicals in Pakistan Industry Revenue Million Forecast, by Country 2020 & 2033
- Table 46: Turkey Agro Chemicals in Pakistan Industry Revenue (Million) Forecast, by Application 2020 & 2033
- Table 47: Israel Agro Chemicals in Pakistan Industry Revenue (Million) Forecast, by Application 2020 & 2033
- Table 48: GCC Agro Chemicals in Pakistan Industry Revenue (Million) Forecast, by Application 2020 & 2033
- Table 49: North Africa Agro Chemicals in Pakistan Industry Revenue (Million) Forecast, by Application 2020 & 2033
- Table 50: South Africa Agro Chemicals in Pakistan Industry Revenue (Million) Forecast, by Application 2020 & 2033
- Table 51: Rest of Middle East & Africa Agro Chemicals in Pakistan Industry Revenue (Million) Forecast, by Application 2020 & 2033
- Table 52: Global Agro Chemicals in Pakistan Industry Revenue Million Forecast, by Production Analysis 2020 & 2033
- Table 53: Global Agro Chemicals in Pakistan Industry Revenue Million Forecast, by Consumption Analysis 2020 & 2033
- Table 54: Global Agro Chemicals in Pakistan Industry Revenue Million Forecast, by Import Market Analysis (Value & Volume) 2020 & 2033
- Table 55: Global Agro Chemicals in Pakistan Industry Revenue Million Forecast, by Export Market Analysis (Value & Volume) 2020 & 2033
- Table 56: Global Agro Chemicals in Pakistan Industry Revenue Million Forecast, by Price Trend Analysis 2020 & 2033
- Table 57: Global Agro Chemicals in Pakistan Industry Revenue Million Forecast, by Country 2020 & 2033
- Table 58: China Agro Chemicals in Pakistan Industry Revenue (Million) Forecast, by Application 2020 & 2033
- Table 59: India Agro Chemicals in Pakistan Industry Revenue (Million) Forecast, by Application 2020 & 2033
- Table 60: Japan Agro Chemicals in Pakistan Industry Revenue (Million) Forecast, by Application 2020 & 2033
- Table 61: South Korea Agro Chemicals in Pakistan Industry Revenue (Million) Forecast, by Application 2020 & 2033
- Table 62: ASEAN Agro Chemicals in Pakistan Industry Revenue (Million) Forecast, by Application 2020 & 2033
- Table 63: Oceania Agro Chemicals in Pakistan Industry Revenue (Million) Forecast, by Application 2020 & 2033
- Table 64: Rest of Asia Pacific Agro Chemicals in Pakistan Industry Revenue (Million) Forecast, by Application 2020 & 2033
Frequently Asked Questions
1. What is the projected Compound Annual Growth Rate (CAGR) of the Agro Chemicals in Pakistan Industry?
The projected CAGR is approximately 7.99%.
2. Which companies are prominent players in the Agro Chemicals in Pakistan Industry?
Key companies in the market include Welcon Chemicals Pvt Lt, Evyol Group, Ali Akbar Group, Syngenta, ICI Pakistan Pvt Ltd, BASF SE, FMC Corporation, Pakistan Agro Chemicals Pvt Ltd, Bayer Ag.
3. What are the main segments of the Agro Chemicals in Pakistan Industry?
The market segments include Production Analysis, Consumption Analysis, Import Market Analysis (Value & Volume), Export Market Analysis (Value & Volume), Price Trend Analysis.
4. Can you provide details about the market size?
The market size is estimated to be USD 345.59 Million as of 2022.
5. What are some drivers contributing to market growth?
Increasing Berry Consumption for Health Benefits; Increasing Adoption of High-Technology Farm Practices; Growing Usage of Berries in the Food and Beverage Industries.
6. What are the notable trends driving market growth?
Need for Increased Land Productivity.
7. Are there any restraints impacting market growth?
High Production Cost Involved in Berry Production; Increasing Disease and Pest Infestations.
8. Can you provide examples of recent developments in the market?
February 2023: Bayer partnered with Kimitec to bring the next generation of biologicals to millions of growers worldwide. This includes crop protection and biostimulant products based on molecules derived from natural sources.
9. What pricing options are available for accessing the report?
Pricing options include single-user, multi-user, and enterprise licenses priced at USD 3800, USD 4500, and USD 5800 respectively.
10. Is the market size provided in terms of value or volume?
The market size is provided in terms of value, measured in Million.
11. Are there any specific market keywords associated with the report?
Yes, the market keyword associated with the report is "Agro Chemicals in Pakistan Industry," which aids in identifying and referencing the specific market segment covered.
12. How do I determine which pricing option suits my needs best?
The pricing options vary based on user requirements and access needs. Individual users may opt for single-user licenses, while businesses requiring broader access may choose multi-user or enterprise licenses for cost-effective access to the report.
13. Are there any additional resources or data provided in the Agro Chemicals in Pakistan Industry report?
While the report offers comprehensive insights, it's advisable to review the specific contents or supplementary materials provided to ascertain if additional resources or data are available.
14. How can I stay updated on further developments or reports in the Agro Chemicals in Pakistan Industry?
To stay informed about further developments, trends, and reports in the Agro Chemicals in Pakistan Industry, consider subscribing to industry newsletters, following relevant companies and organizations, or regularly checking reputable industry news sources and publications.
Methodology
Step 1 - Identification of Relevant Samples Size from Population Database


Step 2 - Approaches for Defining Global Market Size (Value, Volume* & Price*)

Note*: In applicable scenarios
Step 3 - Data Sources
Primary Research
- Web Analytics
- Survey Reports
- Research Institute
- Latest Research Reports
- Opinion Leaders
Secondary Research
- Annual Reports
- White Paper
- Latest Press Release
- Industry Association
- Paid Database
- Investor Presentations

Step 4 - Data Triangulation
Involves using different sources of information in order to increase the validity of a study
These sources are likely to be stakeholders in a program - participants, other researchers, program staff, other community members, and so on.
Then we put all data in single framework & apply various statistical tools to find out the dynamic on the market.
During the analysis stage, feedback from the stakeholder groups would be compared to determine areas of agreement as well as areas of divergence