

Key Insights
The Asia-Pacific (APAC) auto logistics market is experiencing robust growth, driven by the region's burgeoning automotive manufacturing and sales. With a market size of $289.04 million in 2025 and a Compound Annual Growth Rate (CAGR) exceeding 6.5%, the industry is poised for significant expansion throughout the forecast period (2025-2033). Key drivers include increasing vehicle production in major economies like China, India, and Japan, coupled with rising consumer demand for automobiles. The growth is further fueled by advancements in logistics technologies, such as improved tracking systems and optimized transportation routes, leading to enhanced efficiency and reduced costs. While challenges like infrastructure limitations in certain regions and fluctuating fuel prices exist, the overall market outlook remains positive. The segmentation analysis reveals a substantial contribution from finished vehicle transportation, followed by auto components logistics. China, India, and Japan represent the largest national markets within APAC, reflecting their dominance in automotive production and consumption. Leading players like DB Schenker, DHL, and Nippon Express are strategically positioning themselves to capitalize on this expanding market, through investments in infrastructure, technology, and service diversification. The diverse service offerings, including transportation, warehousing, distribution, and inventory management, cater to the intricate needs of the automotive supply chain, ensuring timely and efficient delivery of vehicles and components. Continued economic growth in several APAC nations, coupled with supportive government policies, will further propel the market's trajectory in the coming years.
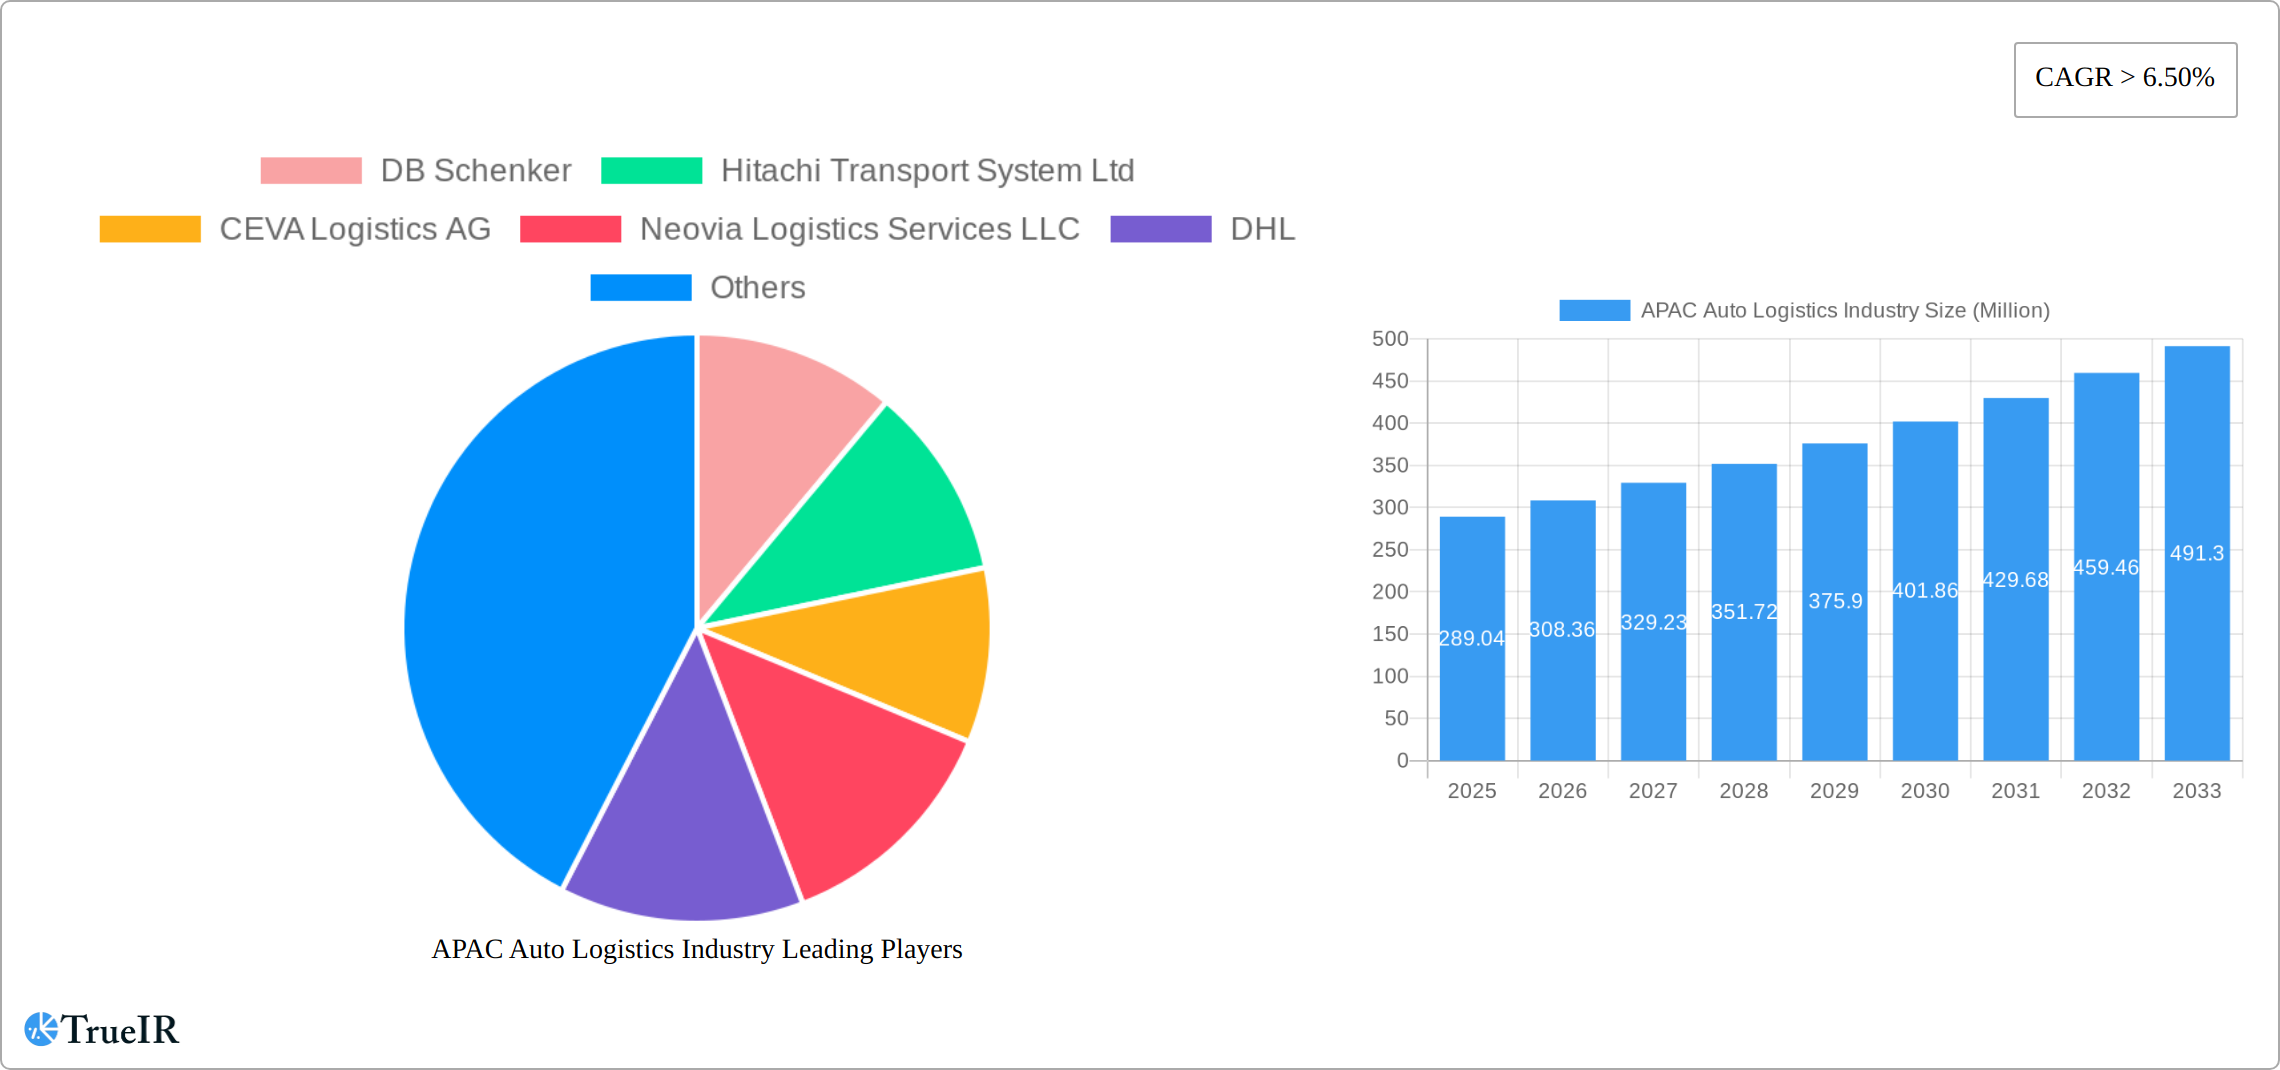
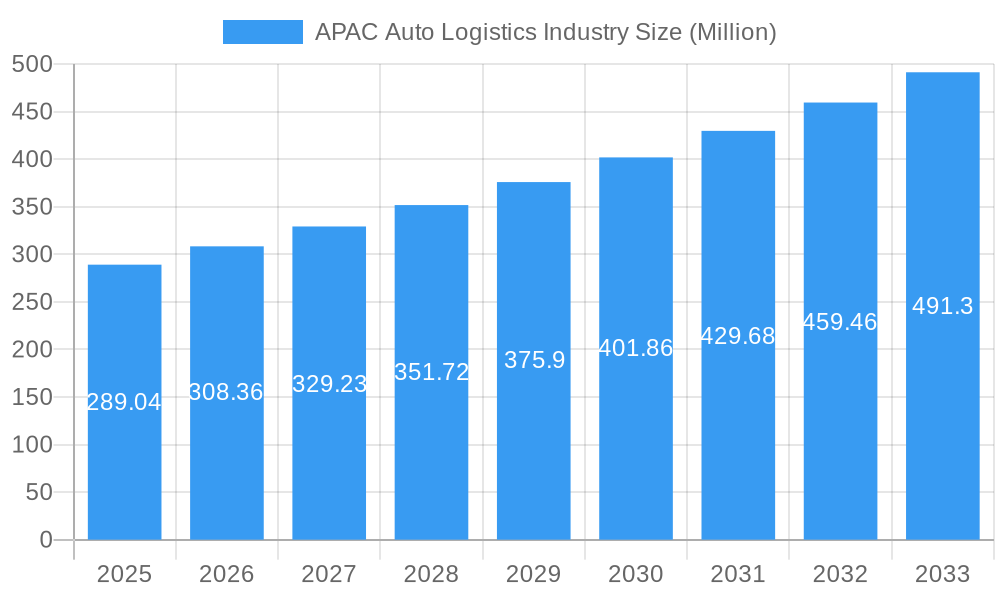
APAC Auto Logistics Industry Market Size (In Million)
The significant growth projected for the APAC auto logistics market presents substantial opportunities for established players and new entrants alike. Strategic alliances, technological innovations, and expansion into underserved markets will be critical for success. The focus will likely shift towards sustainable and eco-friendly logistics solutions to meet growing environmental concerns. Furthermore, the increasing demand for just-in-time delivery and enhanced supply chain visibility will drive the adoption of advanced technologies such as blockchain and artificial intelligence within the industry. The market's dynamism necessitates continuous adaptation and innovation to maintain competitiveness and effectively serve the ever-evolving needs of automotive manufacturers and consumers across the region. Specific regional nuances will require localized strategies, ensuring responsiveness to diverse market dynamics and regulatory frameworks.
APAC Auto Logistics Industry Company Market Share
APAC Auto Logistics Industry Report: 2019-2033 Forecast
This comprehensive report provides a detailed analysis of the Asia-Pacific (APAC) auto logistics industry, encompassing market size, growth trends, competitive landscape, and future outlook. With a study period spanning 2019-2033, a base year of 2025, and a forecast period of 2025-2033, this report is an invaluable resource for industry stakeholders, investors, and strategic decision-makers. The report leverages extensive data analysis to deliver actionable insights into this rapidly evolving market, valued at xx Million in 2025 and projected to reach xx Million by 2033.
APAC Auto Logistics Industry Market Structure & Competitive Landscape
The APAC auto logistics market is characterized by a moderately concentrated structure, with several multinational players vying for market share. Key players include DB Schenker, Hitachi Transport System Ltd, CEVA Logistics AG, Neovia Logistics Services LLC, DHL, Yusen Logistics Co Ltd, GEODIS, Nippon Express Co Ltd, United Parcel Service Inc, XPO Logistics Inc, KUEHNE + NAGEL International AG, DSV, and Ryder System Inc. However, the market also accommodates numerous regional and niche players, creating a dynamic competitive environment.
- Market Concentration: The Herfindahl-Hirschman Index (HHI) for the APAC auto logistics market is estimated at xx, indicating a moderately concentrated market.
- Innovation Drivers: Technological advancements such as automation, AI-powered logistics solutions, and blockchain technology are driving innovation. The growing adoption of electric vehicles (EVs) also presents significant opportunities for specialized logistics solutions.
- Regulatory Impacts: Government regulations related to emissions, safety, and cross-border trade significantly impact the market. Varying regulations across different APAC countries add complexity to operations.
- Product Substitutes: The emergence of alternative transportation modes like rail and inland waterways presents potential substitutes to traditional road freight.
- End-User Segmentation: The market caters to diverse end-users, including Original Equipment Manufacturers (OEMs), Tier-1 and Tier-2 auto component suppliers, and dealerships.
- M&A Trends: The APAC auto logistics sector has witnessed a significant number of mergers and acquisitions (M&A) in recent years, with xx Million worth of deals recorded in 2024. This trend is expected to continue, driven by the pursuit of scale and expansion into new markets.
APAC Auto Logistics Industry Market Trends & Opportunities
The APAC auto logistics market is experiencing robust growth, driven by factors such as increasing vehicle production, rising consumer demand, and expanding e-commerce activities. The market is projected to witness a Compound Annual Growth Rate (CAGR) of xx% during the forecast period (2025-2033). This growth is fueled by several key trends:
- Market Size Growth: The market is expanding rapidly, with a significant contribution from the burgeoning automotive industries in China, India, and Southeast Asia.
- Technological Shifts: The adoption of advanced technologies such as IoT, AI, and Big Data analytics is streamlining operations and enhancing efficiency. Automation in warehousing and transportation is gaining traction.
- Consumer Preferences: Shifting consumer preferences towards personalized delivery options and faster delivery times are influencing logistics strategies.
- Competitive Dynamics: Intense competition among established players and new entrants is driving innovation and improving service quality. The market exhibits a trend towards consolidation through M&A activities.
- Market Penetration Rates: The penetration rate of advanced logistics technologies remains relatively low but is expected to increase significantly in the coming years.
Dominant Markets & Segments in APAC Auto Logistics Industry
China holds the dominant position in the APAC auto logistics market, followed by India and Japan. Within the service segments, transportation accounts for the largest share, followed by warehousing and distribution. Finished vehicles represent the largest segment by type.
- By Service:
- Transportation: Dominated by road freight, with a growing share of rail and sea freight.
- Warehousing: Increasing demand for sophisticated warehousing solutions, including automated facilities.
- Distribution and Inventory Management: Focus on optimizing inventory levels and improving supply chain efficiency.
- Other Services: Includes value-added services like packaging, labeling, and customs brokerage.
- By Type:
- Finished Vehicles: Largest segment, reflecting the high volume of vehicle production and sales.
- Auto Components: Significant segment driven by the growing complexity of automotive parts and supply chains.
- Other Types: Includes specialized logistics for automotive parts, tires, and batteries.
- By Country:
- China: Dominant market due to high vehicle production and sales volumes. Key growth drivers include robust infrastructure development and government support for the automotive industry.
- India: Rapidly growing market fueled by increasing vehicle ownership and government initiatives to promote domestic auto manufacturing. Infrastructure development is a key growth driver.
- Japan: Mature market with sophisticated logistics infrastructure. Key growth drivers include technological advancements and the presence of global automakers.
- South Korea, Indonesia, Philippines, Rest of Asia-Pacific: These regions demonstrate varying growth rates, driven by factors like economic development, infrastructure, and government policies.
APAP Auto Logistics Industry Product Analysis
The APAP auto logistics industry showcases significant product innovation, adapting to evolving market demands. Technological advancements, such as the integration of telematics, RFID tracking, and sophisticated route optimization software, are driving efficiency and transparency. The emergence of specialized services catering to EVs and the increasing complexity of automotive parts also contributes to product diversification. Companies are focusing on developing solutions that enhance speed, reliability, and security while addressing sustainability concerns.
Key Drivers, Barriers & Challenges in APAC Auto Logistics Industry
Key Drivers: Technological advancements (automation, AI), rising automotive production, growing e-commerce, and supportive government policies are key drivers. The shift towards electric vehicles presents new opportunities.
Challenges: Supply chain disruptions, geopolitical instability, stringent environmental regulations, and intense competition are major challenges. Infrastructure limitations in some regions also impede growth. The impact of these challenges can result in increased operational costs and delays, potentially impacting overall market growth by xx%.
Growth Drivers in the APAC Auto Logistics Industry Market
The APAC auto logistics industry is experiencing robust growth, fueled by the explosive expansion of the automotive sector, particularly within burgeoning economies such as India and Southeast Asia. This surge is further accelerated by several key factors: the increasing demand for vehicles, the rise of electric vehicles (EVs) and their unique logistical requirements, the proliferation of just-in-time manufacturing, and the development of sophisticated supply chain management systems. Technological advancements, including the implementation of advanced tracking and tracing systems, predictive analytics for optimizing routes and resource allocation, and the automation of warehousing processes, are significantly improving efficiency and reducing costs. Furthermore, continuous improvements in infrastructure, coupled with supportive government policies promoting economic growth and trade facilitation across the region, are creating a more favorable environment for market expansion.
Challenges Impacting APAC Auto Logistics Industry Growth
Despite the significant growth potential, the APAC auto logistics industry faces several challenges. Infrastructure gaps, particularly in less developed regions, remain a significant hurdle, leading to delays and increased transportation costs. The volatility of fuel prices presents ongoing uncertainty and impacts operational budgets. Navigating complex and often varying regulatory landscapes across different countries in the region adds another layer of complexity. Furthermore, intense competition among established global players and emerging regional providers necessitates a constant focus on innovation, efficiency, and customer service to maintain a competitive edge. The increasing complexity of supply chains, coupled with the need to ensure timely delivery of increasingly sophisticated vehicles, necessitates robust risk management strategies and agile operational capabilities.
Key Players Shaping the APAC Auto Logistics Industry Market
- DB Schenker
- Hitachi Transport System Ltd
- CEVA Logistics AG
- Neovia Logistics Services LLC
- DHL
- Yusen Logistics Co Ltd
- GEODIS
- Nippon Express Co Ltd
- United Parcel Service Inc
- XPO Logistics Inc
- KUEHNE + NAGEL International AG
- DSV
- Ryder System Inc
Significant APAC Auto Logistics Industry Milestones
- December 2022: Tata Motors signed a contract with Everest Fleet Pvt. Ltd. for the delivery of 5,000 XPRES-T EVs, highlighting the growing demand for EV logistics.
- March 2023: Tata Motors received an order for 1000 XPRES-T EVs from OHM E Logistics Pvt. Ltd., further emphasizing the EV market's impact on auto logistics.
Future Outlook for APAC Auto Logistics Industry Market
The APAC auto logistics market is poised for continued growth, driven by the expanding automotive sector, technological advancements, and supportive government policies. Strategic partnerships, investments in infrastructure, and the adoption of sustainable practices will shape the industry's future. The market offers significant opportunities for players who can adapt to evolving market dynamics and leverage technological advancements to enhance efficiency and service quality.
APAC Auto Logistics Industry Segmentation
-
1. Service
- 1.1. Transportation
- 1.2. Warehousing, Distribution and Inventory Management
- 1.3. Other Services
-
2. Type
- 2.1. Finished Vehicle
- 2.2. Auto Components
- 2.3. Other types
APAC Auto Logistics Industry Segmentation By Geography
-
1. North America
- 1.1. United States
- 1.2. Canada
- 1.3. Mexico
-
2. South America
- 2.1. Brazil
- 2.2. Argentina
- 2.3. Rest of South America
-
3. Europe
- 3.1. United Kingdom
- 3.2. Germany
- 3.3. France
- 3.4. Italy
- 3.5. Spain
- 3.6. Russia
- 3.7. Benelux
- 3.8. Nordics
- 3.9. Rest of Europe
-
4. Middle East & Africa
- 4.1. Turkey
- 4.2. Israel
- 4.3. GCC
- 4.4. North Africa
- 4.5. South Africa
- 4.6. Rest of Middle East & Africa
-
5. Asia Pacific
- 5.1. China
- 5.2. India
- 5.3. Japan
- 5.4. South Korea
- 5.5. ASEAN
- 5.6. Oceania
- 5.7. Rest of Asia Pacific
APAC Auto Logistics Industry Regional Market Share
Geographic Coverage of APAC Auto Logistics Industry
APAC Auto Logistics Industry REPORT HIGHLIGHTS
| Aspects | Details |
|---|---|
| Study Period | 2020-2034 |
| Base Year | 2025 |
| Estimated Year | 2026 |
| Forecast Period | 2026-2034 |
| Historical Period | 2020-2025 |
| Growth Rate | CAGR of > 6.50% from 2020-2034 |
| Segmentation |
|
Table of Contents
- 1. Introduction
- 1.1. Research Scope
- 1.2. Market Segmentation
- 1.3. Research Objective
- 1.4. Definitions and Assumptions
- 2. Executive Summary
- 2.1. Market Snapshot
- 3. Market Dynamics
- 3.1. Market Drivers
- 3.2. Market Restrains
- 3.3. Market Trends
- 3.4. Market Opportunities
- 4. Market Factor Analysis
- 4.1. Porters Five Forces
- 4.1.1. Bargaining Power of Suppliers
- 4.1.2. Bargaining Power of Buyers
- 4.1.3. Threat of New Entrants
- 4.1.4. Threat of Substitutes
- 4.1.5. Competitive Rivalry
- 4.2. PESTEL analysis
- 4.3. BCG Analysis
- 4.3.1. Stars (High Growth, High Market Share)
- 4.3.2. Cash Cows (Low Growth, High Market Share)
- 4.3.3. Question Mark (High Growth, Low Market Share)
- 4.3.4. Dogs (Low Growth, Low Market Share)
- 4.4. Ansoff Matrix Analysis
- 4.5. Supply Chain Analysis
- 4.6. Regulatory Landscape
- 4.7. Current Market Potential and Opportunity Assessment (TAM–SAM–SOM Framework)
- 4.8. TIR Analyst Note
- 4.1. Porters Five Forces
- 5. Market Analysis, Insights and Forecast 2021-2033
- 5.1. Market Analysis, Insights and Forecast - by Service
- 5.1.1. Transportation
- 5.1.2. Warehousing, Distribution and Inventory Management
- 5.1.3. Other Services
- 5.2. Market Analysis, Insights and Forecast - by Type
- 5.2.1. Finished Vehicle
- 5.2.2. Auto Components
- 5.2.3. Other types
- 5.3. Market Analysis, Insights and Forecast - by Region
- 5.3.1. North America
- 5.3.2. South America
- 5.3.3. Europe
- 5.3.4. Middle East & Africa
- 5.3.5. Asia Pacific
- 5.1. Market Analysis, Insights and Forecast - by Service
- 6. Global APAC Auto Logistics Industry Analysis, Insights and Forecast, 2021-2033
- 6.1. Market Analysis, Insights and Forecast - by Service
- 6.1.1. Transportation
- 6.1.2. Warehousing, Distribution and Inventory Management
- 6.1.3. Other Services
- 6.2. Market Analysis, Insights and Forecast - by Type
- 6.2.1. Finished Vehicle
- 6.2.2. Auto Components
- 6.2.3. Other types
- 6.1. Market Analysis, Insights and Forecast - by Service
- 7. North America APAC Auto Logistics Industry Analysis, Insights and Forecast, 2020-2032
- 7.1. Market Analysis, Insights and Forecast - by Service
- 7.1.1. Transportation
- 7.1.2. Warehousing, Distribution and Inventory Management
- 7.1.3. Other Services
- 7.2. Market Analysis, Insights and Forecast - by Type
- 7.2.1. Finished Vehicle
- 7.2.2. Auto Components
- 7.2.3. Other types
- 7.1. Market Analysis, Insights and Forecast - by Service
- 8. South America APAC Auto Logistics Industry Analysis, Insights and Forecast, 2020-2032
- 8.1. Market Analysis, Insights and Forecast - by Service
- 8.1.1. Transportation
- 8.1.2. Warehousing, Distribution and Inventory Management
- 8.1.3. Other Services
- 8.2. Market Analysis, Insights and Forecast - by Type
- 8.2.1. Finished Vehicle
- 8.2.2. Auto Components
- 8.2.3. Other types
- 8.1. Market Analysis, Insights and Forecast - by Service
- 9. Europe APAC Auto Logistics Industry Analysis, Insights and Forecast, 2020-2032
- 9.1. Market Analysis, Insights and Forecast - by Service
- 9.1.1. Transportation
- 9.1.2. Warehousing, Distribution and Inventory Management
- 9.1.3. Other Services
- 9.2. Market Analysis, Insights and Forecast - by Type
- 9.2.1. Finished Vehicle
- 9.2.2. Auto Components
- 9.2.3. Other types
- 9.1. Market Analysis, Insights and Forecast - by Service
- 10. Middle East & Africa APAC Auto Logistics Industry Analysis, Insights and Forecast, 2020-2032
- 10.1. Market Analysis, Insights and Forecast - by Service
- 10.1.1. Transportation
- 10.1.2. Warehousing, Distribution and Inventory Management
- 10.1.3. Other Services
- 10.2. Market Analysis, Insights and Forecast - by Type
- 10.2.1. Finished Vehicle
- 10.2.2. Auto Components
- 10.2.3. Other types
- 10.1. Market Analysis, Insights and Forecast - by Service
- 11. Asia Pacific APAC Auto Logistics Industry Analysis, Insights and Forecast, 2020-2032
- 11.1. Market Analysis, Insights and Forecast - by Service
- 11.1.1. Transportation
- 11.1.2. Warehousing, Distribution and Inventory Management
- 11.1.3. Other Services
- 11.2. Market Analysis, Insights and Forecast - by Type
- 11.2.1. Finished Vehicle
- 11.2.2. Auto Components
- 11.2.3. Other types
- 11.1. Market Analysis, Insights and Forecast - by Service
- 12. Competitive Analysis
- 12.1. Company Profiles
- 12.1.1 DB Schenker
- 12.1.1.1. Company Overview
- 12.1.1.2. Products
- 12.1.1.3. Company Financials
- 12.1.1.4. SWOT Analysis
- 12.1.2 Hitachi Transport System Ltd
- 12.1.2.1. Company Overview
- 12.1.2.2. Products
- 12.1.2.3. Company Financials
- 12.1.2.4. SWOT Analysis
- 12.1.3 CEVA Logistics AG
- 12.1.3.1. Company Overview
- 12.1.3.2. Products
- 12.1.3.3. Company Financials
- 12.1.3.4. SWOT Analysis
- 12.1.4 Neovia Logistics Services LLC
- 12.1.4.1. Company Overview
- 12.1.4.2. Products
- 12.1.4.3. Company Financials
- 12.1.4.4. SWOT Analysis
- 12.1.5 DHL
- 12.1.5.1. Company Overview
- 12.1.5.2. Products
- 12.1.5.3. Company Financials
- 12.1.5.4. SWOT Analysis
- 12.1.6 Yusen Logistics Co Ltd
- 12.1.6.1. Company Overview
- 12.1.6.2. Products
- 12.1.6.3. Company Financials
- 12.1.6.4. SWOT Analysis
- 12.1.7 GEODIS
- 12.1.7.1. Company Overview
- 12.1.7.2. Products
- 12.1.7.3. Company Financials
- 12.1.7.4. SWOT Analysis
- 12.1.8 Nippon Express Co Ltd
- 12.1.8.1. Company Overview
- 12.1.8.2. Products
- 12.1.8.3. Company Financials
- 12.1.8.4. SWOT Analysis
- 12.1.9 United Parcel Service Inc**List Not Exhaustive
- 12.1.9.1. Company Overview
- 12.1.9.2. Products
- 12.1.9.3. Company Financials
- 12.1.9.4. SWOT Analysis
- 12.1.10 XPO Logistics Inc
- 12.1.10.1. Company Overview
- 12.1.10.2. Products
- 12.1.10.3. Company Financials
- 12.1.10.4. SWOT Analysis
- 12.1.11 KUEHNE + NAGEL International AG
- 12.1.11.1. Company Overview
- 12.1.11.2. Products
- 12.1.11.3. Company Financials
- 12.1.11.4. SWOT Analysis
- 12.1.12 DSV
- 12.1.12.1. Company Overview
- 12.1.12.2. Products
- 12.1.12.3. Company Financials
- 12.1.12.4. SWOT Analysis
- 12.1.13 Ryder System Inc
- 12.1.13.1. Company Overview
- 12.1.13.2. Products
- 12.1.13.3. Company Financials
- 12.1.13.4. SWOT Analysis
- 12.1.1 DB Schenker
- 12.2. Market Entropy
- 12.2.1 Company's Key Areas Served
- 12.2.2 Recent Developments
- 12.3. Company Market Share Analysis 2025
- 12.3.1 Top 5 Companies Market Share Analysis
- 12.3.2 Top 3 Companies Market Share Analysis
- 12.4. List of Potential Customers
- 13. Research Methodology
List of Figures
- Figure 1: Global APAC Auto Logistics Industry Revenue Breakdown (Million, %) by Region 2025 & 2033
- Figure 2: North America APAC Auto Logistics Industry Revenue (Million), by Service 2025 & 2033
- Figure 3: North America APAC Auto Logistics Industry Revenue Share (%), by Service 2025 & 2033
- Figure 4: North America APAC Auto Logistics Industry Revenue (Million), by Type 2025 & 2033
- Figure 5: North America APAC Auto Logistics Industry Revenue Share (%), by Type 2025 & 2033
- Figure 6: North America APAC Auto Logistics Industry Revenue (Million), by Country 2025 & 2033
- Figure 7: North America APAC Auto Logistics Industry Revenue Share (%), by Country 2025 & 2033
- Figure 8: South America APAC Auto Logistics Industry Revenue (Million), by Service 2025 & 2033
- Figure 9: South America APAC Auto Logistics Industry Revenue Share (%), by Service 2025 & 2033
- Figure 10: South America APAC Auto Logistics Industry Revenue (Million), by Type 2025 & 2033
- Figure 11: South America APAC Auto Logistics Industry Revenue Share (%), by Type 2025 & 2033
- Figure 12: South America APAC Auto Logistics Industry Revenue (Million), by Country 2025 & 2033
- Figure 13: South America APAC Auto Logistics Industry Revenue Share (%), by Country 2025 & 2033
- Figure 14: Europe APAC Auto Logistics Industry Revenue (Million), by Service 2025 & 2033
- Figure 15: Europe APAC Auto Logistics Industry Revenue Share (%), by Service 2025 & 2033
- Figure 16: Europe APAC Auto Logistics Industry Revenue (Million), by Type 2025 & 2033
- Figure 17: Europe APAC Auto Logistics Industry Revenue Share (%), by Type 2025 & 2033
- Figure 18: Europe APAC Auto Logistics Industry Revenue (Million), by Country 2025 & 2033
- Figure 19: Europe APAC Auto Logistics Industry Revenue Share (%), by Country 2025 & 2033
- Figure 20: Middle East & Africa APAC Auto Logistics Industry Revenue (Million), by Service 2025 & 2033
- Figure 21: Middle East & Africa APAC Auto Logistics Industry Revenue Share (%), by Service 2025 & 2033
- Figure 22: Middle East & Africa APAC Auto Logistics Industry Revenue (Million), by Type 2025 & 2033
- Figure 23: Middle East & Africa APAC Auto Logistics Industry Revenue Share (%), by Type 2025 & 2033
- Figure 24: Middle East & Africa APAC Auto Logistics Industry Revenue (Million), by Country 2025 & 2033
- Figure 25: Middle East & Africa APAC Auto Logistics Industry Revenue Share (%), by Country 2025 & 2033
- Figure 26: Asia Pacific APAC Auto Logistics Industry Revenue (Million), by Service 2025 & 2033
- Figure 27: Asia Pacific APAC Auto Logistics Industry Revenue Share (%), by Service 2025 & 2033
- Figure 28: Asia Pacific APAC Auto Logistics Industry Revenue (Million), by Type 2025 & 2033
- Figure 29: Asia Pacific APAC Auto Logistics Industry Revenue Share (%), by Type 2025 & 2033
- Figure 30: Asia Pacific APAC Auto Logistics Industry Revenue (Million), by Country 2025 & 2033
- Figure 31: Asia Pacific APAC Auto Logistics Industry Revenue Share (%), by Country 2025 & 2033
List of Tables
- Table 1: Global APAC Auto Logistics Industry Revenue Million Forecast, by Service 2020 & 2033
- Table 2: Global APAC Auto Logistics Industry Revenue Million Forecast, by Type 2020 & 2033
- Table 3: Global APAC Auto Logistics Industry Revenue Million Forecast, by Region 2020 & 2033
- Table 4: Global APAC Auto Logistics Industry Revenue Million Forecast, by Service 2020 & 2033
- Table 5: Global APAC Auto Logistics Industry Revenue Million Forecast, by Type 2020 & 2033
- Table 6: Global APAC Auto Logistics Industry Revenue Million Forecast, by Country 2020 & 2033
- Table 7: United States APAC Auto Logistics Industry Revenue (Million) Forecast, by Application 2020 & 2033
- Table 8: Canada APAC Auto Logistics Industry Revenue (Million) Forecast, by Application 2020 & 2033
- Table 9: Mexico APAC Auto Logistics Industry Revenue (Million) Forecast, by Application 2020 & 2033
- Table 10: Global APAC Auto Logistics Industry Revenue Million Forecast, by Service 2020 & 2033
- Table 11: Global APAC Auto Logistics Industry Revenue Million Forecast, by Type 2020 & 2033
- Table 12: Global APAC Auto Logistics Industry Revenue Million Forecast, by Country 2020 & 2033
- Table 13: Brazil APAC Auto Logistics Industry Revenue (Million) Forecast, by Application 2020 & 2033
- Table 14: Argentina APAC Auto Logistics Industry Revenue (Million) Forecast, by Application 2020 & 2033
- Table 15: Rest of South America APAC Auto Logistics Industry Revenue (Million) Forecast, by Application 2020 & 2033
- Table 16: Global APAC Auto Logistics Industry Revenue Million Forecast, by Service 2020 & 2033
- Table 17: Global APAC Auto Logistics Industry Revenue Million Forecast, by Type 2020 & 2033
- Table 18: Global APAC Auto Logistics Industry Revenue Million Forecast, by Country 2020 & 2033
- Table 19: United Kingdom APAC Auto Logistics Industry Revenue (Million) Forecast, by Application 2020 & 2033
- Table 20: Germany APAC Auto Logistics Industry Revenue (Million) Forecast, by Application 2020 & 2033
- Table 21: France APAC Auto Logistics Industry Revenue (Million) Forecast, by Application 2020 & 2033
- Table 22: Italy APAC Auto Logistics Industry Revenue (Million) Forecast, by Application 2020 & 2033
- Table 23: Spain APAC Auto Logistics Industry Revenue (Million) Forecast, by Application 2020 & 2033
- Table 24: Russia APAC Auto Logistics Industry Revenue (Million) Forecast, by Application 2020 & 2033
- Table 25: Benelux APAC Auto Logistics Industry Revenue (Million) Forecast, by Application 2020 & 2033
- Table 26: Nordics APAC Auto Logistics Industry Revenue (Million) Forecast, by Application 2020 & 2033
- Table 27: Rest of Europe APAC Auto Logistics Industry Revenue (Million) Forecast, by Application 2020 & 2033
- Table 28: Global APAC Auto Logistics Industry Revenue Million Forecast, by Service 2020 & 2033
- Table 29: Global APAC Auto Logistics Industry Revenue Million Forecast, by Type 2020 & 2033
- Table 30: Global APAC Auto Logistics Industry Revenue Million Forecast, by Country 2020 & 2033
- Table 31: Turkey APAC Auto Logistics Industry Revenue (Million) Forecast, by Application 2020 & 2033
- Table 32: Israel APAC Auto Logistics Industry Revenue (Million) Forecast, by Application 2020 & 2033
- Table 33: GCC APAC Auto Logistics Industry Revenue (Million) Forecast, by Application 2020 & 2033
- Table 34: North Africa APAC Auto Logistics Industry Revenue (Million) Forecast, by Application 2020 & 2033
- Table 35: South Africa APAC Auto Logistics Industry Revenue (Million) Forecast, by Application 2020 & 2033
- Table 36: Rest of Middle East & Africa APAC Auto Logistics Industry Revenue (Million) Forecast, by Application 2020 & 2033
- Table 37: Global APAC Auto Logistics Industry Revenue Million Forecast, by Service 2020 & 2033
- Table 38: Global APAC Auto Logistics Industry Revenue Million Forecast, by Type 2020 & 2033
- Table 39: Global APAC Auto Logistics Industry Revenue Million Forecast, by Country 2020 & 2033
- Table 40: China APAC Auto Logistics Industry Revenue (Million) Forecast, by Application 2020 & 2033
- Table 41: India APAC Auto Logistics Industry Revenue (Million) Forecast, by Application 2020 & 2033
- Table 42: Japan APAC Auto Logistics Industry Revenue (Million) Forecast, by Application 2020 & 2033
- Table 43: South Korea APAC Auto Logistics Industry Revenue (Million) Forecast, by Application 2020 & 2033
- Table 44: ASEAN APAC Auto Logistics Industry Revenue (Million) Forecast, by Application 2020 & 2033
- Table 45: Oceania APAC Auto Logistics Industry Revenue (Million) Forecast, by Application 2020 & 2033
- Table 46: Rest of Asia Pacific APAC Auto Logistics Industry Revenue (Million) Forecast, by Application 2020 & 2033
Frequently Asked Questions
1. What is the projected Compound Annual Growth Rate (CAGR) of the APAC Auto Logistics Industry?
The projected CAGR is approximately > 6.50%.
2. Which companies are prominent players in the APAC Auto Logistics Industry?
Key companies in the market include DB Schenker, Hitachi Transport System Ltd, CEVA Logistics AG, Neovia Logistics Services LLC, DHL, Yusen Logistics Co Ltd, GEODIS, Nippon Express Co Ltd, United Parcel Service Inc**List Not Exhaustive, XPO Logistics Inc, KUEHNE + NAGEL International AG, DSV, Ryder System Inc.
3. What are the main segments of the APAC Auto Logistics Industry?
The market segments include Service, Type.
4. Can you provide details about the market size?
The market size is estimated to be USD 289.04 Million as of 2022.
5. What are some drivers contributing to market growth?
Rising Number of Partnerships among Automobile Manufacturers and Logistics Partners; Growth in international trade.
6. What are the notable trends driving market growth?
Demand for Electric Vehicles are increasing in the region.
7. Are there any restraints impacting market growth?
Nature of Supply Chain Business.
8. Can you provide examples of recent developments in the market?
March 2023: Tata Motors, One of India’s leading automobile manufacturers and the pioneer of India’s EV evolution, received an order for providing 1000 XPRES-T EVs to OHM E Logistics Pvt. Ltd. in Hyderabad for their electric cab transportation services. These cars will be delivered to OHM E Logistics in a phased manner.
9. What pricing options are available for accessing the report?
Pricing options include single-user, multi-user, and enterprise licenses priced at USD 4750, USD 4950, and USD 6800 respectively.
10. Is the market size provided in terms of value or volume?
The market size is provided in terms of value, measured in Million.
11. Are there any specific market keywords associated with the report?
Yes, the market keyword associated with the report is "APAC Auto Logistics Industry," which aids in identifying and referencing the specific market segment covered.
12. How do I determine which pricing option suits my needs best?
The pricing options vary based on user requirements and access needs. Individual users may opt for single-user licenses, while businesses requiring broader access may choose multi-user or enterprise licenses for cost-effective access to the report.
13. Are there any additional resources or data provided in the APAC Auto Logistics Industry report?
While the report offers comprehensive insights, it's advisable to review the specific contents or supplementary materials provided to ascertain if additional resources or data are available.
14. How can I stay updated on further developments or reports in the APAC Auto Logistics Industry?
To stay informed about further developments, trends, and reports in the APAC Auto Logistics Industry, consider subscribing to industry newsletters, following relevant companies and organizations, or regularly checking reputable industry news sources and publications.
Methodology
Step 1 - Identification of Relevant Samples Size from Population Database


Step 2 - Approaches for Defining Global Market Size (Value, Volume* & Price*)

Note*: In applicable scenarios
Step 3 - Data Sources
Primary Research
- Web Analytics
- Survey Reports
- Research Institute
- Latest Research Reports
- Opinion Leaders
Secondary Research
- Annual Reports
- White Paper
- Latest Press Release
- Industry Association
- Paid Database
- Investor Presentations

Step 4 - Data Triangulation
Involves using different sources of information in order to increase the validity of a study
These sources are likely to be stakeholders in a program - participants, other researchers, program staff, other community members, and so on.
Then we put all data in single framework & apply various statistical tools to find out the dynamic on the market.
During the analysis stage, feedback from the stakeholder groups would be compared to determine areas of agreement as well as areas of divergence