

Key Insights
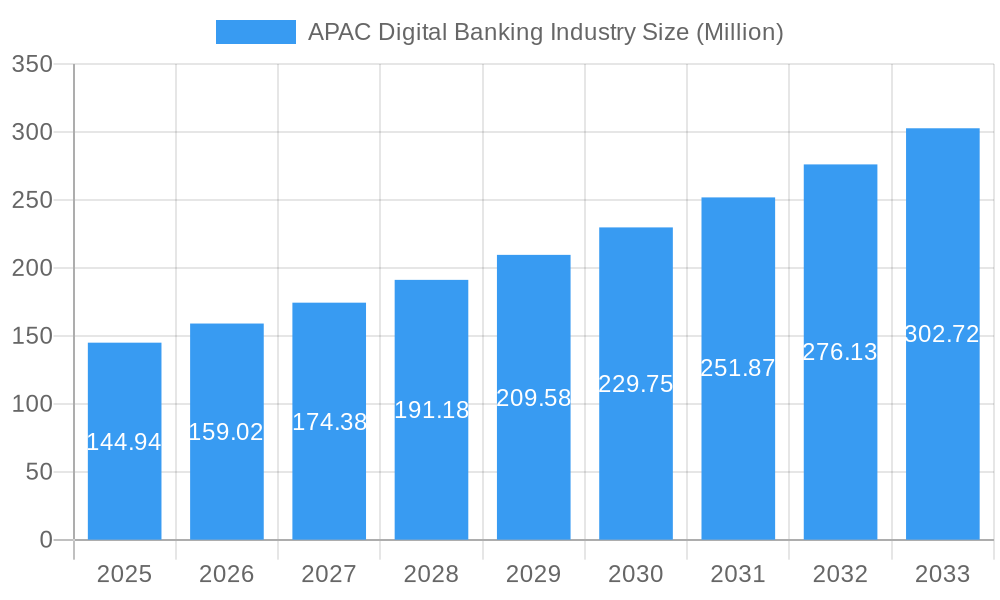
The APAC digital banking industry is experiencing robust growth, projected to reach a market size of $144.94 million in 2025 and exhibiting a Compound Annual Growth Rate (CAGR) of 9.80% from 2019 to 2033. This expansion is fueled by several key drivers. Increasing smartphone penetration and internet access across the region are significantly broadening the user base for digital banking services. Furthermore, the rising adoption of fintech solutions, coupled with government initiatives promoting financial inclusion, are accelerating the shift towards digital platforms. Consumers are increasingly drawn to the convenience, speed, and cost-effectiveness offered by digital banking, compared to traditional banking methods. Competition among established players and innovative fintech startups is also intensifying, leading to enhanced service offerings and increased investment in technology. However, challenges remain, including cybersecurity concerns, data privacy issues, and the digital literacy gap in certain segments of the population. Addressing these concerns will be crucial for sustained, inclusive growth.
APAC Digital Banking Industry Market Size (In Million)
The forecast period (2025-2033) anticipates continued strong growth, driven by factors such as the expansion of e-commerce, the increasing popularity of mobile payments, and the development of sophisticated AI-powered financial services. Key players like ZestMoney, MoneyTap, Paytm, and others are strategically investing in enhancing their platforms, expanding their product offerings, and targeting underserved markets. Regional variations in growth rates are expected, with countries experiencing faster economic development and higher levels of digital adoption likely to show more significant expansion. The industry's segmentation will likely evolve, with the emergence of specialized digital banking services tailored to specific customer demographics and needs. Continuous innovation in areas such as open banking and blockchain technology is set to further reshape the competitive landscape and accelerate the industry's overall growth trajectory.
APAC Digital Banking Industry Company Market Share
APAC Digital Banking Industry: A Comprehensive Market Report (2019-2033)
This dynamic report provides a deep dive into the burgeoning APAC digital banking industry, offering invaluable insights for investors, industry professionals, and strategic planners. With a comprehensive analysis spanning from 2019 to 2033 (historical period: 2019-2024, base year: 2025, forecast period: 2025-2033), this report leverages extensive market research to deliver crucial data and future projections. The market is expected to reach xx Million by 2033, demonstrating substantial growth potential.
APAC Digital Banking Industry Market Structure & Competitive Landscape
The APAC digital banking market exhibits a complex interplay of established players and agile fintech disruptors. Market concentration is moderate, with a few dominant players alongside numerous niche players. Concentration ratios vary significantly across countries and segments, ranging from xx% in mature markets to xx% in emerging markets. Innovation is a key driver, with continuous advancements in AI, blockchain, and mobile payment technologies shaping the competitive landscape. Regulatory changes, particularly regarding data privacy and open banking, exert a profound influence, creating both opportunities and challenges. Product substitutes, such as mobile wallets and peer-to-peer payment platforms, pose competitive threats. End-user segmentation is evolving, with distinct needs for retail, corporate, and SME banking clients. M&A activity is robust, with significant transactions occurring in the past five years, totaling an estimated xx Million USD.
- Market Concentration: Moderate, with regional variations.
- Innovation Drivers: AI, Blockchain, Mobile Payments.
- Regulatory Impacts: Significant, influencing data privacy and open banking.
- Product Substitutes: Mobile Wallets, Peer-to-Peer Payments.
- End-User Segmentation: Retail, Corporate, SME.
- M&A Trends: Robust, with xx Million USD in transactions (2019-2024).
APAC Digital Banking Industry Market Trends & Opportunities
The APAC digital banking market is experiencing exponential growth, driven by several key trends. Market size is expanding rapidly, exhibiting a CAGR of xx% during the forecast period (2025-2033). Technological shifts, including the rise of cloud computing, big data analytics, and embedded finance, are reshaping business models. Consumer preferences are shifting towards personalized, seamless, and secure digital banking experiences. Competitive dynamics are characterized by both collaboration and competition, with partnerships and strategic alliances becoming increasingly prevalent. Market penetration rates for digital banking services vary widely across countries, with higher adoption rates in more technologically advanced economies.
Dominant Markets & Segments in APAC Digital Banking Industry
China and India currently dominate the APAC digital banking market, driven by their large populations and rapid technological advancements. Other key markets include Singapore, Australia, and South Korea. Within the market, mobile banking and digital payments are the fastest-growing segments.
- Key Growth Drivers in China: Robust infrastructure, supportive government policies, and high mobile penetration.
- Key Growth Drivers in India: Rising smartphone adoption, increasing internet penetration, and a large unbanked population.
- Key Growth Drivers in Other Markets: Focus on fintech innovation, progressive regulatory frameworks, and high levels of financial literacy.
China's dominance stems from its advanced technological infrastructure, supportive government policies, and a vast population of digitally savvy consumers. India's growth is fueled by the large unbanked population adopting digital banking solutions rapidly.
APAP Digital Banking Industry Product Analysis
Product innovation in APAP digital banking focuses on enhancing user experience, security, and personalization. The integration of AI and machine learning powers personalized financial management tools, fraud detection systems, and improved customer service. Open banking initiatives are facilitating greater interoperability between financial institutions and third-party providers. The key competitive advantages lie in providing secure, seamless, and personalized digital banking solutions tailored to specific customer segments.
Key Drivers, Barriers & Challenges in APAC Digital Banking Industry
Key Drivers:
- Technological advancements: AI, machine learning, blockchain, and cloud computing are driving efficiency and innovation.
- Economic growth: Rising disposable incomes and increased financial inclusion are boosting demand.
- Government support: Favorable regulatory environments and initiatives promoting digitalization are stimulating growth.
Challenges:
- Regulatory hurdles: Varying regulatory frameworks across countries can create compliance complexities.
- Cybersecurity threats: The increasing reliance on digital platforms raises concerns about data breaches and fraud.
- Digital literacy: A lack of digital literacy among certain segments of the population hinders broader adoption. This results in a xx Million USD loss annually (estimated).
Growth Drivers in the APAC Digital Banking Industry Market
Technological advancements, particularly in AI and mobile technology, are significantly fueling market growth. Expanding internet and smartphone penetration, combined with rising disposable incomes, are also major contributors. Supportive government policies promoting financial inclusion and digitalization are further accelerating growth.
Challenges Impacting APAC Digital Banking Industry Growth
Stringent regulatory requirements, particularly around data privacy and cybersecurity, create hurdles. Concerns around data security and potential breaches can deter adoption. The highly competitive landscape, with many established players and numerous fintech startups, presents significant challenges for maintaining market share.
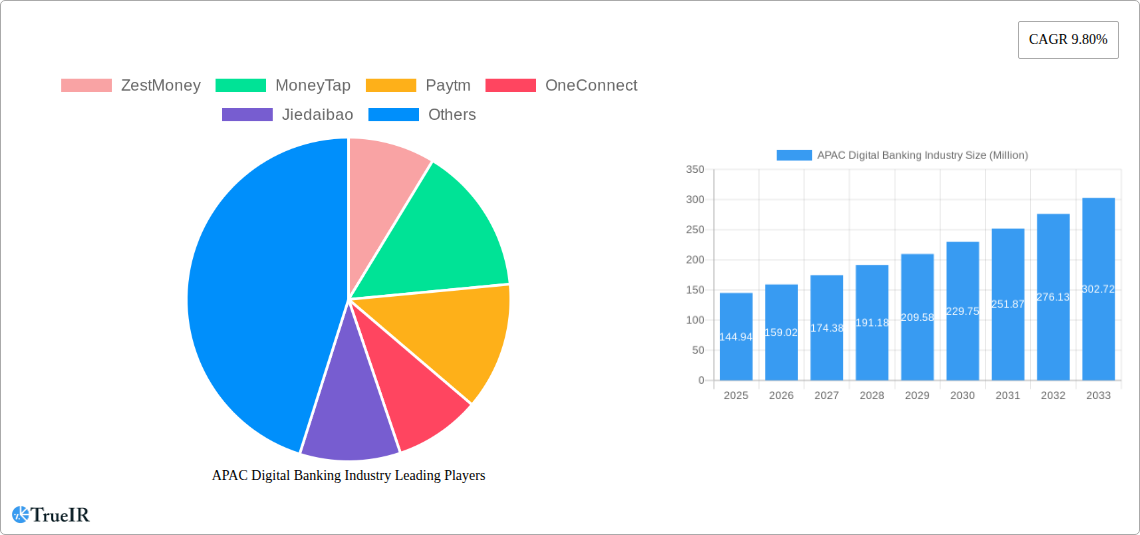
Key Players Shaping the APAC Digital Banking Industry Market
- ZestMoney
- MoneyTap
- Paytm
- OneConnect
- Jiedaibao
- Money Forward
- Kyash
- Moneycatcha
- Policybazaar
- Razorpay (List Not Exhaustive)
Significant APAC Digital Banking Industry Milestones
- January 2023: Yes Bank partners with Falcon BaaS to expand in embedded finance.
- September 2023: Standard Chartered launches Audax Financial Technology BaaS product.
Future Outlook for APAC Digital Banking Industry Market
The APAC digital banking market is poised for continued robust growth, driven by sustained technological innovation, expanding internet and mobile penetration, and supportive government policies. Strategic opportunities abound for companies that can offer secure, personalized, and seamless digital banking experiences. The market's future potential is immense, with significant opportunities for expansion across various segments and geographies.
APAC Digital Banking Industry Segmentation
-
1. Type
- 1.1. API Based BaaS
- 1.2. Cloud Based BaaS
-
2. Service Type
- 2.1. Payment Process Services
- 2.2. Digital Banking Services
- 2.3. KYC Service
- 2.4. Customer Support Services
- 2.5. Others
-
3. Enterprise
- 3.1. Large Enterprise
- 3.2. Small & Medium Enterprise
APAC Digital Banking Industry Segmentation By Geography
-
1. North America
- 1.1. United States
- 1.2. Canada
- 1.3. Mexico
-
2. South America
- 2.1. Brazil
- 2.2. Argentina
- 2.3. Rest of South America
-
3. Europe
- 3.1. United Kingdom
- 3.2. Germany
- 3.3. France
- 3.4. Italy
- 3.5. Spain
- 3.6. Russia
- 3.7. Benelux
- 3.8. Nordics
- 3.9. Rest of Europe
-
4. Middle East & Africa
- 4.1. Turkey
- 4.2. Israel
- 4.3. GCC
- 4.4. North Africa
- 4.5. South Africa
- 4.6. Rest of Middle East & Africa
-
5. Asia Pacific
- 5.1. China
- 5.2. India
- 5.3. Japan
- 5.4. South Korea
- 5.5. ASEAN
- 5.6. Oceania
- 5.7. Rest of Asia Pacific
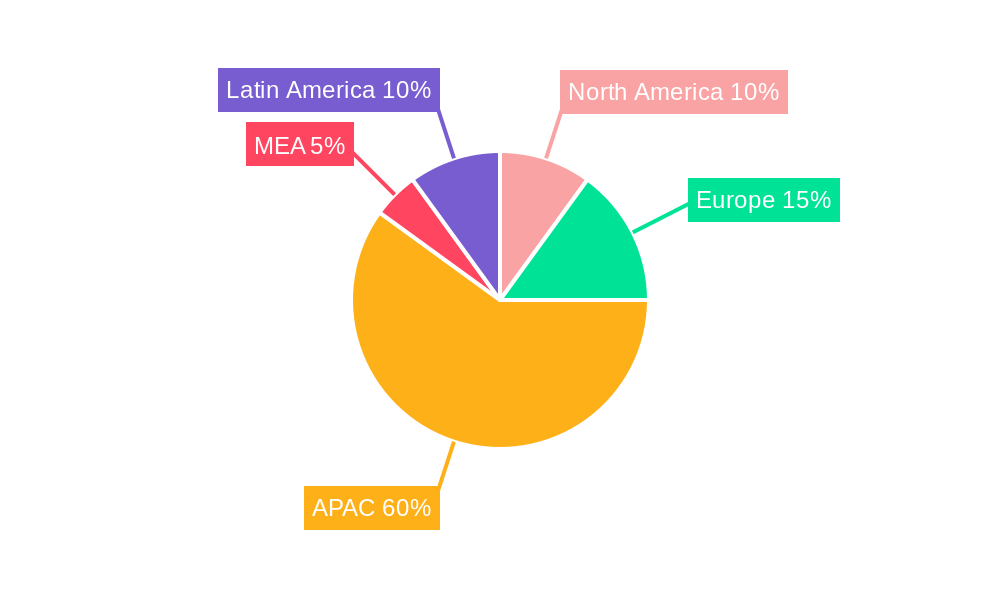
APAC Digital Banking Industry Regional Market Share
Geographic Coverage of APAC Digital Banking Industry
APAC Digital Banking Industry REPORT HIGHLIGHTS
| Aspects | Details |
|---|---|
| Study Period | 2020-2034 |
| Base Year | 2025 |
| Estimated Year | 2026 |
| Forecast Period | 2026-2034 |
| Historical Period | 2020-2025 |
| Growth Rate | CAGR of 9.80% from 2020-2034 |
| Segmentation |
|
Table of Contents
- 1. Introduction
- 1.1. Research Scope
- 1.2. Market Segmentation
- 1.3. Research Objective
- 1.4. Definitions and Assumptions
- 2. Executive Summary
- 2.1. Market Snapshot
- 3. Market Dynamics
- 3.1. Market Drivers
- 3.2. Market Restrains
- 3.3. Market Trends
- 3.4. Market Opportunities
- 4. Market Factor Analysis
- 4.1. Porters Five Forces
- 4.1.1. Bargaining Power of Suppliers
- 4.1.2. Bargaining Power of Buyers
- 4.1.3. Threat of New Entrants
- 4.1.4. Threat of Substitutes
- 4.1.5. Competitive Rivalry
- 4.2. PESTEL analysis
- 4.3. BCG Analysis
- 4.3.1. Stars (High Growth, High Market Share)
- 4.3.2. Cash Cows (Low Growth, High Market Share)
- 4.3.3. Question Mark (High Growth, Low Market Share)
- 4.3.4. Dogs (Low Growth, Low Market Share)
- 4.4. Ansoff Matrix Analysis
- 4.5. Supply Chain Analysis
- 4.6. Regulatory Landscape
- 4.7. Current Market Potential and Opportunity Assessment (TAM–SAM–SOM Framework)
- 4.8. TIR Analyst Note
- 4.1. Porters Five Forces
- 5. Market Analysis, Insights and Forecast 2021-2033
- 5.1. Market Analysis, Insights and Forecast - by Type
- 5.1.1. API Based BaaS
- 5.1.2. Cloud Based BaaS
- 5.2. Market Analysis, Insights and Forecast - by Service Type
- 5.2.1. Payment Process Services
- 5.2.2. Digital Banking Services
- 5.2.3. KYC Service
- 5.2.4. Customer Support Services
- 5.2.5. Others
- 5.3. Market Analysis, Insights and Forecast - by Enterprise
- 5.3.1. Large Enterprise
- 5.3.2. Small & Medium Enterprise
- 5.4. Market Analysis, Insights and Forecast - by Region
- 5.4.1. North America
- 5.4.2. South America
- 5.4.3. Europe
- 5.4.4. Middle East & Africa
- 5.4.5. Asia Pacific
- 5.1. Market Analysis, Insights and Forecast - by Type
- 6. Global APAC Digital Banking Industry Analysis, Insights and Forecast, 2021-2033
- 6.1. Market Analysis, Insights and Forecast - by Type
- 6.1.1. API Based BaaS
- 6.1.2. Cloud Based BaaS
- 6.2. Market Analysis, Insights and Forecast - by Service Type
- 6.2.1. Payment Process Services
- 6.2.2. Digital Banking Services
- 6.2.3. KYC Service
- 6.2.4. Customer Support Services
- 6.2.5. Others
- 6.3. Market Analysis, Insights and Forecast - by Enterprise
- 6.3.1. Large Enterprise
- 6.3.2. Small & Medium Enterprise
- 6.1. Market Analysis, Insights and Forecast - by Type
- 7. North America APAC Digital Banking Industry Analysis, Insights and Forecast, 2020-2032
- 7.1. Market Analysis, Insights and Forecast - by Type
- 7.1.1. API Based BaaS
- 7.1.2. Cloud Based BaaS
- 7.2. Market Analysis, Insights and Forecast - by Service Type
- 7.2.1. Payment Process Services
- 7.2.2. Digital Banking Services
- 7.2.3. KYC Service
- 7.2.4. Customer Support Services
- 7.2.5. Others
- 7.3. Market Analysis, Insights and Forecast - by Enterprise
- 7.3.1. Large Enterprise
- 7.3.2. Small & Medium Enterprise
- 7.1. Market Analysis, Insights and Forecast - by Type
- 8. South America APAC Digital Banking Industry Analysis, Insights and Forecast, 2020-2032
- 8.1. Market Analysis, Insights and Forecast - by Type
- 8.1.1. API Based BaaS
- 8.1.2. Cloud Based BaaS
- 8.2. Market Analysis, Insights and Forecast - by Service Type
- 8.2.1. Payment Process Services
- 8.2.2. Digital Banking Services
- 8.2.3. KYC Service
- 8.2.4. Customer Support Services
- 8.2.5. Others
- 8.3. Market Analysis, Insights and Forecast - by Enterprise
- 8.3.1. Large Enterprise
- 8.3.2. Small & Medium Enterprise
- 8.1. Market Analysis, Insights and Forecast - by Type
- 9. Europe APAC Digital Banking Industry Analysis, Insights and Forecast, 2020-2032
- 9.1. Market Analysis, Insights and Forecast - by Type
- 9.1.1. API Based BaaS
- 9.1.2. Cloud Based BaaS
- 9.2. Market Analysis, Insights and Forecast - by Service Type
- 9.2.1. Payment Process Services
- 9.2.2. Digital Banking Services
- 9.2.3. KYC Service
- 9.2.4. Customer Support Services
- 9.2.5. Others
- 9.3. Market Analysis, Insights and Forecast - by Enterprise
- 9.3.1. Large Enterprise
- 9.3.2. Small & Medium Enterprise
- 9.1. Market Analysis, Insights and Forecast - by Type
- 10. Middle East & Africa APAC Digital Banking Industry Analysis, Insights and Forecast, 2020-2032
- 10.1. Market Analysis, Insights and Forecast - by Type
- 10.1.1. API Based BaaS
- 10.1.2. Cloud Based BaaS
- 10.2. Market Analysis, Insights and Forecast - by Service Type
- 10.2.1. Payment Process Services
- 10.2.2. Digital Banking Services
- 10.2.3. KYC Service
- 10.2.4. Customer Support Services
- 10.2.5. Others
- 10.3. Market Analysis, Insights and Forecast - by Enterprise
- 10.3.1. Large Enterprise
- 10.3.2. Small & Medium Enterprise
- 10.1. Market Analysis, Insights and Forecast - by Type
- 11. Asia Pacific APAC Digital Banking Industry Analysis, Insights and Forecast, 2020-2032
- 11.1. Market Analysis, Insights and Forecast - by Type
- 11.1.1. API Based BaaS
- 11.1.2. Cloud Based BaaS
- 11.2. Market Analysis, Insights and Forecast - by Service Type
- 11.2.1. Payment Process Services
- 11.2.2. Digital Banking Services
- 11.2.3. KYC Service
- 11.2.4. Customer Support Services
- 11.2.5. Others
- 11.3. Market Analysis, Insights and Forecast - by Enterprise
- 11.3.1. Large Enterprise
- 11.3.2. Small & Medium Enterprise
- 11.1. Market Analysis, Insights and Forecast - by Type
- 12. Competitive Analysis
- 12.1. Company Profiles
- 12.1.1 ZestMoney
- 12.1.1.1. Company Overview
- 12.1.1.2. Products
- 12.1.1.3. Company Financials
- 12.1.1.4. SWOT Analysis
- 12.1.2 MoneyTap
- 12.1.2.1. Company Overview
- 12.1.2.2. Products
- 12.1.2.3. Company Financials
- 12.1.2.4. SWOT Analysis
- 12.1.3 Paytm
- 12.1.3.1. Company Overview
- 12.1.3.2. Products
- 12.1.3.3. Company Financials
- 12.1.3.4. SWOT Analysis
- 12.1.4 OneConnect
- 12.1.4.1. Company Overview
- 12.1.4.2. Products
- 12.1.4.3. Company Financials
- 12.1.4.4. SWOT Analysis
- 12.1.5 Jiedaibao
- 12.1.5.1. Company Overview
- 12.1.5.2. Products
- 12.1.5.3. Company Financials
- 12.1.5.4. SWOT Analysis
- 12.1.6 Money Forward
- 12.1.6.1. Company Overview
- 12.1.6.2. Products
- 12.1.6.3. Company Financials
- 12.1.6.4. SWOT Analysis
- 12.1.7 Kyash
- 12.1.7.1. Company Overview
- 12.1.7.2. Products
- 12.1.7.3. Company Financials
- 12.1.7.4. SWOT Analysis
- 12.1.8 Moneycatcha
- 12.1.8.1. Company Overview
- 12.1.8.2. Products
- 12.1.8.3. Company Financials
- 12.1.8.4. SWOT Analysis
- 12.1.9 Policybazaar
- 12.1.9.1. Company Overview
- 12.1.9.2. Products
- 12.1.9.3. Company Financials
- 12.1.9.4. SWOT Analysis
- 12.1.10 Razorpay**List Not Exhaustive
- 12.1.10.1. Company Overview
- 12.1.10.2. Products
- 12.1.10.3. Company Financials
- 12.1.10.4. SWOT Analysis
- 12.1.1 ZestMoney
- 12.2. Market Entropy
- 12.2.1 Company's Key Areas Served
- 12.2.2 Recent Developments
- 12.3. Company Market Share Analysis 2025
- 12.3.1 Top 5 Companies Market Share Analysis
- 12.3.2 Top 3 Companies Market Share Analysis
- 12.4. List of Potential Customers
- 13. Research Methodology
List of Figures
- Figure 1: Global APAC Digital Banking Industry Revenue Breakdown (Million, %) by Region 2025 & 2033
- Figure 2: Global APAC Digital Banking Industry Volume Breakdown (Billion, %) by Region 2025 & 2033
- Figure 3: North America APAC Digital Banking Industry Revenue (Million), by Type 2025 & 2033
- Figure 4: North America APAC Digital Banking Industry Volume (Billion), by Type 2025 & 2033
- Figure 5: North America APAC Digital Banking Industry Revenue Share (%), by Type 2025 & 2033
- Figure 6: North America APAC Digital Banking Industry Volume Share (%), by Type 2025 & 2033
- Figure 7: North America APAC Digital Banking Industry Revenue (Million), by Service Type 2025 & 2033
- Figure 8: North America APAC Digital Banking Industry Volume (Billion), by Service Type 2025 & 2033
- Figure 9: North America APAC Digital Banking Industry Revenue Share (%), by Service Type 2025 & 2033
- Figure 10: North America APAC Digital Banking Industry Volume Share (%), by Service Type 2025 & 2033
- Figure 11: North America APAC Digital Banking Industry Revenue (Million), by Enterprise 2025 & 2033
- Figure 12: North America APAC Digital Banking Industry Volume (Billion), by Enterprise 2025 & 2033
- Figure 13: North America APAC Digital Banking Industry Revenue Share (%), by Enterprise 2025 & 2033
- Figure 14: North America APAC Digital Banking Industry Volume Share (%), by Enterprise 2025 & 2033
- Figure 15: North America APAC Digital Banking Industry Revenue (Million), by Country 2025 & 2033
- Figure 16: North America APAC Digital Banking Industry Volume (Billion), by Country 2025 & 2033
- Figure 17: North America APAC Digital Banking Industry Revenue Share (%), by Country 2025 & 2033
- Figure 18: North America APAC Digital Banking Industry Volume Share (%), by Country 2025 & 2033
- Figure 19: South America APAC Digital Banking Industry Revenue (Million), by Type 2025 & 2033
- Figure 20: South America APAC Digital Banking Industry Volume (Billion), by Type 2025 & 2033
- Figure 21: South America APAC Digital Banking Industry Revenue Share (%), by Type 2025 & 2033
- Figure 22: South America APAC Digital Banking Industry Volume Share (%), by Type 2025 & 2033
- Figure 23: South America APAC Digital Banking Industry Revenue (Million), by Service Type 2025 & 2033
- Figure 24: South America APAC Digital Banking Industry Volume (Billion), by Service Type 2025 & 2033
- Figure 25: South America APAC Digital Banking Industry Revenue Share (%), by Service Type 2025 & 2033
- Figure 26: South America APAC Digital Banking Industry Volume Share (%), by Service Type 2025 & 2033
- Figure 27: South America APAC Digital Banking Industry Revenue (Million), by Enterprise 2025 & 2033
- Figure 28: South America APAC Digital Banking Industry Volume (Billion), by Enterprise 2025 & 2033
- Figure 29: South America APAC Digital Banking Industry Revenue Share (%), by Enterprise 2025 & 2033
- Figure 30: South America APAC Digital Banking Industry Volume Share (%), by Enterprise 2025 & 2033
- Figure 31: South America APAC Digital Banking Industry Revenue (Million), by Country 2025 & 2033
- Figure 32: South America APAC Digital Banking Industry Volume (Billion), by Country 2025 & 2033
- Figure 33: South America APAC Digital Banking Industry Revenue Share (%), by Country 2025 & 2033
- Figure 34: South America APAC Digital Banking Industry Volume Share (%), by Country 2025 & 2033
- Figure 35: Europe APAC Digital Banking Industry Revenue (Million), by Type 2025 & 2033
- Figure 36: Europe APAC Digital Banking Industry Volume (Billion), by Type 2025 & 2033
- Figure 37: Europe APAC Digital Banking Industry Revenue Share (%), by Type 2025 & 2033
- Figure 38: Europe APAC Digital Banking Industry Volume Share (%), by Type 2025 & 2033
- Figure 39: Europe APAC Digital Banking Industry Revenue (Million), by Service Type 2025 & 2033
- Figure 40: Europe APAC Digital Banking Industry Volume (Billion), by Service Type 2025 & 2033
- Figure 41: Europe APAC Digital Banking Industry Revenue Share (%), by Service Type 2025 & 2033
- Figure 42: Europe APAC Digital Banking Industry Volume Share (%), by Service Type 2025 & 2033
- Figure 43: Europe APAC Digital Banking Industry Revenue (Million), by Enterprise 2025 & 2033
- Figure 44: Europe APAC Digital Banking Industry Volume (Billion), by Enterprise 2025 & 2033
- Figure 45: Europe APAC Digital Banking Industry Revenue Share (%), by Enterprise 2025 & 2033
- Figure 46: Europe APAC Digital Banking Industry Volume Share (%), by Enterprise 2025 & 2033
- Figure 47: Europe APAC Digital Banking Industry Revenue (Million), by Country 2025 & 2033
- Figure 48: Europe APAC Digital Banking Industry Volume (Billion), by Country 2025 & 2033
- Figure 49: Europe APAC Digital Banking Industry Revenue Share (%), by Country 2025 & 2033
- Figure 50: Europe APAC Digital Banking Industry Volume Share (%), by Country 2025 & 2033
- Figure 51: Middle East & Africa APAC Digital Banking Industry Revenue (Million), by Type 2025 & 2033
- Figure 52: Middle East & Africa APAC Digital Banking Industry Volume (Billion), by Type 2025 & 2033
- Figure 53: Middle East & Africa APAC Digital Banking Industry Revenue Share (%), by Type 2025 & 2033
- Figure 54: Middle East & Africa APAC Digital Banking Industry Volume Share (%), by Type 2025 & 2033
- Figure 55: Middle East & Africa APAC Digital Banking Industry Revenue (Million), by Service Type 2025 & 2033
- Figure 56: Middle East & Africa APAC Digital Banking Industry Volume (Billion), by Service Type 2025 & 2033
- Figure 57: Middle East & Africa APAC Digital Banking Industry Revenue Share (%), by Service Type 2025 & 2033
- Figure 58: Middle East & Africa APAC Digital Banking Industry Volume Share (%), by Service Type 2025 & 2033
- Figure 59: Middle East & Africa APAC Digital Banking Industry Revenue (Million), by Enterprise 2025 & 2033
- Figure 60: Middle East & Africa APAC Digital Banking Industry Volume (Billion), by Enterprise 2025 & 2033
- Figure 61: Middle East & Africa APAC Digital Banking Industry Revenue Share (%), by Enterprise 2025 & 2033
- Figure 62: Middle East & Africa APAC Digital Banking Industry Volume Share (%), by Enterprise 2025 & 2033
- Figure 63: Middle East & Africa APAC Digital Banking Industry Revenue (Million), by Country 2025 & 2033
- Figure 64: Middle East & Africa APAC Digital Banking Industry Volume (Billion), by Country 2025 & 2033
- Figure 65: Middle East & Africa APAC Digital Banking Industry Revenue Share (%), by Country 2025 & 2033
- Figure 66: Middle East & Africa APAC Digital Banking Industry Volume Share (%), by Country 2025 & 2033
- Figure 67: Asia Pacific APAC Digital Banking Industry Revenue (Million), by Type 2025 & 2033
- Figure 68: Asia Pacific APAC Digital Banking Industry Volume (Billion), by Type 2025 & 2033
- Figure 69: Asia Pacific APAC Digital Banking Industry Revenue Share (%), by Type 2025 & 2033
- Figure 70: Asia Pacific APAC Digital Banking Industry Volume Share (%), by Type 2025 & 2033
- Figure 71: Asia Pacific APAC Digital Banking Industry Revenue (Million), by Service Type 2025 & 2033
- Figure 72: Asia Pacific APAC Digital Banking Industry Volume (Billion), by Service Type 2025 & 2033
- Figure 73: Asia Pacific APAC Digital Banking Industry Revenue Share (%), by Service Type 2025 & 2033
- Figure 74: Asia Pacific APAC Digital Banking Industry Volume Share (%), by Service Type 2025 & 2033
- Figure 75: Asia Pacific APAC Digital Banking Industry Revenue (Million), by Enterprise 2025 & 2033
- Figure 76: Asia Pacific APAC Digital Banking Industry Volume (Billion), by Enterprise 2025 & 2033
- Figure 77: Asia Pacific APAC Digital Banking Industry Revenue Share (%), by Enterprise 2025 & 2033
- Figure 78: Asia Pacific APAC Digital Banking Industry Volume Share (%), by Enterprise 2025 & 2033
- Figure 79: Asia Pacific APAC Digital Banking Industry Revenue (Million), by Country 2025 & 2033
- Figure 80: Asia Pacific APAC Digital Banking Industry Volume (Billion), by Country 2025 & 2033
- Figure 81: Asia Pacific APAC Digital Banking Industry Revenue Share (%), by Country 2025 & 2033
- Figure 82: Asia Pacific APAC Digital Banking Industry Volume Share (%), by Country 2025 & 2033
List of Tables
- Table 1: Global APAC Digital Banking Industry Revenue Million Forecast, by Type 2020 & 2033
- Table 2: Global APAC Digital Banking Industry Volume Billion Forecast, by Type 2020 & 2033
- Table 3: Global APAC Digital Banking Industry Revenue Million Forecast, by Service Type 2020 & 2033
- Table 4: Global APAC Digital Banking Industry Volume Billion Forecast, by Service Type 2020 & 2033
- Table 5: Global APAC Digital Banking Industry Revenue Million Forecast, by Enterprise 2020 & 2033
- Table 6: Global APAC Digital Banking Industry Volume Billion Forecast, by Enterprise 2020 & 2033
- Table 7: Global APAC Digital Banking Industry Revenue Million Forecast, by Region 2020 & 2033
- Table 8: Global APAC Digital Banking Industry Volume Billion Forecast, by Region 2020 & 2033
- Table 9: Global APAC Digital Banking Industry Revenue Million Forecast, by Type 2020 & 2033
- Table 10: Global APAC Digital Banking Industry Volume Billion Forecast, by Type 2020 & 2033
- Table 11: Global APAC Digital Banking Industry Revenue Million Forecast, by Service Type 2020 & 2033
- Table 12: Global APAC Digital Banking Industry Volume Billion Forecast, by Service Type 2020 & 2033
- Table 13: Global APAC Digital Banking Industry Revenue Million Forecast, by Enterprise 2020 & 2033
- Table 14: Global APAC Digital Banking Industry Volume Billion Forecast, by Enterprise 2020 & 2033
- Table 15: Global APAC Digital Banking Industry Revenue Million Forecast, by Country 2020 & 2033
- Table 16: Global APAC Digital Banking Industry Volume Billion Forecast, by Country 2020 & 2033
- Table 17: United States APAC Digital Banking Industry Revenue (Million) Forecast, by Application 2020 & 2033
- Table 18: United States APAC Digital Banking Industry Volume (Billion) Forecast, by Application 2020 & 2033
- Table 19: Canada APAC Digital Banking Industry Revenue (Million) Forecast, by Application 2020 & 2033
- Table 20: Canada APAC Digital Banking Industry Volume (Billion) Forecast, by Application 2020 & 2033
- Table 21: Mexico APAC Digital Banking Industry Revenue (Million) Forecast, by Application 2020 & 2033
- Table 22: Mexico APAC Digital Banking Industry Volume (Billion) Forecast, by Application 2020 & 2033
- Table 23: Global APAC Digital Banking Industry Revenue Million Forecast, by Type 2020 & 2033
- Table 24: Global APAC Digital Banking Industry Volume Billion Forecast, by Type 2020 & 2033
- Table 25: Global APAC Digital Banking Industry Revenue Million Forecast, by Service Type 2020 & 2033
- Table 26: Global APAC Digital Banking Industry Volume Billion Forecast, by Service Type 2020 & 2033
- Table 27: Global APAC Digital Banking Industry Revenue Million Forecast, by Enterprise 2020 & 2033
- Table 28: Global APAC Digital Banking Industry Volume Billion Forecast, by Enterprise 2020 & 2033
- Table 29: Global APAC Digital Banking Industry Revenue Million Forecast, by Country 2020 & 2033
- Table 30: Global APAC Digital Banking Industry Volume Billion Forecast, by Country 2020 & 2033
- Table 31: Brazil APAC Digital Banking Industry Revenue (Million) Forecast, by Application 2020 & 2033
- Table 32: Brazil APAC Digital Banking Industry Volume (Billion) Forecast, by Application 2020 & 2033
- Table 33: Argentina APAC Digital Banking Industry Revenue (Million) Forecast, by Application 2020 & 2033
- Table 34: Argentina APAC Digital Banking Industry Volume (Billion) Forecast, by Application 2020 & 2033
- Table 35: Rest of South America APAC Digital Banking Industry Revenue (Million) Forecast, by Application 2020 & 2033
- Table 36: Rest of South America APAC Digital Banking Industry Volume (Billion) Forecast, by Application 2020 & 2033
- Table 37: Global APAC Digital Banking Industry Revenue Million Forecast, by Type 2020 & 2033
- Table 38: Global APAC Digital Banking Industry Volume Billion Forecast, by Type 2020 & 2033
- Table 39: Global APAC Digital Banking Industry Revenue Million Forecast, by Service Type 2020 & 2033
- Table 40: Global APAC Digital Banking Industry Volume Billion Forecast, by Service Type 2020 & 2033
- Table 41: Global APAC Digital Banking Industry Revenue Million Forecast, by Enterprise 2020 & 2033
- Table 42: Global APAC Digital Banking Industry Volume Billion Forecast, by Enterprise 2020 & 2033
- Table 43: Global APAC Digital Banking Industry Revenue Million Forecast, by Country 2020 & 2033
- Table 44: Global APAC Digital Banking Industry Volume Billion Forecast, by Country 2020 & 2033
- Table 45: United Kingdom APAC Digital Banking Industry Revenue (Million) Forecast, by Application 2020 & 2033
- Table 46: United Kingdom APAC Digital Banking Industry Volume (Billion) Forecast, by Application 2020 & 2033
- Table 47: Germany APAC Digital Banking Industry Revenue (Million) Forecast, by Application 2020 & 2033
- Table 48: Germany APAC Digital Banking Industry Volume (Billion) Forecast, by Application 2020 & 2033
- Table 49: France APAC Digital Banking Industry Revenue (Million) Forecast, by Application 2020 & 2033
- Table 50: France APAC Digital Banking Industry Volume (Billion) Forecast, by Application 2020 & 2033
- Table 51: Italy APAC Digital Banking Industry Revenue (Million) Forecast, by Application 2020 & 2033
- Table 52: Italy APAC Digital Banking Industry Volume (Billion) Forecast, by Application 2020 & 2033
- Table 53: Spain APAC Digital Banking Industry Revenue (Million) Forecast, by Application 2020 & 2033
- Table 54: Spain APAC Digital Banking Industry Volume (Billion) Forecast, by Application 2020 & 2033
- Table 55: Russia APAC Digital Banking Industry Revenue (Million) Forecast, by Application 2020 & 2033
- Table 56: Russia APAC Digital Banking Industry Volume (Billion) Forecast, by Application 2020 & 2033
- Table 57: Benelux APAC Digital Banking Industry Revenue (Million) Forecast, by Application 2020 & 2033
- Table 58: Benelux APAC Digital Banking Industry Volume (Billion) Forecast, by Application 2020 & 2033
- Table 59: Nordics APAC Digital Banking Industry Revenue (Million) Forecast, by Application 2020 & 2033
- Table 60: Nordics APAC Digital Banking Industry Volume (Billion) Forecast, by Application 2020 & 2033
- Table 61: Rest of Europe APAC Digital Banking Industry Revenue (Million) Forecast, by Application 2020 & 2033
- Table 62: Rest of Europe APAC Digital Banking Industry Volume (Billion) Forecast, by Application 2020 & 2033
- Table 63: Global APAC Digital Banking Industry Revenue Million Forecast, by Type 2020 & 2033
- Table 64: Global APAC Digital Banking Industry Volume Billion Forecast, by Type 2020 & 2033
- Table 65: Global APAC Digital Banking Industry Revenue Million Forecast, by Service Type 2020 & 2033
- Table 66: Global APAC Digital Banking Industry Volume Billion Forecast, by Service Type 2020 & 2033
- Table 67: Global APAC Digital Banking Industry Revenue Million Forecast, by Enterprise 2020 & 2033
- Table 68: Global APAC Digital Banking Industry Volume Billion Forecast, by Enterprise 2020 & 2033
- Table 69: Global APAC Digital Banking Industry Revenue Million Forecast, by Country 2020 & 2033
- Table 70: Global APAC Digital Banking Industry Volume Billion Forecast, by Country 2020 & 2033
- Table 71: Turkey APAC Digital Banking Industry Revenue (Million) Forecast, by Application 2020 & 2033
- Table 72: Turkey APAC Digital Banking Industry Volume (Billion) Forecast, by Application 2020 & 2033
- Table 73: Israel APAC Digital Banking Industry Revenue (Million) Forecast, by Application 2020 & 2033
- Table 74: Israel APAC Digital Banking Industry Volume (Billion) Forecast, by Application 2020 & 2033
- Table 75: GCC APAC Digital Banking Industry Revenue (Million) Forecast, by Application 2020 & 2033
- Table 76: GCC APAC Digital Banking Industry Volume (Billion) Forecast, by Application 2020 & 2033
- Table 77: North Africa APAC Digital Banking Industry Revenue (Million) Forecast, by Application 2020 & 2033
- Table 78: North Africa APAC Digital Banking Industry Volume (Billion) Forecast, by Application 2020 & 2033
- Table 79: South Africa APAC Digital Banking Industry Revenue (Million) Forecast, by Application 2020 & 2033
- Table 80: South Africa APAC Digital Banking Industry Volume (Billion) Forecast, by Application 2020 & 2033
- Table 81: Rest of Middle East & Africa APAC Digital Banking Industry Revenue (Million) Forecast, by Application 2020 & 2033
- Table 82: Rest of Middle East & Africa APAC Digital Banking Industry Volume (Billion) Forecast, by Application 2020 & 2033
- Table 83: Global APAC Digital Banking Industry Revenue Million Forecast, by Type 2020 & 2033
- Table 84: Global APAC Digital Banking Industry Volume Billion Forecast, by Type 2020 & 2033
- Table 85: Global APAC Digital Banking Industry Revenue Million Forecast, by Service Type 2020 & 2033
- Table 86: Global APAC Digital Banking Industry Volume Billion Forecast, by Service Type 2020 & 2033
- Table 87: Global APAC Digital Banking Industry Revenue Million Forecast, by Enterprise 2020 & 2033
- Table 88: Global APAC Digital Banking Industry Volume Billion Forecast, by Enterprise 2020 & 2033
- Table 89: Global APAC Digital Banking Industry Revenue Million Forecast, by Country 2020 & 2033
- Table 90: Global APAC Digital Banking Industry Volume Billion Forecast, by Country 2020 & 2033
- Table 91: China APAC Digital Banking Industry Revenue (Million) Forecast, by Application 2020 & 2033
- Table 92: China APAC Digital Banking Industry Volume (Billion) Forecast, by Application 2020 & 2033
- Table 93: India APAC Digital Banking Industry Revenue (Million) Forecast, by Application 2020 & 2033
- Table 94: India APAC Digital Banking Industry Volume (Billion) Forecast, by Application 2020 & 2033
- Table 95: Japan APAC Digital Banking Industry Revenue (Million) Forecast, by Application 2020 & 2033
- Table 96: Japan APAC Digital Banking Industry Volume (Billion) Forecast, by Application 2020 & 2033
- Table 97: South Korea APAC Digital Banking Industry Revenue (Million) Forecast, by Application 2020 & 2033
- Table 98: South Korea APAC Digital Banking Industry Volume (Billion) Forecast, by Application 2020 & 2033
- Table 99: ASEAN APAC Digital Banking Industry Revenue (Million) Forecast, by Application 2020 & 2033
- Table 100: ASEAN APAC Digital Banking Industry Volume (Billion) Forecast, by Application 2020 & 2033
- Table 101: Oceania APAC Digital Banking Industry Revenue (Million) Forecast, by Application 2020 & 2033
- Table 102: Oceania APAC Digital Banking Industry Volume (Billion) Forecast, by Application 2020 & 2033
- Table 103: Rest of Asia Pacific APAC Digital Banking Industry Revenue (Million) Forecast, by Application 2020 & 2033
- Table 104: Rest of Asia Pacific APAC Digital Banking Industry Volume (Billion) Forecast, by Application 2020 & 2033
Frequently Asked Questions
1. What is the projected Compound Annual Growth Rate (CAGR) of the APAC Digital Banking Industry?
The projected CAGR is approximately 9.80%.
2. Which companies are prominent players in the APAC Digital Banking Industry?
Key companies in the market include ZestMoney, MoneyTap, Paytm, OneConnect, Jiedaibao, Money Forward, Kyash, Moneycatcha, Policybazaar, Razorpay**List Not Exhaustive.
3. What are the main segments of the APAC Digital Banking Industry?
The market segments include Type, Service Type, Enterprise.
4. Can you provide details about the market size?
The market size is estimated to be USD 144.94 Million as of 2022.
5. What are some drivers contributing to market growth?
Rise in Digital Banking in The Region; Rise in Volume of Financial Transaction.
6. What are the notable trends driving market growth?
Increase In Digital Banking.
7. Are there any restraints impacting market growth?
Rise in Digital Banking in The Region; Rise in Volume of Financial Transaction.
8. Can you provide examples of recent developments in the market?
In January 2023, Yes Banks partnered with Banking-as-a-service (BaaS) start-up, Falcon to expand its market in the rapidly growing embedded finance market. The inclusion of BaaS will help Yes Bank to rationalize technology costs and significantly reduce time-to-market empowering the bank to launch its competitive offerings more frequently.
9. What pricing options are available for accessing the report?
Pricing options include single-user, multi-user, and enterprise licenses priced at USD 4750, USD 4950, and USD 6800 respectively.
10. Is the market size provided in terms of value or volume?
The market size is provided in terms of value, measured in Million and volume, measured in Billion.
11. Are there any specific market keywords associated with the report?
Yes, the market keyword associated with the report is "APAC Digital Banking Industry," which aids in identifying and referencing the specific market segment covered.
12. How do I determine which pricing option suits my needs best?
The pricing options vary based on user requirements and access needs. Individual users may opt for single-user licenses, while businesses requiring broader access may choose multi-user or enterprise licenses for cost-effective access to the report.
13. Are there any additional resources or data provided in the APAC Digital Banking Industry report?
While the report offers comprehensive insights, it's advisable to review the specific contents or supplementary materials provided to ascertain if additional resources or data are available.
14. How can I stay updated on further developments or reports in the APAC Digital Banking Industry?
To stay informed about further developments, trends, and reports in the APAC Digital Banking Industry, consider subscribing to industry newsletters, following relevant companies and organizations, or regularly checking reputable industry news sources and publications.
Methodology
Step 1 - Identification of Relevant Samples Size from Population Database


Step 2 - Approaches for Defining Global Market Size (Value, Volume* & Price*)

Note*: In applicable scenarios
Step 3 - Data Sources
Primary Research
- Web Analytics
- Survey Reports
- Research Institute
- Latest Research Reports
- Opinion Leaders
Secondary Research
- Annual Reports
- White Paper
- Latest Press Release
- Industry Association
- Paid Database
- Investor Presentations

Step 4 - Data Triangulation
Involves using different sources of information in order to increase the validity of a study
These sources are likely to be stakeholders in a program - participants, other researchers, program staff, other community members, and so on.
Then we put all data in single framework & apply various statistical tools to find out the dynamic on the market.
During the analysis stage, feedback from the stakeholder groups would be compared to determine areas of agreement as well as areas of divergence