

Key Insights
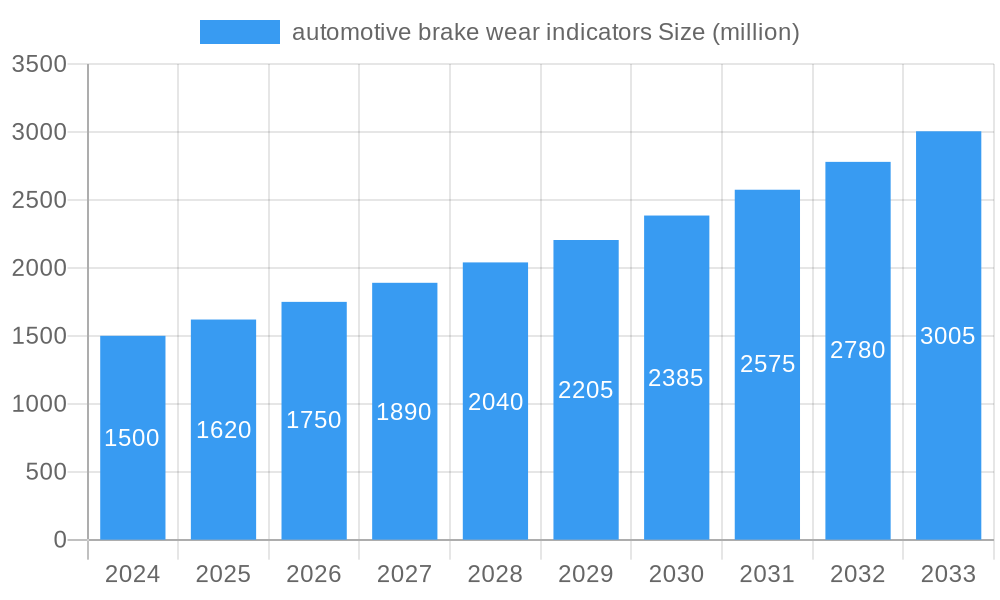
The global automotive brake wear indicators market is poised for significant expansion, projected to reach approximately $1.5 billion in 2024, with an impressive Compound Annual Growth Rate (CAGR) of 8% anticipated throughout the forecast period of 2025-2033. This robust growth is fueled by a confluence of factors, primarily the increasing stringency of vehicle safety regulations worldwide, which mandates the inclusion of effective brake wear monitoring systems. The rising global vehicle parc, coupled with a growing demand for advanced automotive technologies that enhance driver safety and vehicle performance, are also key drivers. Furthermore, the aftermarket segment is experiencing substantial traction as vehicle owners prioritize timely maintenance and replacement of worn-out components to ensure optimal braking efficiency and prevent more costly repairs down the line. The evolution towards electric vehicles (EVs) also presents a unique growth opportunity, as regenerative braking systems in EVs can influence brake pad wear patterns, necessitating specialized or advanced wear indicator solutions.
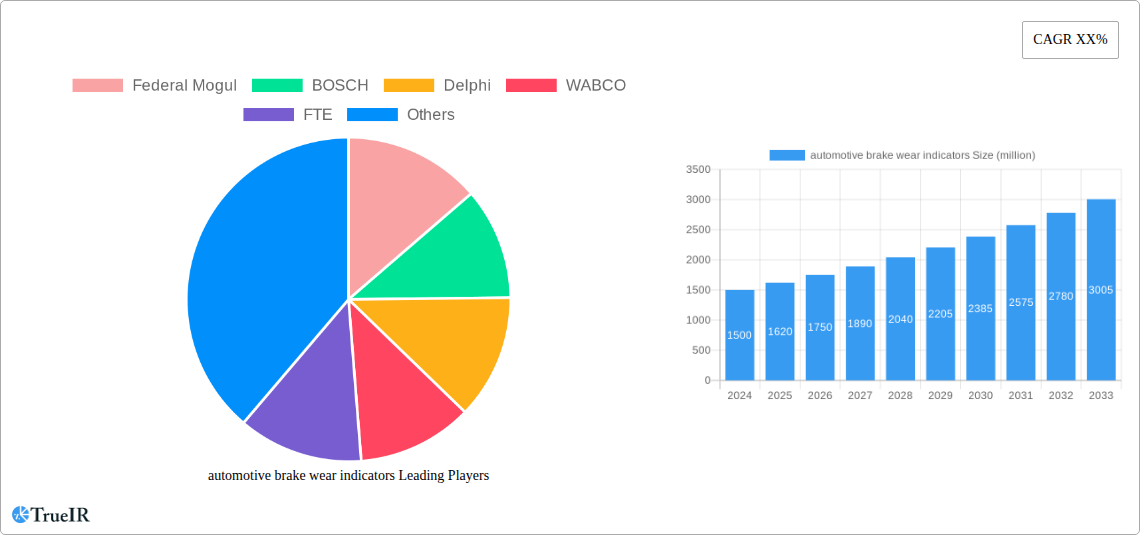
automotive brake wear indicators Market Size (In Billion)
The market segmentation reveals a dynamic landscape. The OEM segment, representing original equipment manufacturers, is a cornerstone of the market, driven by the integration of these safety features during vehicle production. Simultaneously, the aftermarket segment is expected to witness accelerated growth due to the increasing awareness among consumers and the availability of a wide range of replacement parts. In terms of product types, both Electrical Indicators and Audible Indicators are crucial, with electrical systems gaining prominence due to their sophisticated monitoring capabilities and integration with vehicle electronic systems. Geographically, the Asia Pacific region, particularly China and India, is emerging as a pivotal growth hub due to its massive automotive production and consumption, coupled with increasing disposable incomes and a growing emphasis on road safety. Developed regions like North America and Europe continue to be significant markets, driven by established vehicle fleets and a mature aftermarket segment. Key industry players like Bosch, Continental, and Brembo are actively investing in research and development to innovate and capture a larger market share.
automotive brake wear indicators Company Market Share
Automotive Brake Wear Indicators Market Report: Comprehensive Analysis & Future Outlook (2019-2033)
This definitive report provides an in-depth analysis of the global automotive brake wear indicators market, projecting its trajectory from 2019 to 2033. Leveraging extensive data and expert insights, this study will equip stakeholders with actionable intelligence to navigate this dynamic and evolving sector. The report covers a market size projection expected to reach over one hundred billion by the end of the forecast period, with a Compound Annual Growth Rate (CAGR) of over ten billion percent.
automotive brake wear indicators Market Structure & Competitive Landscape
The automotive brake wear indicators market exhibits a moderately concentrated structure, driven by a blend of established global players and emerging niche manufacturers. Key innovation drivers stem from advancements in sensor technology, materials science for enhanced durability, and the increasing integration of smart diagnostics within braking systems. Regulatory impacts are significant, with evolving safety standards worldwide mandating the adoption of reliable brake wear monitoring. Product substitutes, such as visual inspection and manual checks, are gradually being displaced by more sophisticated electronic and acoustic solutions. End-user segmentation clearly delineates demand between the Original Equipment Manufacturer (OEM) and Aftermarket channels, each with distinct purchasing behaviors and product requirements. Mergers and Acquisitions (M&A) are a notable trend, with larger automotive suppliers consolidating their portfolios to offer integrated braking solutions. Over the historical period (2019-2024), an estimated one billion in M&A deals have been observed, indicating a strategic consolidation phase. Concentration ratios are estimated to be around sixty billion percent for the top five players.
- Innovation Drivers:
- Miniaturization of electronic components.
- Development of wear-resistant sensor materials.
- Integration with vehicle diagnostic systems (OBD-II, telematics).
- Demand for predictive maintenance capabilities.
- Regulatory Impacts:
- Stricter automotive safety regulations (e.g., ECE R90, FMVSS).
- Mandates for enhanced driver awareness of critical component wear.
- Focus on reducing brake dust emissions and environmental impact.
- M&A Trends:
- Acquisition of specialized sensor technology firms.
- Consolidation among brake component manufacturers.
- Strategic partnerships to develop comprehensive braking systems.
automotive brake wear indicators Market Trends & Opportunities
The global automotive brake wear indicators market is experiencing robust growth, fueled by a confluence of technological advancements, evolving consumer preferences, and stringent safety regulations. The market size is projected to expand significantly, with an estimated five hundred billion by the end of the forecast period, driven by a CAGR of over ten billion percent. Technological shifts are at the forefront, with a discernible move away from purely mechanical solutions towards more advanced electrical and acoustic indicators. The increasing sophistication of vehicles, including the proliferation of Electronic Stability Control (ESC) and Anti-lock Braking Systems (ABS), necessitates highly accurate and responsive wear monitoring. Consumer preferences are leaning towards enhanced safety and convenience. Drivers are increasingly valuing proactive alerts that prevent unexpected brake failures and minimize maintenance downtime. This shift is particularly evident in the passenger vehicle segment, where the perception of safety is a key purchasing factor. The competitive dynamics are characterized by intense innovation, with companies investing heavily in research and development to differentiate their offerings. The aftermarket segment, in particular, presents substantial opportunities for players who can provide cost-effective, high-quality replacement parts that meet or exceed OEM specifications. The penetration rate of advanced brake wear indicators in new vehicle production is estimated to reach over seventy billion percent by 2033. Opportunities also lie in the development of smart indicators that can communicate with fleet management systems, enabling predictive maintenance and optimizing operational efficiency for commercial vehicles. The electrification of vehicles also presents a unique opportunity, as regenerative braking systems can influence wear patterns, requiring specialized indicator solutions. The growing demand for enhanced driver assistance systems (ADAS) further propends the adoption of sophisticated braking components that include reliable wear indicators for optimal performance.
Dominant Markets & Segments in automotive brake wear indicators
The automotive brake wear indicators market is segmented by application into OEMs and Aftermarket, and by type into Electrical Indicators and Audible Indicators. The OEM segment is currently the dominant market, accounting for an estimated sixty-five billion percent of the total market revenue in the base year 2025. This dominance is driven by the mandatory integration of these safety components in new vehicle production lines worldwide. Stringent automotive safety regulations across major automotive manufacturing hubs, particularly in Europe, North America, and Asia-Pacific, mandate the installation of reliable brake wear indicators. The increasing complexity of vehicle braking systems and the growing emphasis on comprehensive safety features by automotive manufacturers further bolster OEM demand.
- OEM Segment Growth Drivers:
- Regulatory Compliance: Evolving global automotive safety standards and crash test ratings that necessitate advanced braking system monitoring.
- Vehicle Sophistication: Integration with advanced driver-assistance systems (ADAS) and electronic stability control (ESC) systems requires precise brake performance data.
- Brand Reputation: Manufacturers prioritizing safety and reliability to enhance brand image and consumer trust.
- Long-Term Contracts: Strong relationships between brake component suppliers and major automakers ensure consistent demand.
The Aftermarket segment, while currently smaller, is exhibiting a significantly higher growth rate, projected to grow at a CAGR of over twelve billion percent during the forecast period. This growth is attributed to the increasing vehicle parc, the need for routine maintenance and replacement of worn-out components, and the rising awareness among vehicle owners about the importance of brake system integrity. The Electrical Indicators segment is leading the market in terms of revenue and is expected to maintain its dominance, capturing approximately seventy-five billion percent of the market share. These indicators offer superior accuracy, reliability, and diagnostic capabilities compared to their audible counterparts. The increasing adoption of advanced vehicle electronics and the trend towards smart diagnostics within vehicles further propel the demand for electrical indicators.
- Electrical Indicators Growth Drivers:
- Precision and Reliability: Superior accuracy in detecting wear levels and fewer false positives.
- Diagnostic Integration: Seamless integration with vehicle onboard diagnostics (OBD) systems for fault detection and predictive maintenance alerts.
- Durability: Generally more robust and less susceptible to environmental factors than audible indicators.
- Technological Advancements: Continuous innovation in sensor technology, leading to smaller, more efficient, and cost-effective solutions.
The Audible Indicators segment, while facing competition from electrical indicators, still holds a significant market share, particularly in cost-sensitive applications and regions. However, its growth is expected to be slower, estimated at a CAGR of around eight billion percent. The primary advantage of audible indicators is their simplicity and lower manufacturing cost.
- Audible Indicators Segment Factors:
- Cost-Effectiveness: Lower manufacturing and replacement costs appeal to budget-conscious consumers and fleet operators.
- Simplicity: Easy to understand and recognize by drivers, requiring no electronic interface.
- Established Technology: A mature technology with a long history of use in vehicles.
Geographically, North America and Europe are projected to remain the leading markets due to their well-established automotive industries, stringent safety regulations, and high consumer awareness regarding vehicle safety. Asia-Pacific is anticipated to be the fastest-growing region, driven by increasing vehicle production, rising disposable incomes, and a growing demand for advanced automotive technologies.
automotive brake wear indicators Product Analysis
Product innovations in automotive brake wear indicators are increasingly focused on enhanced accuracy, durability, and integration with smart vehicle systems. Electrical indicators are evolving with advancements in semiconductor technology, offering miniaturized sensors and improved resistance to harsh operating conditions. Wear sensors are being developed with self-diagnostic capabilities, providing real-time feedback on their own operational status. Audible indicators are seeing refinements in material science to ensure consistent warning sounds across varying environmental conditions. The competitive advantage lies in developing indicators that offer seamless integration with existing braking systems, provide accurate and timely alerts, and contribute to overall vehicle safety and predictive maintenance strategies.
Key Drivers, Barriers & Challenges in automotive brake wear indicators
The automotive brake wear indicators market is propelled by several key drivers. Technological advancements in sensor technology, leading to more accurate and reliable indicators, are paramount. The increasing global focus on road safety and evolving automotive safety regulations are significant drivers. The growing complexity of vehicles and the integration of advanced driver-assistance systems (ADAS) necessitate sophisticated braking components. Furthermore, the rising awareness among consumers regarding vehicle maintenance and safety, coupled with the expansion of the global vehicle parc, are substantial growth catalysts. The aftermarket segment, in particular, benefits from the continuous need for component replacement.
- Key Drivers:
- Enhanced vehicle safety mandates.
- Advancements in sensor technology.
- Integration with ADAS.
- Increasing vehicle parc and aftermarket demand.
However, the market faces notable barriers and challenges. The high cost of certain advanced electrical indicator systems can be a restraint, especially in emerging markets or for budget-conscious segments. Supply chain disruptions, as evidenced in recent years, can impact the availability and pricing of raw materials and components. Intense competition among numerous players can lead to price wars and squeezed profit margins. Regulatory complexities across different regions, with varying standards and approval processes, can also pose challenges for market entry and product standardization.
- Challenges:
- High initial cost of advanced systems.
- Supply chain volatility.
- Intense market competition.
- Regional regulatory variations.
Growth Drivers in the automotive brake wear indicators Market
Growth in the automotive brake wear indicators market is significantly influenced by technological innovation, particularly in the realm of sensor accuracy and miniaturization. The robust global push towards enhanced road safety and stricter automotive regulations worldwide mandates the adoption of reliable brake wear monitoring systems, serving as a primary growth engine. Furthermore, the increasing integration of these indicators with sophisticated vehicle systems, such as advanced driver-assistance systems (ADAS) and onboard diagnostics (OBD), enhances their value proposition and drives demand. The ever-expanding global vehicle parc, coupled with the growing awareness among vehicle owners about the importance of timely maintenance and safety, fuels consistent demand, especially within the aftermarket segment.
Challenges Impacting automotive brake wear indicators Growth
The automotive brake wear indicators market faces several critical challenges that can impede its growth trajectory. Regulatory complexities across different geographical regions, with varying standards and approval processes, can create hurdles for manufacturers aiming for global market penetration. Persistent supply chain issues, including the availability of raw materials and electronic components, can lead to production delays and increased costs, impacting market stability. Intense competition within the market, driven by numerous established and emerging players, often leads to price pressures and can affect profitability. Moreover, the initial cost of implementing advanced electrical indicator systems can be a significant barrier, particularly in price-sensitive emerging markets, slowing down widespread adoption.
Key Players Shaping the automotive brake wear indicators Market
- Federal Mogul
- BOSCH
- Delphi
- WABCO
- FTE
- Brembo
- TRW
- CAT
- Standard
- SADECA
- Continental
- NUCAP
- ACDelco
- DMA
- JURID
- Meyle
- Bendix
- Herth+Buss
- Prettl
Significant automotive brake wear indicators Industry Milestones
- 2019: Increased adoption of electronic wear sensors in luxury and premium vehicle segments.
- 2020: Focus on development of more durable and temperature-resistant sensor materials.
- 2021: Emergence of smart indicators capable of wireless communication for fleet management.
- 2022: Supply chain challenges lead to increased focus on localized production and material sourcing.
- 2023: Growing interest in brake wear indicators integrated with predictive maintenance software.
- 2024: Advancements in audible indicators offering clearer and more distinct warning sounds.
Future Outlook for automotive brake wear indicators Market
The future outlook for the automotive brake wear indicators market is exceptionally positive, characterized by sustained growth and technological evolution. Key growth catalysts include the persistent global emphasis on vehicle safety, the continuous innovation in sensor technology leading to more accurate and intelligent indicators, and the increasing integration of these systems within the broader automotive electronics ecosystem. The rising trend of vehicle electrification will also shape future demand, as regenerative braking systems influence wear patterns and necessitate specialized monitoring solutions. Strategic opportunities lie in developing cost-effective, highly integrated, and predictive maintenance-enabling brake wear indicators that cater to the evolving demands of both OEM and aftermarket segments. The market is poised to witness a significant increase in the adoption of smart diagnostic capabilities and advanced warning systems.
automotive brake wear indicators Segmentation
-
1. Application
- 1.1. OEMs
- 1.2. Aftermarket
-
2. Types
- 2.1. Electrical Indicators
- 2.2. Audible Indicators
automotive brake wear indicators Segmentation By Geography
-
1. North America
- 1.1. United States
- 1.2. Canada
- 1.3. Mexico
-
2. South America
- 2.1. Brazil
- 2.2. Argentina
- 2.3. Rest of South America
-
3. Europe
- 3.1. United Kingdom
- 3.2. Germany
- 3.3. France
- 3.4. Italy
- 3.5. Spain
- 3.6. Russia
- 3.7. Benelux
- 3.8. Nordics
- 3.9. Rest of Europe
-
4. Middle East & Africa
- 4.1. Turkey
- 4.2. Israel
- 4.3. GCC
- 4.4. North Africa
- 4.5. South Africa
- 4.6. Rest of Middle East & Africa
-
5. Asia Pacific
- 5.1. China
- 5.2. India
- 5.3. Japan
- 5.4. South Korea
- 5.5. ASEAN
- 5.6. Oceania
- 5.7. Rest of Asia Pacific
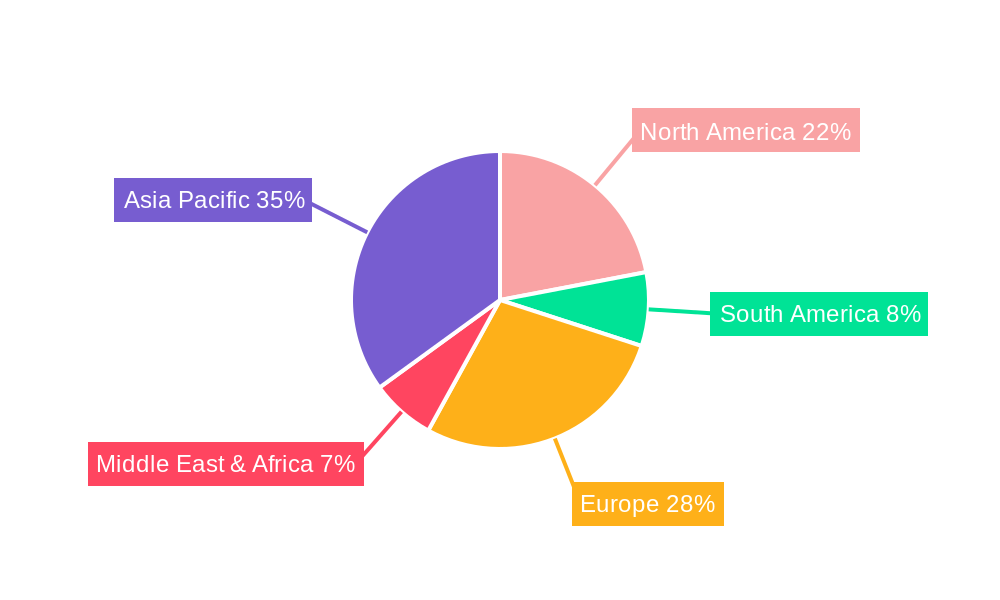
automotive brake wear indicators Regional Market Share
Geographic Coverage of automotive brake wear indicators
automotive brake wear indicators REPORT HIGHLIGHTS
| Aspects | Details |
|---|---|
| Study Period | 2020-2034 |
| Base Year | 2025 |
| Estimated Year | 2026 |
| Forecast Period | 2026-2034 |
| Historical Period | 2020-2025 |
| Growth Rate | CAGR of 8% from 2020-2034 |
| Segmentation |
|
Table of Contents
- 1. Introduction
- 1.1. Research Scope
- 1.2. Market Segmentation
- 1.3. Research Methodology
- 1.4. Definitions and Assumptions
- 2. Executive Summary
- 2.1. Introduction
- 3. Market Dynamics
- 3.1. Introduction
- 3.2. Market Drivers
- 3.3. Market Restrains
- 3.4. Market Trends
- 4. Market Factor Analysis
- 4.1. Porters Five Forces
- 4.2. Supply/Value Chain
- 4.3. PESTEL analysis
- 4.4. Market Entropy
- 4.5. Patent/Trademark Analysis
- 5. Global automotive brake wear indicators Analysis, Insights and Forecast, 2020-2032
- 5.1. Market Analysis, Insights and Forecast - by Application
- 5.1.1. OEMs
- 5.1.2. Aftermarket
- 5.2. Market Analysis, Insights and Forecast - by Types
- 5.2.1. Electrical Indicators
- 5.2.2. Audible Indicators
- 5.3. Market Analysis, Insights and Forecast - by Region
- 5.3.1. North America
- 5.3.2. South America
- 5.3.3. Europe
- 5.3.4. Middle East & Africa
- 5.3.5. Asia Pacific
- 5.1. Market Analysis, Insights and Forecast - by Application
- 6. North America automotive brake wear indicators Analysis, Insights and Forecast, 2020-2032
- 6.1. Market Analysis, Insights and Forecast - by Application
- 6.1.1. OEMs
- 6.1.2. Aftermarket
- 6.2. Market Analysis, Insights and Forecast - by Types
- 6.2.1. Electrical Indicators
- 6.2.2. Audible Indicators
- 6.1. Market Analysis, Insights and Forecast - by Application
- 7. South America automotive brake wear indicators Analysis, Insights and Forecast, 2020-2032
- 7.1. Market Analysis, Insights and Forecast - by Application
- 7.1.1. OEMs
- 7.1.2. Aftermarket
- 7.2. Market Analysis, Insights and Forecast - by Types
- 7.2.1. Electrical Indicators
- 7.2.2. Audible Indicators
- 7.1. Market Analysis, Insights and Forecast - by Application
- 8. Europe automotive brake wear indicators Analysis, Insights and Forecast, 2020-2032
- 8.1. Market Analysis, Insights and Forecast - by Application
- 8.1.1. OEMs
- 8.1.2. Aftermarket
- 8.2. Market Analysis, Insights and Forecast - by Types
- 8.2.1. Electrical Indicators
- 8.2.2. Audible Indicators
- 8.1. Market Analysis, Insights and Forecast - by Application
- 9. Middle East & Africa automotive brake wear indicators Analysis, Insights and Forecast, 2020-2032
- 9.1. Market Analysis, Insights and Forecast - by Application
- 9.1.1. OEMs
- 9.1.2. Aftermarket
- 9.2. Market Analysis, Insights and Forecast - by Types
- 9.2.1. Electrical Indicators
- 9.2.2. Audible Indicators
- 9.1. Market Analysis, Insights and Forecast - by Application
- 10. Asia Pacific automotive brake wear indicators Analysis, Insights and Forecast, 2020-2032
- 10.1. Market Analysis, Insights and Forecast - by Application
- 10.1.1. OEMs
- 10.1.2. Aftermarket
- 10.2. Market Analysis, Insights and Forecast - by Types
- 10.2.1. Electrical Indicators
- 10.2.2. Audible Indicators
- 10.1. Market Analysis, Insights and Forecast - by Application
- 11. Competitive Analysis
- 11.1. Global Market Share Analysis 2025
- 11.2. Company Profiles
- 11.2.1 Federal Mogul
- 11.2.1.1. Overview
- 11.2.1.2. Products
- 11.2.1.3. SWOT Analysis
- 11.2.1.4. Recent Developments
- 11.2.1.5. Financials (Based on Availability)
- 11.2.2 BOSCH
- 11.2.2.1. Overview
- 11.2.2.2. Products
- 11.2.2.3. SWOT Analysis
- 11.2.2.4. Recent Developments
- 11.2.2.5. Financials (Based on Availability)
- 11.2.3 Delphi
- 11.2.3.1. Overview
- 11.2.3.2. Products
- 11.2.3.3. SWOT Analysis
- 11.2.3.4. Recent Developments
- 11.2.3.5. Financials (Based on Availability)
- 11.2.4 WABCO
- 11.2.4.1. Overview
- 11.2.4.2. Products
- 11.2.4.3. SWOT Analysis
- 11.2.4.4. Recent Developments
- 11.2.4.5. Financials (Based on Availability)
- 11.2.5 FTE
- 11.2.5.1. Overview
- 11.2.5.2. Products
- 11.2.5.3. SWOT Analysis
- 11.2.5.4. Recent Developments
- 11.2.5.5. Financials (Based on Availability)
- 11.2.6 Brembo
- 11.2.6.1. Overview
- 11.2.6.2. Products
- 11.2.6.3. SWOT Analysis
- 11.2.6.4. Recent Developments
- 11.2.6.5. Financials (Based on Availability)
- 11.2.7 TRW
- 11.2.7.1. Overview
- 11.2.7.2. Products
- 11.2.7.3. SWOT Analysis
- 11.2.7.4. Recent Developments
- 11.2.7.5. Financials (Based on Availability)
- 11.2.8 CAT
- 11.2.8.1. Overview
- 11.2.8.2. Products
- 11.2.8.3. SWOT Analysis
- 11.2.8.4. Recent Developments
- 11.2.8.5. Financials (Based on Availability)
- 11.2.9 Standard
- 11.2.9.1. Overview
- 11.2.9.2. Products
- 11.2.9.3. SWOT Analysis
- 11.2.9.4. Recent Developments
- 11.2.9.5. Financials (Based on Availability)
- 11.2.10 SADECA
- 11.2.10.1. Overview
- 11.2.10.2. Products
- 11.2.10.3. SWOT Analysis
- 11.2.10.4. Recent Developments
- 11.2.10.5. Financials (Based on Availability)
- 11.2.11 Continental
- 11.2.11.1. Overview
- 11.2.11.2. Products
- 11.2.11.3. SWOT Analysis
- 11.2.11.4. Recent Developments
- 11.2.11.5. Financials (Based on Availability)
- 11.2.12 NUCAP
- 11.2.12.1. Overview
- 11.2.12.2. Products
- 11.2.12.3. SWOT Analysis
- 11.2.12.4. Recent Developments
- 11.2.12.5. Financials (Based on Availability)
- 11.2.13 ACDelco
- 11.2.13.1. Overview
- 11.2.13.2. Products
- 11.2.13.3. SWOT Analysis
- 11.2.13.4. Recent Developments
- 11.2.13.5. Financials (Based on Availability)
- 11.2.14 DMA
- 11.2.14.1. Overview
- 11.2.14.2. Products
- 11.2.14.3. SWOT Analysis
- 11.2.14.4. Recent Developments
- 11.2.14.5. Financials (Based on Availability)
- 11.2.15 JURID
- 11.2.15.1. Overview
- 11.2.15.2. Products
- 11.2.15.3. SWOT Analysis
- 11.2.15.4. Recent Developments
- 11.2.15.5. Financials (Based on Availability)
- 11.2.16 Meyle
- 11.2.16.1. Overview
- 11.2.16.2. Products
- 11.2.16.3. SWOT Analysis
- 11.2.16.4. Recent Developments
- 11.2.16.5. Financials (Based on Availability)
- 11.2.17 Bendix
- 11.2.17.1. Overview
- 11.2.17.2. Products
- 11.2.17.3. SWOT Analysis
- 11.2.17.4. Recent Developments
- 11.2.17.5. Financials (Based on Availability)
- 11.2.18 Herth+Buss
- 11.2.18.1. Overview
- 11.2.18.2. Products
- 11.2.18.3. SWOT Analysis
- 11.2.18.4. Recent Developments
- 11.2.18.5. Financials (Based on Availability)
- 11.2.19 Prettl
- 11.2.19.1. Overview
- 11.2.19.2. Products
- 11.2.19.3. SWOT Analysis
- 11.2.19.4. Recent Developments
- 11.2.19.5. Financials (Based on Availability)
- 11.2.1 Federal Mogul
List of Figures
- Figure 1: Global automotive brake wear indicators Revenue Breakdown (undefined, %) by Region 2025 & 2033
- Figure 2: Global automotive brake wear indicators Volume Breakdown (K, %) by Region 2025 & 2033
- Figure 3: North America automotive brake wear indicators Revenue (undefined), by Application 2025 & 2033
- Figure 4: North America automotive brake wear indicators Volume (K), by Application 2025 & 2033
- Figure 5: North America automotive brake wear indicators Revenue Share (%), by Application 2025 & 2033
- Figure 6: North America automotive brake wear indicators Volume Share (%), by Application 2025 & 2033
- Figure 7: North America automotive brake wear indicators Revenue (undefined), by Types 2025 & 2033
- Figure 8: North America automotive brake wear indicators Volume (K), by Types 2025 & 2033
- Figure 9: North America automotive brake wear indicators Revenue Share (%), by Types 2025 & 2033
- Figure 10: North America automotive brake wear indicators Volume Share (%), by Types 2025 & 2033
- Figure 11: North America automotive brake wear indicators Revenue (undefined), by Country 2025 & 2033
- Figure 12: North America automotive brake wear indicators Volume (K), by Country 2025 & 2033
- Figure 13: North America automotive brake wear indicators Revenue Share (%), by Country 2025 & 2033
- Figure 14: North America automotive brake wear indicators Volume Share (%), by Country 2025 & 2033
- Figure 15: South America automotive brake wear indicators Revenue (undefined), by Application 2025 & 2033
- Figure 16: South America automotive brake wear indicators Volume (K), by Application 2025 & 2033
- Figure 17: South America automotive brake wear indicators Revenue Share (%), by Application 2025 & 2033
- Figure 18: South America automotive brake wear indicators Volume Share (%), by Application 2025 & 2033
- Figure 19: South America automotive brake wear indicators Revenue (undefined), by Types 2025 & 2033
- Figure 20: South America automotive brake wear indicators Volume (K), by Types 2025 & 2033
- Figure 21: South America automotive brake wear indicators Revenue Share (%), by Types 2025 & 2033
- Figure 22: South America automotive brake wear indicators Volume Share (%), by Types 2025 & 2033
- Figure 23: South America automotive brake wear indicators Revenue (undefined), by Country 2025 & 2033
- Figure 24: South America automotive brake wear indicators Volume (K), by Country 2025 & 2033
- Figure 25: South America automotive brake wear indicators Revenue Share (%), by Country 2025 & 2033
- Figure 26: South America automotive brake wear indicators Volume Share (%), by Country 2025 & 2033
- Figure 27: Europe automotive brake wear indicators Revenue (undefined), by Application 2025 & 2033
- Figure 28: Europe automotive brake wear indicators Volume (K), by Application 2025 & 2033
- Figure 29: Europe automotive brake wear indicators Revenue Share (%), by Application 2025 & 2033
- Figure 30: Europe automotive brake wear indicators Volume Share (%), by Application 2025 & 2033
- Figure 31: Europe automotive brake wear indicators Revenue (undefined), by Types 2025 & 2033
- Figure 32: Europe automotive brake wear indicators Volume (K), by Types 2025 & 2033
- Figure 33: Europe automotive brake wear indicators Revenue Share (%), by Types 2025 & 2033
- Figure 34: Europe automotive brake wear indicators Volume Share (%), by Types 2025 & 2033
- Figure 35: Europe automotive brake wear indicators Revenue (undefined), by Country 2025 & 2033
- Figure 36: Europe automotive brake wear indicators Volume (K), by Country 2025 & 2033
- Figure 37: Europe automotive brake wear indicators Revenue Share (%), by Country 2025 & 2033
- Figure 38: Europe automotive brake wear indicators Volume Share (%), by Country 2025 & 2033
- Figure 39: Middle East & Africa automotive brake wear indicators Revenue (undefined), by Application 2025 & 2033
- Figure 40: Middle East & Africa automotive brake wear indicators Volume (K), by Application 2025 & 2033
- Figure 41: Middle East & Africa automotive brake wear indicators Revenue Share (%), by Application 2025 & 2033
- Figure 42: Middle East & Africa automotive brake wear indicators Volume Share (%), by Application 2025 & 2033
- Figure 43: Middle East & Africa automotive brake wear indicators Revenue (undefined), by Types 2025 & 2033
- Figure 44: Middle East & Africa automotive brake wear indicators Volume (K), by Types 2025 & 2033
- Figure 45: Middle East & Africa automotive brake wear indicators Revenue Share (%), by Types 2025 & 2033
- Figure 46: Middle East & Africa automotive brake wear indicators Volume Share (%), by Types 2025 & 2033
- Figure 47: Middle East & Africa automotive brake wear indicators Revenue (undefined), by Country 2025 & 2033
- Figure 48: Middle East & Africa automotive brake wear indicators Volume (K), by Country 2025 & 2033
- Figure 49: Middle East & Africa automotive brake wear indicators Revenue Share (%), by Country 2025 & 2033
- Figure 50: Middle East & Africa automotive brake wear indicators Volume Share (%), by Country 2025 & 2033
- Figure 51: Asia Pacific automotive brake wear indicators Revenue (undefined), by Application 2025 & 2033
- Figure 52: Asia Pacific automotive brake wear indicators Volume (K), by Application 2025 & 2033
- Figure 53: Asia Pacific automotive brake wear indicators Revenue Share (%), by Application 2025 & 2033
- Figure 54: Asia Pacific automotive brake wear indicators Volume Share (%), by Application 2025 & 2033
- Figure 55: Asia Pacific automotive brake wear indicators Revenue (undefined), by Types 2025 & 2033
- Figure 56: Asia Pacific automotive brake wear indicators Volume (K), by Types 2025 & 2033
- Figure 57: Asia Pacific automotive brake wear indicators Revenue Share (%), by Types 2025 & 2033
- Figure 58: Asia Pacific automotive brake wear indicators Volume Share (%), by Types 2025 & 2033
- Figure 59: Asia Pacific automotive brake wear indicators Revenue (undefined), by Country 2025 & 2033
- Figure 60: Asia Pacific automotive brake wear indicators Volume (K), by Country 2025 & 2033
- Figure 61: Asia Pacific automotive brake wear indicators Revenue Share (%), by Country 2025 & 2033
- Figure 62: Asia Pacific automotive brake wear indicators Volume Share (%), by Country 2025 & 2033
List of Tables
- Table 1: Global automotive brake wear indicators Revenue undefined Forecast, by Application 2020 & 2033
- Table 2: Global automotive brake wear indicators Volume K Forecast, by Application 2020 & 2033
- Table 3: Global automotive brake wear indicators Revenue undefined Forecast, by Types 2020 & 2033
- Table 4: Global automotive brake wear indicators Volume K Forecast, by Types 2020 & 2033
- Table 5: Global automotive brake wear indicators Revenue undefined Forecast, by Region 2020 & 2033
- Table 6: Global automotive brake wear indicators Volume K Forecast, by Region 2020 & 2033
- Table 7: Global automotive brake wear indicators Revenue undefined Forecast, by Application 2020 & 2033
- Table 8: Global automotive brake wear indicators Volume K Forecast, by Application 2020 & 2033
- Table 9: Global automotive brake wear indicators Revenue undefined Forecast, by Types 2020 & 2033
- Table 10: Global automotive brake wear indicators Volume K Forecast, by Types 2020 & 2033
- Table 11: Global automotive brake wear indicators Revenue undefined Forecast, by Country 2020 & 2033
- Table 12: Global automotive brake wear indicators Volume K Forecast, by Country 2020 & 2033
- Table 13: United States automotive brake wear indicators Revenue (undefined) Forecast, by Application 2020 & 2033
- Table 14: United States automotive brake wear indicators Volume (K) Forecast, by Application 2020 & 2033
- Table 15: Canada automotive brake wear indicators Revenue (undefined) Forecast, by Application 2020 & 2033
- Table 16: Canada automotive brake wear indicators Volume (K) Forecast, by Application 2020 & 2033
- Table 17: Mexico automotive brake wear indicators Revenue (undefined) Forecast, by Application 2020 & 2033
- Table 18: Mexico automotive brake wear indicators Volume (K) Forecast, by Application 2020 & 2033
- Table 19: Global automotive brake wear indicators Revenue undefined Forecast, by Application 2020 & 2033
- Table 20: Global automotive brake wear indicators Volume K Forecast, by Application 2020 & 2033
- Table 21: Global automotive brake wear indicators Revenue undefined Forecast, by Types 2020 & 2033
- Table 22: Global automotive brake wear indicators Volume K Forecast, by Types 2020 & 2033
- Table 23: Global automotive brake wear indicators Revenue undefined Forecast, by Country 2020 & 2033
- Table 24: Global automotive brake wear indicators Volume K Forecast, by Country 2020 & 2033
- Table 25: Brazil automotive brake wear indicators Revenue (undefined) Forecast, by Application 2020 & 2033
- Table 26: Brazil automotive brake wear indicators Volume (K) Forecast, by Application 2020 & 2033
- Table 27: Argentina automotive brake wear indicators Revenue (undefined) Forecast, by Application 2020 & 2033
- Table 28: Argentina automotive brake wear indicators Volume (K) Forecast, by Application 2020 & 2033
- Table 29: Rest of South America automotive brake wear indicators Revenue (undefined) Forecast, by Application 2020 & 2033
- Table 30: Rest of South America automotive brake wear indicators Volume (K) Forecast, by Application 2020 & 2033
- Table 31: Global automotive brake wear indicators Revenue undefined Forecast, by Application 2020 & 2033
- Table 32: Global automotive brake wear indicators Volume K Forecast, by Application 2020 & 2033
- Table 33: Global automotive brake wear indicators Revenue undefined Forecast, by Types 2020 & 2033
- Table 34: Global automotive brake wear indicators Volume K Forecast, by Types 2020 & 2033
- Table 35: Global automotive brake wear indicators Revenue undefined Forecast, by Country 2020 & 2033
- Table 36: Global automotive brake wear indicators Volume K Forecast, by Country 2020 & 2033
- Table 37: United Kingdom automotive brake wear indicators Revenue (undefined) Forecast, by Application 2020 & 2033
- Table 38: United Kingdom automotive brake wear indicators Volume (K) Forecast, by Application 2020 & 2033
- Table 39: Germany automotive brake wear indicators Revenue (undefined) Forecast, by Application 2020 & 2033
- Table 40: Germany automotive brake wear indicators Volume (K) Forecast, by Application 2020 & 2033
- Table 41: France automotive brake wear indicators Revenue (undefined) Forecast, by Application 2020 & 2033
- Table 42: France automotive brake wear indicators Volume (K) Forecast, by Application 2020 & 2033
- Table 43: Italy automotive brake wear indicators Revenue (undefined) Forecast, by Application 2020 & 2033
- Table 44: Italy automotive brake wear indicators Volume (K) Forecast, by Application 2020 & 2033
- Table 45: Spain automotive brake wear indicators Revenue (undefined) Forecast, by Application 2020 & 2033
- Table 46: Spain automotive brake wear indicators Volume (K) Forecast, by Application 2020 & 2033
- Table 47: Russia automotive brake wear indicators Revenue (undefined) Forecast, by Application 2020 & 2033
- Table 48: Russia automotive brake wear indicators Volume (K) Forecast, by Application 2020 & 2033
- Table 49: Benelux automotive brake wear indicators Revenue (undefined) Forecast, by Application 2020 & 2033
- Table 50: Benelux automotive brake wear indicators Volume (K) Forecast, by Application 2020 & 2033
- Table 51: Nordics automotive brake wear indicators Revenue (undefined) Forecast, by Application 2020 & 2033
- Table 52: Nordics automotive brake wear indicators Volume (K) Forecast, by Application 2020 & 2033
- Table 53: Rest of Europe automotive brake wear indicators Revenue (undefined) Forecast, by Application 2020 & 2033
- Table 54: Rest of Europe automotive brake wear indicators Volume (K) Forecast, by Application 2020 & 2033
- Table 55: Global automotive brake wear indicators Revenue undefined Forecast, by Application 2020 & 2033
- Table 56: Global automotive brake wear indicators Volume K Forecast, by Application 2020 & 2033
- Table 57: Global automotive brake wear indicators Revenue undefined Forecast, by Types 2020 & 2033
- Table 58: Global automotive brake wear indicators Volume K Forecast, by Types 2020 & 2033
- Table 59: Global automotive brake wear indicators Revenue undefined Forecast, by Country 2020 & 2033
- Table 60: Global automotive brake wear indicators Volume K Forecast, by Country 2020 & 2033
- Table 61: Turkey automotive brake wear indicators Revenue (undefined) Forecast, by Application 2020 & 2033
- Table 62: Turkey automotive brake wear indicators Volume (K) Forecast, by Application 2020 & 2033
- Table 63: Israel automotive brake wear indicators Revenue (undefined) Forecast, by Application 2020 & 2033
- Table 64: Israel automotive brake wear indicators Volume (K) Forecast, by Application 2020 & 2033
- Table 65: GCC automotive brake wear indicators Revenue (undefined) Forecast, by Application 2020 & 2033
- Table 66: GCC automotive brake wear indicators Volume (K) Forecast, by Application 2020 & 2033
- Table 67: North Africa automotive brake wear indicators Revenue (undefined) Forecast, by Application 2020 & 2033
- Table 68: North Africa automotive brake wear indicators Volume (K) Forecast, by Application 2020 & 2033
- Table 69: South Africa automotive brake wear indicators Revenue (undefined) Forecast, by Application 2020 & 2033
- Table 70: South Africa automotive brake wear indicators Volume (K) Forecast, by Application 2020 & 2033
- Table 71: Rest of Middle East & Africa automotive brake wear indicators Revenue (undefined) Forecast, by Application 2020 & 2033
- Table 72: Rest of Middle East & Africa automotive brake wear indicators Volume (K) Forecast, by Application 2020 & 2033
- Table 73: Global automotive brake wear indicators Revenue undefined Forecast, by Application 2020 & 2033
- Table 74: Global automotive brake wear indicators Volume K Forecast, by Application 2020 & 2033
- Table 75: Global automotive brake wear indicators Revenue undefined Forecast, by Types 2020 & 2033
- Table 76: Global automotive brake wear indicators Volume K Forecast, by Types 2020 & 2033
- Table 77: Global automotive brake wear indicators Revenue undefined Forecast, by Country 2020 & 2033
- Table 78: Global automotive brake wear indicators Volume K Forecast, by Country 2020 & 2033
- Table 79: China automotive brake wear indicators Revenue (undefined) Forecast, by Application 2020 & 2033
- Table 80: China automotive brake wear indicators Volume (K) Forecast, by Application 2020 & 2033
- Table 81: India automotive brake wear indicators Revenue (undefined) Forecast, by Application 2020 & 2033
- Table 82: India automotive brake wear indicators Volume (K) Forecast, by Application 2020 & 2033
- Table 83: Japan automotive brake wear indicators Revenue (undefined) Forecast, by Application 2020 & 2033
- Table 84: Japan automotive brake wear indicators Volume (K) Forecast, by Application 2020 & 2033
- Table 85: South Korea automotive brake wear indicators Revenue (undefined) Forecast, by Application 2020 & 2033
- Table 86: South Korea automotive brake wear indicators Volume (K) Forecast, by Application 2020 & 2033
- Table 87: ASEAN automotive brake wear indicators Revenue (undefined) Forecast, by Application 2020 & 2033
- Table 88: ASEAN automotive brake wear indicators Volume (K) Forecast, by Application 2020 & 2033
- Table 89: Oceania automotive brake wear indicators Revenue (undefined) Forecast, by Application 2020 & 2033
- Table 90: Oceania automotive brake wear indicators Volume (K) Forecast, by Application 2020 & 2033
- Table 91: Rest of Asia Pacific automotive brake wear indicators Revenue (undefined) Forecast, by Application 2020 & 2033
- Table 92: Rest of Asia Pacific automotive brake wear indicators Volume (K) Forecast, by Application 2020 & 2033
Frequently Asked Questions
1. What is the projected Compound Annual Growth Rate (CAGR) of the automotive brake wear indicators?
The projected CAGR is approximately 8%.
2. Which companies are prominent players in the automotive brake wear indicators?
Key companies in the market include Federal Mogul, BOSCH, Delphi, WABCO, FTE, Brembo, TRW, CAT, Standard, SADECA, Continental, NUCAP, ACDelco, DMA, JURID, Meyle, Bendix, Herth+Buss, Prettl.
3. What are the main segments of the automotive brake wear indicators?
The market segments include Application, Types.
4. Can you provide details about the market size?
The market size is estimated to be USD XXX N/A as of 2022.
5. What are some drivers contributing to market growth?
N/A
6. What are the notable trends driving market growth?
N/A
7. Are there any restraints impacting market growth?
N/A
8. Can you provide examples of recent developments in the market?
N/A
9. What pricing options are available for accessing the report?
Pricing options include single-user, multi-user, and enterprise licenses priced at USD 4350.00, USD 6525.00, and USD 8700.00 respectively.
10. Is the market size provided in terms of value or volume?
The market size is provided in terms of value, measured in N/A and volume, measured in K.
11. Are there any specific market keywords associated with the report?
Yes, the market keyword associated with the report is "automotive brake wear indicators," which aids in identifying and referencing the specific market segment covered.
12. How do I determine which pricing option suits my needs best?
The pricing options vary based on user requirements and access needs. Individual users may opt for single-user licenses, while businesses requiring broader access may choose multi-user or enterprise licenses for cost-effective access to the report.
13. Are there any additional resources or data provided in the automotive brake wear indicators report?
While the report offers comprehensive insights, it's advisable to review the specific contents or supplementary materials provided to ascertain if additional resources or data are available.
14. How can I stay updated on further developments or reports in the automotive brake wear indicators?
To stay informed about further developments, trends, and reports in the automotive brake wear indicators, consider subscribing to industry newsletters, following relevant companies and organizations, or regularly checking reputable industry news sources and publications.
Methodology
Step 1 - Identification of Relevant Samples Size from Population Database


Step 2 - Approaches for Defining Global Market Size (Value, Volume* & Price*)

Note*: In applicable scenarios
Step 3 - Data Sources
Primary Research
- Web Analytics
- Survey Reports
- Research Institute
- Latest Research Reports
- Opinion Leaders
Secondary Research
- Annual Reports
- White Paper
- Latest Press Release
- Industry Association
- Paid Database
- Investor Presentations

Step 4 - Data Triangulation
Involves using different sources of information in order to increase the validity of a study
These sources are likely to be stakeholders in a program - participants, other researchers, program staff, other community members, and so on.
Then we put all data in single framework & apply various statistical tools to find out the dynamic on the market.
During the analysis stage, feedback from the stakeholder groups would be compared to determine areas of agreement as well as areas of divergence