

Key Insights
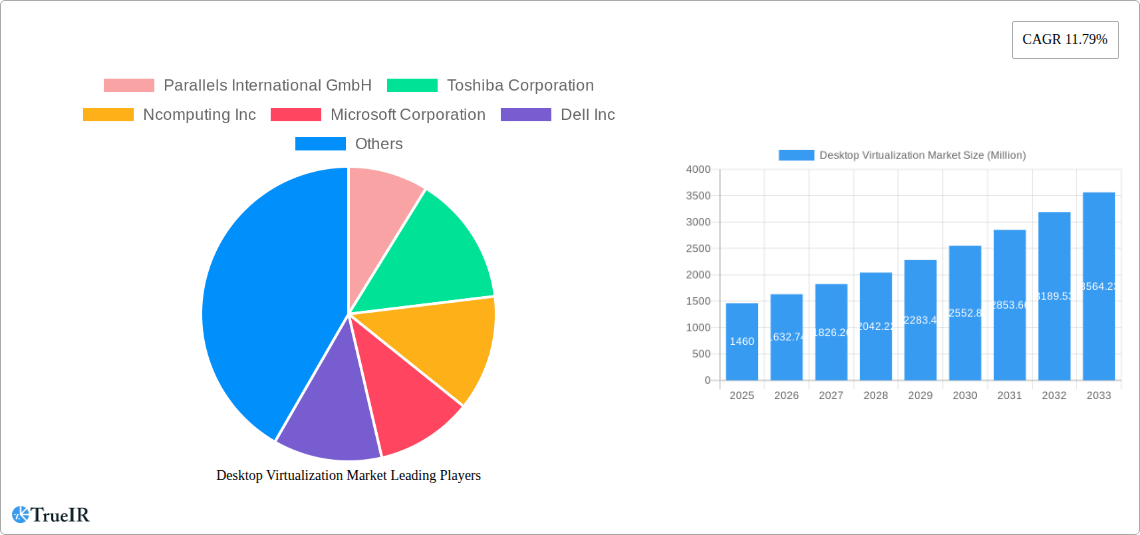
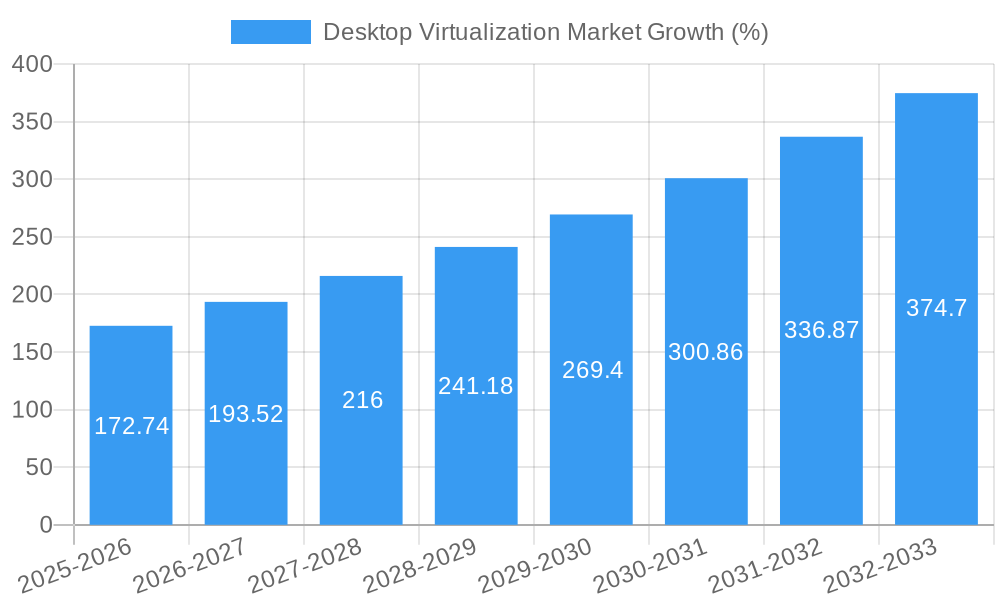
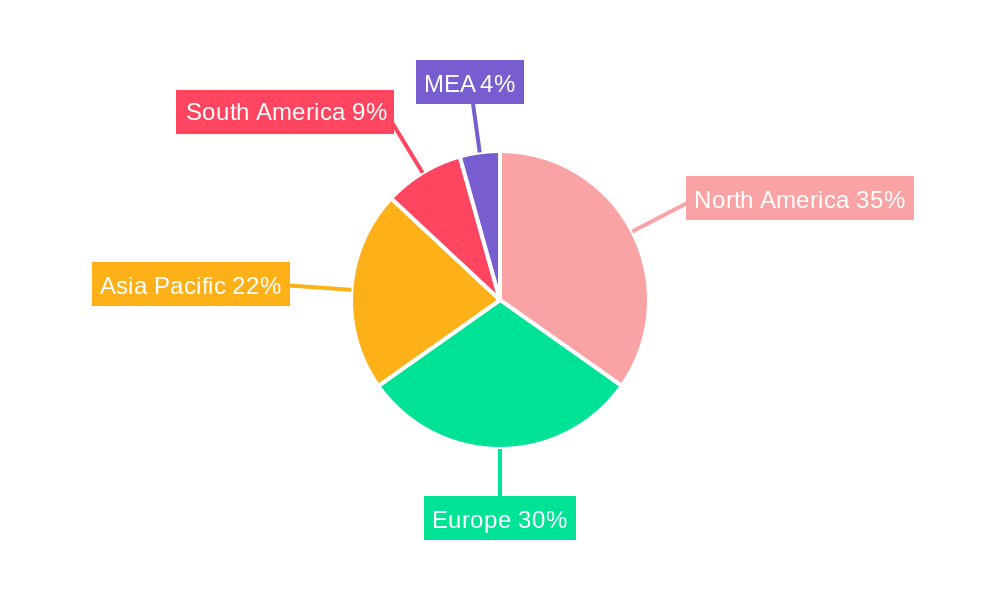
The global Desktop Virtualization market is experiencing robust growth, projected to reach a valuation of $1.46 billion in 2025 and maintain a Compound Annual Growth Rate (CAGR) of 11.79% from 2025 to 2033. This expansion is driven by several key factors. The increasing adoption of cloud computing and the associated benefits of enhanced scalability, cost-effectiveness, and accessibility are significant drivers. Businesses are increasingly embracing virtualization to improve operational efficiency, streamline IT management, and enhance security by centralizing data and access control. Furthermore, the rising demand for remote work solutions and the need for improved employee productivity in hybrid work models are fueling market growth. The transition towards advanced technologies like artificial intelligence and machine learning within the virtualization space further contributes to the expanding market. Growth is observed across various segments, including Hosted Virtual Desktops (HVD) and Hosted Shared Desktops (HSD) delivery platforms, as well as on-premise and cloud deployment modes. North America and Europe currently hold significant market shares, though the Asia-Pacific region exhibits considerable growth potential due to rapid digitalization and increasing adoption of virtualization technologies within emerging economies.
Competition within the Desktop Virtualization market is intense, with established players like Citrix, VMware, and Microsoft competing alongside emerging technology providers. The market is characterized by continuous innovation in areas such as enhanced security features, improved user experience, and support for diverse device compatibility. Companies are actively investing in research and development to improve their offerings and cater to evolving customer needs. Potential market restraints include the initial high investment costs associated with implementation, concerns surrounding data security and privacy, and the need for specialized IT expertise to effectively manage virtualized desktop environments. However, ongoing technological advancements and the increasing value proposition of virtualization are expected to mitigate these challenges and sustain the market's impressive growth trajectory over the forecast period.
Desktop Virtualization Market: A Comprehensive Market Report (2019-2033)
This dynamic report provides a detailed analysis of the Desktop Virtualization Market, offering invaluable insights for businesses and investors seeking to navigate this rapidly evolving landscape. Covering the period from 2019 to 2033, with a focus on 2025, this report leverages extensive data and expert analysis to illuminate key market trends, opportunities, and challenges. The market is estimated to be worth xx Million in 2025 and is projected to reach xx Million by 2033, exhibiting a robust CAGR of xx%.
Desktop Virtualization Market Market Structure & Competitive Landscape
The Desktop Virtualization market exhibits a moderately concentrated structure, with a few major players holding significant market share. However, the market is characterized by intense competition driven by continuous innovation and the emergence of new technologies. The Herfindahl-Hirschman Index (HHI) for the market in 2025 is estimated at xx, suggesting a moderately competitive landscape. Regulatory impacts, particularly concerning data privacy and security, significantly influence market dynamics. Product substitutes, such as cloud-based SaaS applications, pose a challenge to traditional desktop virtualization solutions. End-user segmentation spans various industries, including finance, healthcare, education, and government, each with unique virtualization needs. Mergers and acquisitions (M&A) activity has been moderate in recent years, with approximately xx M&A deals recorded between 2019 and 2024, primarily focused on consolidating market share and expanding product portfolios.
- Market Concentration: Moderately concentrated, with a few dominant players.
- Innovation Drivers: Technological advancements in cloud computing, security, and network infrastructure.
- Regulatory Impacts: Data privacy regulations and cybersecurity standards influence market dynamics.
- Product Substitutes: Cloud-based SaaS applications and other remote access technologies.
- End-User Segmentation: Diverse, spanning various industries with specific virtualization requirements.
- M&A Trends: Moderate M&A activity, focused on consolidation and expansion.
Desktop Virtualization Market Market Trends & Opportunities
The Desktop Virtualization market is experiencing significant growth fueled by the increasing adoption of cloud computing, the rise of remote work, and the need for enhanced security and scalability. The market size expanded from xx Million in 2019 to an estimated xx Million in 2025, demonstrating a robust growth trajectory. Technological shifts, particularly the adoption of advanced virtualization technologies like GPU virtualization and containerization, are driving market expansion. Consumer preferences for flexible, secure, and cost-effective computing solutions further fuel market growth. Competitive dynamics are characterized by intense innovation, strategic partnerships, and a focus on delivering enhanced user experiences. Market penetration rates are rising across various industries, particularly in sectors with high security requirements and a large remote workforce. The overall market is expected to grow at a healthy CAGR of xx% during the forecast period (2025-2033).
Dominant Markets & Segments in Desktop Virtualization Market
The North American region currently holds the dominant position in the Desktop Virtualization market, driven by strong technological advancements and a high concentration of key players. Within the market segments:
- By Desktop delivery platform: Hosted Virtual Desktop (HVD) currently leads the market, owing to its scalability and flexibility. Hosted Shared Desktop (HSD) is experiencing slower but steady growth, primarily driven by cost-effectiveness in specific use cases.
- By Deployment Mode: Cloud deployment is rapidly gaining traction due to its scalability, cost-efficiency, and ease of management. On-premise deployments remain relevant in sectors with stringent security and compliance requirements.
Key Growth Drivers:
- Robust Cloud Infrastructure: Expanding cloud computing capabilities fuel demand for cloud-based desktop virtualization.
- Government Initiatives: Government policies promoting digital transformation and remote work accelerate market adoption.
- Enhanced Security: Increased cyber threats drive demand for secure and robust virtualization solutions.
The dominance of North America is attributed to its well-established IT infrastructure, strong regulatory support for technological innovation, and the presence of major market players. European and Asia-Pacific markets are experiencing rapid growth, driven by increasing digitalization and technological advancements.
Desktop Virtualization Market Product Analysis
The Desktop Virtualization market showcases a diverse range of products, encompassing various virtualization platforms, management tools, and security solutions. Recent innovations focus on enhancing security, improving user experience, and integrating with other cloud-based services. These products offer competitive advantages through features like seamless application integration, advanced security measures, and optimized performance. The market is witnessing a shift towards integrated, cloud-based solutions that offer greater flexibility and scalability.
Key Drivers, Barriers & Challenges in Desktop Virtualization Market
Key Drivers:
The market is driven by the increasing demand for secure and scalable remote work solutions, coupled with the advancements in cloud computing technologies and improved cybersecurity measures. The rising adoption of BYOD policies and the need for enhanced operational efficiency further bolster market growth.
Challenges:
Significant challenges include concerns about data security and privacy, the complexity of implementing and managing virtualized desktops, and the costs associated with infrastructure upgrades and software licenses. Competition from alternative technologies also pose a restraint on market growth. The estimated impact of these challenges on market growth is around xx% by 2033.
Growth Drivers in the Desktop Virtualization Market Market
The market's growth is significantly fueled by the rising adoption of cloud computing, the increasing need for remote work solutions, and the growing emphasis on enhanced security and scalability. Government initiatives promoting digital transformation are also contributing to market expansion.
Challenges Impacting Desktop Virtualization Market Growth
Major challenges include high initial investment costs, integration complexities, security concerns, and vendor lock-in. Competition from alternative remote access solutions and the skills gap in managing virtualized environments also hinder market growth.
Key Players Shaping the Desktop Virtualization Market Market
- Parallels International GmbH
- Toshiba Corporation
- Ncomputing Inc
- Microsoft Corporation
- Dell Inc
- Huawei Technologies Co Ltd
- Ericom Software Inc
- Citrix Systems Inc
- Red Hat Inc (IBM Corporation)
- Tems Inc
- Vmware Inc
Significant Desktop Virtualization Market Industry Milestones
- July 2022: Microsoft announced Azure virtual desktop support for virtual machines with "Trusted Launch" protections, enhancing security and addressing concerns about bootkits.
- January 2023: VMware unveiled a new solution for global retailers to modernize point-of-sale (POS) systems, improving operational efficiency and unlocking financial value. This significantly impacts the retail sector's adoption of desktop virtualization solutions.
Future Outlook for Desktop Virtualization Market Market
The Desktop Virtualization market is poised for continued growth, driven by ongoing technological advancements, increasing demand for remote work solutions, and the growing adoption of cloud computing. Strategic opportunities lie in developing innovative solutions that address security concerns, improve user experience, and offer seamless integration with other cloud-based services. The market's potential is vast, with significant growth expected across various industries and geographical regions.
Desktop Virtualization Market Segmentation
-
1. Desktop delivery platform
- 1.1. Hosted Virtual Desktop (HVD)
- 1.2. Hosted Shared Desktop (HSD)
-
2. Deployment Mode
- 2.1. On-premise
- 2.2. Cloud
Desktop Virtualization Market Segmentation By Geography
- 1. North America
- 2. Europe
- 3. Asia
- 4. Australia and New Zealand
- 5. Latin America
- 6. Middle East and Africa
Desktop Virtualization Market REPORT HIGHLIGHTS
| Aspects | Details |
|---|---|
| Study Period | 2019-2033 |
| Base Year | 2024 |
| Estimated Year | 2025 |
| Forecast Period | 2025-2033 |
| Historical Period | 2019-2024 |
| Growth Rate | CAGR of 11.79% from 2019-2033 |
| Segmentation |
|
Table of Contents
- 1. Introduction
- 1.1. Research Scope
- 1.2. Market Segmentation
- 1.3. Research Methodology
- 1.4. Definitions and Assumptions
- 2. Executive Summary
- 2.1. Introduction
- 3. Market Dynamics
- 3.1. Introduction
- 3.2. Market Drivers
- 3.2.1. Increasing Adoption of Cloud Computing; Growth in Automation in Retail
- 3.3. Market Restrains
- 3.3.1. Infrastructure Deployment Constraints
- 3.4. Market Trends
- 3.4.1. Hosted Virtual Desktop Accounts for Significant Market Share
- 4. Market Factor Analysis
- 4.1. Porters Five Forces
- 4.2. Supply/Value Chain
- 4.3. PESTEL analysis
- 4.4. Market Entropy
- 4.5. Patent/Trademark Analysis
- 5. Global Desktop Virtualization Market Analysis, Insights and Forecast, 2019-2031
- 5.1. Market Analysis, Insights and Forecast - by Desktop delivery platform
- 5.1.1. Hosted Virtual Desktop (HVD)
- 5.1.2. Hosted Shared Desktop (HSD)
- 5.2. Market Analysis, Insights and Forecast - by Deployment Mode
- 5.2.1. On-premise
- 5.2.2. Cloud
- 5.3. Market Analysis, Insights and Forecast - by Region
- 5.3.1. North America
- 5.3.2. Europe
- 5.3.3. Asia
- 5.3.4. Australia and New Zealand
- 5.3.5. Latin America
- 5.3.6. Middle East and Africa
- 5.1. Market Analysis, Insights and Forecast - by Desktop delivery platform
- 6. North America Desktop Virtualization Market Analysis, Insights and Forecast, 2019-2031
- 6.1. Market Analysis, Insights and Forecast - by Desktop delivery platform
- 6.1.1. Hosted Virtual Desktop (HVD)
- 6.1.2. Hosted Shared Desktop (HSD)
- 6.2. Market Analysis, Insights and Forecast - by Deployment Mode
- 6.2.1. On-premise
- 6.2.2. Cloud
- 6.1. Market Analysis, Insights and Forecast - by Desktop delivery platform
- 7. Europe Desktop Virtualization Market Analysis, Insights and Forecast, 2019-2031
- 7.1. Market Analysis, Insights and Forecast - by Desktop delivery platform
- 7.1.1. Hosted Virtual Desktop (HVD)
- 7.1.2. Hosted Shared Desktop (HSD)
- 7.2. Market Analysis, Insights and Forecast - by Deployment Mode
- 7.2.1. On-premise
- 7.2.2. Cloud
- 7.1. Market Analysis, Insights and Forecast - by Desktop delivery platform
- 8. Asia Desktop Virtualization Market Analysis, Insights and Forecast, 2019-2031
- 8.1. Market Analysis, Insights and Forecast - by Desktop delivery platform
- 8.1.1. Hosted Virtual Desktop (HVD)
- 8.1.2. Hosted Shared Desktop (HSD)
- 8.2. Market Analysis, Insights and Forecast - by Deployment Mode
- 8.2.1. On-premise
- 8.2.2. Cloud
- 8.1. Market Analysis, Insights and Forecast - by Desktop delivery platform
- 9. Australia and New Zealand Desktop Virtualization Market Analysis, Insights and Forecast, 2019-2031
- 9.1. Market Analysis, Insights and Forecast - by Desktop delivery platform
- 9.1.1. Hosted Virtual Desktop (HVD)
- 9.1.2. Hosted Shared Desktop (HSD)
- 9.2. Market Analysis, Insights and Forecast - by Deployment Mode
- 9.2.1. On-premise
- 9.2.2. Cloud
- 9.1. Market Analysis, Insights and Forecast - by Desktop delivery platform
- 10. Latin America Desktop Virtualization Market Analysis, Insights and Forecast, 2019-2031
- 10.1. Market Analysis, Insights and Forecast - by Desktop delivery platform
- 10.1.1. Hosted Virtual Desktop (HVD)
- 10.1.2. Hosted Shared Desktop (HSD)
- 10.2. Market Analysis, Insights and Forecast - by Deployment Mode
- 10.2.1. On-premise
- 10.2.2. Cloud
- 10.1. Market Analysis, Insights and Forecast - by Desktop delivery platform
- 11. Middle East and Africa Desktop Virtualization Market Analysis, Insights and Forecast, 2019-2031
- 11.1. Market Analysis, Insights and Forecast - by Desktop delivery platform
- 11.1.1. Hosted Virtual Desktop (HVD)
- 11.1.2. Hosted Shared Desktop (HSD)
- 11.2. Market Analysis, Insights and Forecast - by Deployment Mode
- 11.2.1. On-premise
- 11.2.2. Cloud
- 11.1. Market Analysis, Insights and Forecast - by Desktop delivery platform
- 12. North America Desktop Virtualization Market Analysis, Insights and Forecast, 2019-2031
- 12.1. Market Analysis, Insights and Forecast - By Country/Sub-region
- 12.1.1 United States
- 12.1.2 Canada
- 12.1.3 Mexico
- 13. Europe Desktop Virtualization Market Analysis, Insights and Forecast, 2019-2031
- 13.1. Market Analysis, Insights and Forecast - By Country/Sub-region
- 13.1.1 Germany
- 13.1.2 United Kingdom
- 13.1.3 France
- 13.1.4 Spain
- 13.1.5 Italy
- 13.1.6 Spain
- 13.1.7 Belgium
- 13.1.8 Netherland
- 13.1.9 Nordics
- 13.1.10 Rest of Europe
- 14. Asia Pacific Desktop Virtualization Market Analysis, Insights and Forecast, 2019-2031
- 14.1. Market Analysis, Insights and Forecast - By Country/Sub-region
- 14.1.1 China
- 14.1.2 Japan
- 14.1.3 India
- 14.1.4 South Korea
- 14.1.5 Southeast Asia
- 14.1.6 Australia
- 14.1.7 Indonesia
- 14.1.8 Phillipes
- 14.1.9 Singapore
- 14.1.10 Thailandc
- 14.1.11 Rest of Asia Pacific
- 15. South America Desktop Virtualization Market Analysis, Insights and Forecast, 2019-2031
- 15.1. Market Analysis, Insights and Forecast - By Country/Sub-region
- 15.1.1 Brazil
- 15.1.2 Argentina
- 15.1.3 Peru
- 15.1.4 Chile
- 15.1.5 Colombia
- 15.1.6 Ecuador
- 15.1.7 Venezuela
- 15.1.8 Rest of South America
- 16. North America Desktop Virtualization Market Analysis, Insights and Forecast, 2019-2031
- 16.1. Market Analysis, Insights and Forecast - By Country/Sub-region
- 16.1.1 United States
- 16.1.2 Canada
- 16.1.3 Mexico
- 17. MEA Desktop Virtualization Market Analysis, Insights and Forecast, 2019-2031
- 17.1. Market Analysis, Insights and Forecast - By Country/Sub-region
- 17.1.1 United Arab Emirates
- 17.1.2 Saudi Arabia
- 17.1.3 South Africa
- 17.1.4 Rest of Middle East and Africa
- 18. Competitive Analysis
- 18.1. Global Market Share Analysis 2024
- 18.2. Company Profiles
- 18.2.1 Parallels International GmbH
- 18.2.1.1. Overview
- 18.2.1.2. Products
- 18.2.1.3. SWOT Analysis
- 18.2.1.4. Recent Developments
- 18.2.1.5. Financials (Based on Availability)
- 18.2.2 Toshiba Corporation
- 18.2.2.1. Overview
- 18.2.2.2. Products
- 18.2.2.3. SWOT Analysis
- 18.2.2.4. Recent Developments
- 18.2.2.5. Financials (Based on Availability)
- 18.2.3 Ncomputing Inc
- 18.2.3.1. Overview
- 18.2.3.2. Products
- 18.2.3.3. SWOT Analysis
- 18.2.3.4. Recent Developments
- 18.2.3.5. Financials (Based on Availability)
- 18.2.4 Microsoft Corporation
- 18.2.4.1. Overview
- 18.2.4.2. Products
- 18.2.4.3. SWOT Analysis
- 18.2.4.4. Recent Developments
- 18.2.4.5. Financials (Based on Availability)
- 18.2.5 Dell Inc
- 18.2.5.1. Overview
- 18.2.5.2. Products
- 18.2.5.3. SWOT Analysis
- 18.2.5.4. Recent Developments
- 18.2.5.5. Financials (Based on Availability)
- 18.2.6 Huawei Technologies Co Ltd
- 18.2.6.1. Overview
- 18.2.6.2. Products
- 18.2.6.3. SWOT Analysis
- 18.2.6.4. Recent Developments
- 18.2.6.5. Financials (Based on Availability)
- 18.2.7 Ericom Software Inc
- 18.2.7.1. Overview
- 18.2.7.2. Products
- 18.2.7.3. SWOT Analysis
- 18.2.7.4. Recent Developments
- 18.2.7.5. Financials (Based on Availability)
- 18.2.8 Citrix Systems Inc
- 18.2.8.1. Overview
- 18.2.8.2. Products
- 18.2.8.3. SWOT Analysis
- 18.2.8.4. Recent Developments
- 18.2.8.5. Financials (Based on Availability)
- 18.2.9 Red Hat Inc (IBM Corporation )
- 18.2.9.1. Overview
- 18.2.9.2. Products
- 18.2.9.3. SWOT Analysis
- 18.2.9.4. Recent Developments
- 18.2.9.5. Financials (Based on Availability)
- 18.2.10 Tems Inc
- 18.2.10.1. Overview
- 18.2.10.2. Products
- 18.2.10.3. SWOT Analysis
- 18.2.10.4. Recent Developments
- 18.2.10.5. Financials (Based on Availability)
- 18.2.11 Vmware Inc
- 18.2.11.1. Overview
- 18.2.11.2. Products
- 18.2.11.3. SWOT Analysis
- 18.2.11.4. Recent Developments
- 18.2.11.5. Financials (Based on Availability)
- 18.2.1 Parallels International GmbH
List of Figures
- Figure 1: Global Desktop Virtualization Market Revenue Breakdown (Million, %) by Region 2024 & 2032
- Figure 2: North America Desktop Virtualization Market Revenue (Million), by Country 2024 & 2032
- Figure 3: North America Desktop Virtualization Market Revenue Share (%), by Country 2024 & 2032
- Figure 4: Europe Desktop Virtualization Market Revenue (Million), by Country 2024 & 2032
- Figure 5: Europe Desktop Virtualization Market Revenue Share (%), by Country 2024 & 2032
- Figure 6: Asia Pacific Desktop Virtualization Market Revenue (Million), by Country 2024 & 2032
- Figure 7: Asia Pacific Desktop Virtualization Market Revenue Share (%), by Country 2024 & 2032
- Figure 8: South America Desktop Virtualization Market Revenue (Million), by Country 2024 & 2032
- Figure 9: South America Desktop Virtualization Market Revenue Share (%), by Country 2024 & 2032
- Figure 10: North America Desktop Virtualization Market Revenue (Million), by Country 2024 & 2032
- Figure 11: North America Desktop Virtualization Market Revenue Share (%), by Country 2024 & 2032
- Figure 12: MEA Desktop Virtualization Market Revenue (Million), by Country 2024 & 2032
- Figure 13: MEA Desktop Virtualization Market Revenue Share (%), by Country 2024 & 2032
- Figure 14: North America Desktop Virtualization Market Revenue (Million), by Desktop delivery platform 2024 & 2032
- Figure 15: North America Desktop Virtualization Market Revenue Share (%), by Desktop delivery platform 2024 & 2032
- Figure 16: North America Desktop Virtualization Market Revenue (Million), by Deployment Mode 2024 & 2032
- Figure 17: North America Desktop Virtualization Market Revenue Share (%), by Deployment Mode 2024 & 2032
- Figure 18: North America Desktop Virtualization Market Revenue (Million), by Country 2024 & 2032
- Figure 19: North America Desktop Virtualization Market Revenue Share (%), by Country 2024 & 2032
- Figure 20: Europe Desktop Virtualization Market Revenue (Million), by Desktop delivery platform 2024 & 2032
- Figure 21: Europe Desktop Virtualization Market Revenue Share (%), by Desktop delivery platform 2024 & 2032
- Figure 22: Europe Desktop Virtualization Market Revenue (Million), by Deployment Mode 2024 & 2032
- Figure 23: Europe Desktop Virtualization Market Revenue Share (%), by Deployment Mode 2024 & 2032
- Figure 24: Europe Desktop Virtualization Market Revenue (Million), by Country 2024 & 2032
- Figure 25: Europe Desktop Virtualization Market Revenue Share (%), by Country 2024 & 2032
- Figure 26: Asia Desktop Virtualization Market Revenue (Million), by Desktop delivery platform 2024 & 2032
- Figure 27: Asia Desktop Virtualization Market Revenue Share (%), by Desktop delivery platform 2024 & 2032
- Figure 28: Asia Desktop Virtualization Market Revenue (Million), by Deployment Mode 2024 & 2032
- Figure 29: Asia Desktop Virtualization Market Revenue Share (%), by Deployment Mode 2024 & 2032
- Figure 30: Asia Desktop Virtualization Market Revenue (Million), by Country 2024 & 2032
- Figure 31: Asia Desktop Virtualization Market Revenue Share (%), by Country 2024 & 2032
- Figure 32: Australia and New Zealand Desktop Virtualization Market Revenue (Million), by Desktop delivery platform 2024 & 2032
- Figure 33: Australia and New Zealand Desktop Virtualization Market Revenue Share (%), by Desktop delivery platform 2024 & 2032
- Figure 34: Australia and New Zealand Desktop Virtualization Market Revenue (Million), by Deployment Mode 2024 & 2032
- Figure 35: Australia and New Zealand Desktop Virtualization Market Revenue Share (%), by Deployment Mode 2024 & 2032
- Figure 36: Australia and New Zealand Desktop Virtualization Market Revenue (Million), by Country 2024 & 2032
- Figure 37: Australia and New Zealand Desktop Virtualization Market Revenue Share (%), by Country 2024 & 2032
- Figure 38: Latin America Desktop Virtualization Market Revenue (Million), by Desktop delivery platform 2024 & 2032
- Figure 39: Latin America Desktop Virtualization Market Revenue Share (%), by Desktop delivery platform 2024 & 2032
- Figure 40: Latin America Desktop Virtualization Market Revenue (Million), by Deployment Mode 2024 & 2032
- Figure 41: Latin America Desktop Virtualization Market Revenue Share (%), by Deployment Mode 2024 & 2032
- Figure 42: Latin America Desktop Virtualization Market Revenue (Million), by Country 2024 & 2032
- Figure 43: Latin America Desktop Virtualization Market Revenue Share (%), by Country 2024 & 2032
- Figure 44: Middle East and Africa Desktop Virtualization Market Revenue (Million), by Desktop delivery platform 2024 & 2032
- Figure 45: Middle East and Africa Desktop Virtualization Market Revenue Share (%), by Desktop delivery platform 2024 & 2032
- Figure 46: Middle East and Africa Desktop Virtualization Market Revenue (Million), by Deployment Mode 2024 & 2032
- Figure 47: Middle East and Africa Desktop Virtualization Market Revenue Share (%), by Deployment Mode 2024 & 2032
- Figure 48: Middle East and Africa Desktop Virtualization Market Revenue (Million), by Country 2024 & 2032
- Figure 49: Middle East and Africa Desktop Virtualization Market Revenue Share (%), by Country 2024 & 2032
List of Tables
- Table 1: Global Desktop Virtualization Market Revenue Million Forecast, by Region 2019 & 2032
- Table 2: Global Desktop Virtualization Market Revenue Million Forecast, by Desktop delivery platform 2019 & 2032
- Table 3: Global Desktop Virtualization Market Revenue Million Forecast, by Deployment Mode 2019 & 2032
- Table 4: Global Desktop Virtualization Market Revenue Million Forecast, by Region 2019 & 2032
- Table 5: Global Desktop Virtualization Market Revenue Million Forecast, by Country 2019 & 2032
- Table 6: United States Desktop Virtualization Market Revenue (Million) Forecast, by Application 2019 & 2032
- Table 7: Canada Desktop Virtualization Market Revenue (Million) Forecast, by Application 2019 & 2032
- Table 8: Mexico Desktop Virtualization Market Revenue (Million) Forecast, by Application 2019 & 2032
- Table 9: Global Desktop Virtualization Market Revenue Million Forecast, by Country 2019 & 2032
- Table 10: Germany Desktop Virtualization Market Revenue (Million) Forecast, by Application 2019 & 2032
- Table 11: United Kingdom Desktop Virtualization Market Revenue (Million) Forecast, by Application 2019 & 2032
- Table 12: France Desktop Virtualization Market Revenue (Million) Forecast, by Application 2019 & 2032
- Table 13: Spain Desktop Virtualization Market Revenue (Million) Forecast, by Application 2019 & 2032
- Table 14: Italy Desktop Virtualization Market Revenue (Million) Forecast, by Application 2019 & 2032
- Table 15: Spain Desktop Virtualization Market Revenue (Million) Forecast, by Application 2019 & 2032
- Table 16: Belgium Desktop Virtualization Market Revenue (Million) Forecast, by Application 2019 & 2032
- Table 17: Netherland Desktop Virtualization Market Revenue (Million) Forecast, by Application 2019 & 2032
- Table 18: Nordics Desktop Virtualization Market Revenue (Million) Forecast, by Application 2019 & 2032
- Table 19: Rest of Europe Desktop Virtualization Market Revenue (Million) Forecast, by Application 2019 & 2032
- Table 20: Global Desktop Virtualization Market Revenue Million Forecast, by Country 2019 & 2032
- Table 21: China Desktop Virtualization Market Revenue (Million) Forecast, by Application 2019 & 2032
- Table 22: Japan Desktop Virtualization Market Revenue (Million) Forecast, by Application 2019 & 2032
- Table 23: India Desktop Virtualization Market Revenue (Million) Forecast, by Application 2019 & 2032
- Table 24: South Korea Desktop Virtualization Market Revenue (Million) Forecast, by Application 2019 & 2032
- Table 25: Southeast Asia Desktop Virtualization Market Revenue (Million) Forecast, by Application 2019 & 2032
- Table 26: Australia Desktop Virtualization Market Revenue (Million) Forecast, by Application 2019 & 2032
- Table 27: Indonesia Desktop Virtualization Market Revenue (Million) Forecast, by Application 2019 & 2032
- Table 28: Phillipes Desktop Virtualization Market Revenue (Million) Forecast, by Application 2019 & 2032
- Table 29: Singapore Desktop Virtualization Market Revenue (Million) Forecast, by Application 2019 & 2032
- Table 30: Thailandc Desktop Virtualization Market Revenue (Million) Forecast, by Application 2019 & 2032
- Table 31: Rest of Asia Pacific Desktop Virtualization Market Revenue (Million) Forecast, by Application 2019 & 2032
- Table 32: Global Desktop Virtualization Market Revenue Million Forecast, by Country 2019 & 2032
- Table 33: Brazil Desktop Virtualization Market Revenue (Million) Forecast, by Application 2019 & 2032
- Table 34: Argentina Desktop Virtualization Market Revenue (Million) Forecast, by Application 2019 & 2032
- Table 35: Peru Desktop Virtualization Market Revenue (Million) Forecast, by Application 2019 & 2032
- Table 36: Chile Desktop Virtualization Market Revenue (Million) Forecast, by Application 2019 & 2032
- Table 37: Colombia Desktop Virtualization Market Revenue (Million) Forecast, by Application 2019 & 2032
- Table 38: Ecuador Desktop Virtualization Market Revenue (Million) Forecast, by Application 2019 & 2032
- Table 39: Venezuela Desktop Virtualization Market Revenue (Million) Forecast, by Application 2019 & 2032
- Table 40: Rest of South America Desktop Virtualization Market Revenue (Million) Forecast, by Application 2019 & 2032
- Table 41: Global Desktop Virtualization Market Revenue Million Forecast, by Country 2019 & 2032
- Table 42: United States Desktop Virtualization Market Revenue (Million) Forecast, by Application 2019 & 2032
- Table 43: Canada Desktop Virtualization Market Revenue (Million) Forecast, by Application 2019 & 2032
- Table 44: Mexico Desktop Virtualization Market Revenue (Million) Forecast, by Application 2019 & 2032
- Table 45: Global Desktop Virtualization Market Revenue Million Forecast, by Country 2019 & 2032
- Table 46: United Arab Emirates Desktop Virtualization Market Revenue (Million) Forecast, by Application 2019 & 2032
- Table 47: Saudi Arabia Desktop Virtualization Market Revenue (Million) Forecast, by Application 2019 & 2032
- Table 48: South Africa Desktop Virtualization Market Revenue (Million) Forecast, by Application 2019 & 2032
- Table 49: Rest of Middle East and Africa Desktop Virtualization Market Revenue (Million) Forecast, by Application 2019 & 2032
- Table 50: Global Desktop Virtualization Market Revenue Million Forecast, by Desktop delivery platform 2019 & 2032
- Table 51: Global Desktop Virtualization Market Revenue Million Forecast, by Deployment Mode 2019 & 2032
- Table 52: Global Desktop Virtualization Market Revenue Million Forecast, by Country 2019 & 2032
- Table 53: Global Desktop Virtualization Market Revenue Million Forecast, by Desktop delivery platform 2019 & 2032
- Table 54: Global Desktop Virtualization Market Revenue Million Forecast, by Deployment Mode 2019 & 2032
- Table 55: Global Desktop Virtualization Market Revenue Million Forecast, by Country 2019 & 2032
- Table 56: Global Desktop Virtualization Market Revenue Million Forecast, by Desktop delivery platform 2019 & 2032
- Table 57: Global Desktop Virtualization Market Revenue Million Forecast, by Deployment Mode 2019 & 2032
- Table 58: Global Desktop Virtualization Market Revenue Million Forecast, by Country 2019 & 2032
- Table 59: Global Desktop Virtualization Market Revenue Million Forecast, by Desktop delivery platform 2019 & 2032
- Table 60: Global Desktop Virtualization Market Revenue Million Forecast, by Deployment Mode 2019 & 2032
- Table 61: Global Desktop Virtualization Market Revenue Million Forecast, by Country 2019 & 2032
- Table 62: Global Desktop Virtualization Market Revenue Million Forecast, by Desktop delivery platform 2019 & 2032
- Table 63: Global Desktop Virtualization Market Revenue Million Forecast, by Deployment Mode 2019 & 2032
- Table 64: Global Desktop Virtualization Market Revenue Million Forecast, by Country 2019 & 2032
- Table 65: Global Desktop Virtualization Market Revenue Million Forecast, by Desktop delivery platform 2019 & 2032
- Table 66: Global Desktop Virtualization Market Revenue Million Forecast, by Deployment Mode 2019 & 2032
- Table 67: Global Desktop Virtualization Market Revenue Million Forecast, by Country 2019 & 2032
Frequently Asked Questions
1. What is the projected Compound Annual Growth Rate (CAGR) of the Desktop Virtualization Market?
The projected CAGR is approximately 11.79%.
2. Which companies are prominent players in the Desktop Virtualization Market?
Key companies in the market include Parallels International GmbH, Toshiba Corporation, Ncomputing Inc, Microsoft Corporation, Dell Inc, Huawei Technologies Co Ltd, Ericom Software Inc, Citrix Systems Inc, Red Hat Inc (IBM Corporation ), Tems Inc, Vmware Inc.
3. What are the main segments of the Desktop Virtualization Market?
The market segments include Desktop delivery platform, Deployment Mode.
4. Can you provide details about the market size?
The market size is estimated to be USD 1.46 Million as of 2022.
5. What are some drivers contributing to market growth?
Increasing Adoption of Cloud Computing; Growth in Automation in Retail.
6. What are the notable trends driving market growth?
Hosted Virtual Desktop Accounts for Significant Market Share.
7. Are there any restraints impacting market growth?
Infrastructure Deployment Constraints.
8. Can you provide examples of recent developments in the market?
January 2023 - VMware revealed a new solution for global retailers to modernize point of sale (POS) and unlock more financial value from their POS devices. VMware Retail POS modernization solutions enable operations, IT, marketing, and security teams to become more agile and responsive to drive critical business, customer, and IT outcomes.
9. What pricing options are available for accessing the report?
Pricing options include single-user, multi-user, and enterprise licenses priced at USD 4750, USD 5250, and USD 8750 respectively.
10. Is the market size provided in terms of value or volume?
The market size is provided in terms of value, measured in Million.
11. Are there any specific market keywords associated with the report?
Yes, the market keyword associated with the report is "Desktop Virtualization Market," which aids in identifying and referencing the specific market segment covered.
12. How do I determine which pricing option suits my needs best?
The pricing options vary based on user requirements and access needs. Individual users may opt for single-user licenses, while businesses requiring broader access may choose multi-user or enterprise licenses for cost-effective access to the report.
13. Are there any additional resources or data provided in the Desktop Virtualization Market report?
While the report offers comprehensive insights, it's advisable to review the specific contents or supplementary materials provided to ascertain if additional resources or data are available.
14. How can I stay updated on further developments or reports in the Desktop Virtualization Market?
To stay informed about further developments, trends, and reports in the Desktop Virtualization Market, consider subscribing to industry newsletters, following relevant companies and organizations, or regularly checking reputable industry news sources and publications.
Methodology
Step 1 - Identification of Relevant Samples Size from Population Database


Step 2 - Approaches for Defining Global Market Size (Value, Volume* & Price*)

Note*: In applicable scenarios
Step 3 - Data Sources
Primary Research
- Web Analytics
- Survey Reports
- Research Institute
- Latest Research Reports
- Opinion Leaders
Secondary Research
- Annual Reports
- White Paper
- Latest Press Release
- Industry Association
- Paid Database
- Investor Presentations

Step 4 - Data Triangulation
Involves using different sources of information in order to increase the validity of a study
These sources are likely to be stakeholders in a program - participants, other researchers, program staff, other community members, and so on.
Then we put all data in single framework & apply various statistical tools to find out the dynamic on the market.
During the analysis stage, feedback from the stakeholder groups would be compared to determine areas of agreement as well as areas of divergence
