

Key Insights
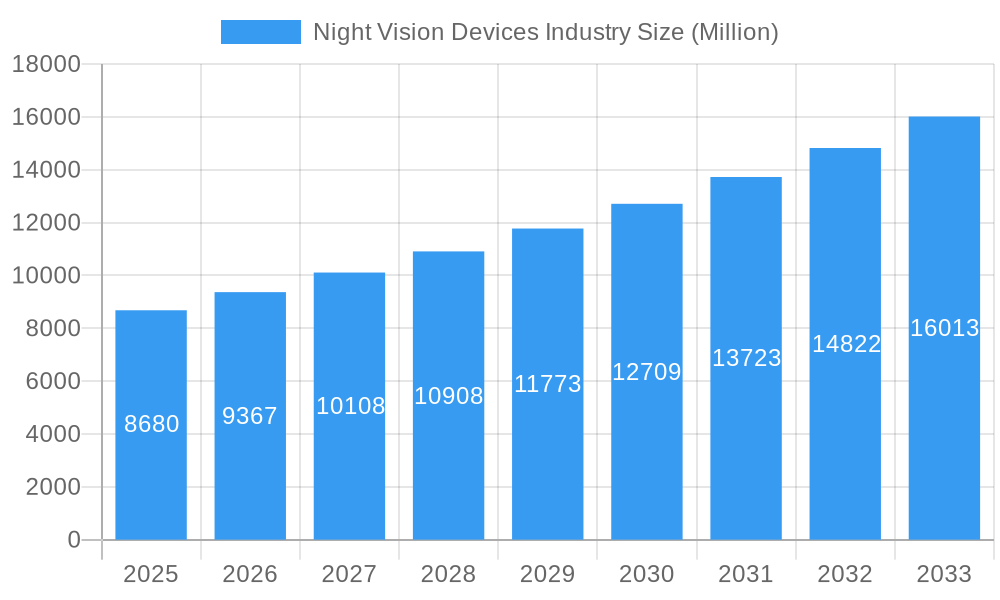
The night vision devices (NVD) market, currently valued at $8.68 billion in 2025, is projected to experience robust growth, exhibiting a Compound Annual Growth Rate (CAGR) of 7.97% from 2025 to 2033. This expansion is driven by escalating demand from military and defense sectors, increasingly sophisticated surveillance applications, and growing popularity among wildlife enthusiasts and conservationists. Technological advancements, particularly in thermal imaging and image intensification, are enhancing NVD capabilities, leading to higher resolution, improved range, and enhanced performance in diverse environmental conditions. The market's segmentation reveals a strong preference for camera-based NVDs, fueled by their versatility and ease of integration with other systems. Furthermore, thermal imaging technology continues to dominate the technological segment, owing to its superior performance in low-light and adverse weather situations. However, the high cost of advanced NVDs, coupled with stringent regulations in certain regions, pose challenges to market penetration.
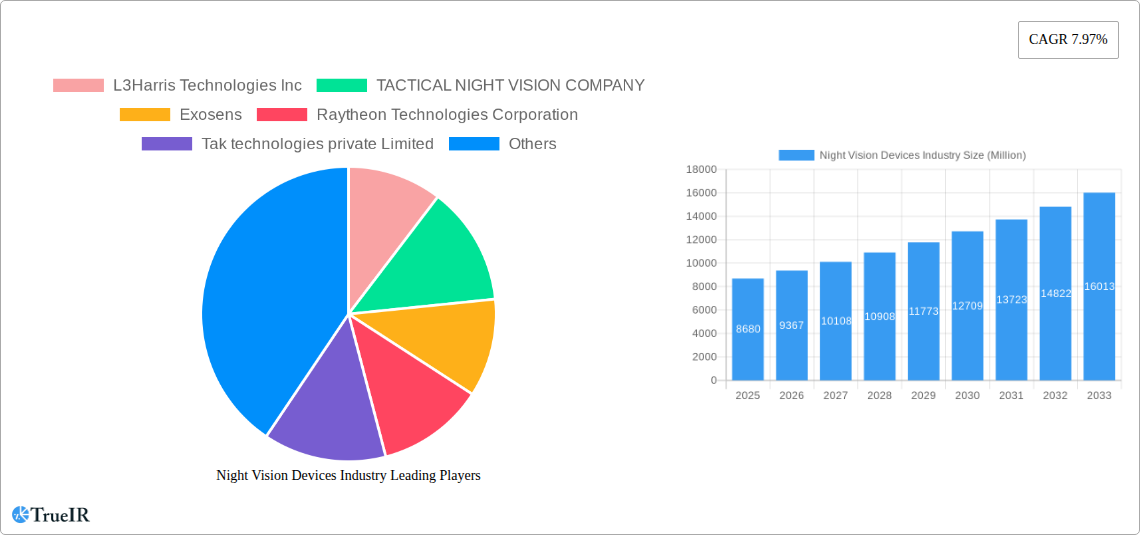
Night Vision Devices Industry Market Size (In Billion)
Despite these restraints, the market's future outlook remains positive. The increasing adoption of NVDs in civilian applications, like security and navigation, is expected to offset some of the limitations. Furthermore, ongoing research and development initiatives focused on miniaturization, enhanced power efficiency, and improved image processing are anticipated to unlock new market opportunities. Leading companies such as L3Harris Technologies, Raytheon Technologies, and FLIR are strategically investing in innovation and expansion to maintain their market leadership, while emerging players are aggressively challenging the established order. Geographic growth is likely to be strong in the Asia-Pacific region, driven by increased defense spending and rising consumer demand. The North American market is expected to maintain a significant share, owing to the robust presence of key players and advanced technology development.
Night Vision Devices Industry Company Market Share
Night Vision Devices Industry Market Report: 2019-2033
This comprehensive report offers an in-depth analysis of the global night vision devices market, providing invaluable insights for businesses, investors, and researchers. The study period covers 2019-2033, with 2025 as the base and estimated year. The forecast period spans 2025-2033, while the historical period encompasses 2019-2024. This report projects a market valued at xx Million by 2033, exhibiting a robust CAGR of xx% during the forecast period.
Night Vision Devices Industry Market Structure & Competitive Landscape
The night vision devices market is characterized by a moderately concentrated landscape, with a handful of major players holding significant market share. The Herfindahl-Hirschman Index (HHI) for this market is estimated at xx, indicating a moderately concentrated structure. Key drivers of innovation include advancements in sensor technology (e.g., improved thermal imaging and image intensification), miniaturization, and the integration of augmented reality (AR) and artificial intelligence (AI). Stringent regulatory frameworks governing the export and use of night vision devices, particularly in the defense sector, significantly impact market dynamics. Product substitutes are limited, with the primary alternative being enhanced low-light cameras; however, these often lack the performance capabilities of dedicated night vision systems.
End-user segmentation is heavily influenced by the military and defense sector, representing a substantial share of the market. However, significant growth is anticipated in the civilian sector, driven by applications in wildlife spotting, surveillance, and navigation. Mergers and acquisitions (M&A) activity has been moderate in recent years, with xx major deals recorded between 2019 and 2024. This activity is primarily driven by the desire to expand product portfolios, access new technologies, and enhance market presence.
- Market Concentration: Moderately Concentrated (HHI: xx)
- Innovation Drivers: Sensor technology advancements, miniaturization, AR/AI integration.
- Regulatory Impacts: Stringent export controls and usage regulations.
- Product Substitutes: Limited, primarily low-light cameras.
- End-User Segmentation: Dominated by Military & Defense, with growing civilian applications.
- M&A Trends: Moderate activity, focused on portfolio expansion and technological acquisition.
Night Vision Devices Industry Market Trends & Opportunities
The global night vision devices market is experiencing robust growth, fueled by escalating demand from both military and civilian sectors. The market size is projected to reach xx Million in 2025 and is anticipated to expand to xx Million by 2033, exhibiting a substantial CAGR. Technological advancements, including the development of higher-resolution thermal imaging, improved image intensifiers, and the integration of advanced features like AR and AI, are driving market expansion. Consumer preferences are shifting towards lightweight, compact devices with enhanced performance and improved user interfaces.
Competitive dynamics are intensifying, with established players focusing on innovation and product differentiation to maintain their market positions. The emergence of new entrants with specialized technologies further enhances competitive pressure. Market penetration is particularly high in developed nations, with significant growth potential in developing economies driven by increasing defense budgets and rising adoption in civilian applications.
Dominant Markets & Segments in Night Vision Devices Industry
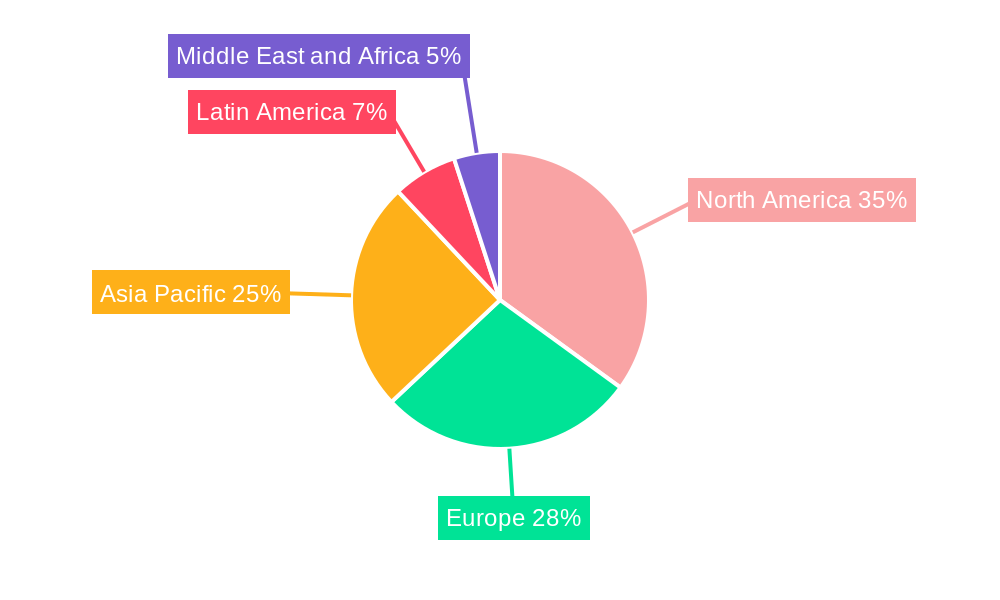
The North American market currently holds the dominant position in the night vision devices industry, primarily driven by robust defense spending and technological advancements. Europe follows closely, with significant contributions from countries with strong defense industries. Within the segment breakdown:
- By Type: Goggles and binocular night vision systems currently command the largest market share, driven by widespread military and civilian adoption. Rifle scopes represent a substantial niche market.
- By Technology: Thermal imaging is the fastest-growing technology segment, owing to its superior performance in various environmental conditions. Image intensifier technology remains a substantial portion of the market, offering a cost-effective solution for various applications.
- By Application: The military and defense sector is the largest consumer of night vision devices, followed by surveillance and wildlife observation.
Key Growth Drivers:
- Increased Military Spending: Significant investments in defense technologies across several regions.
- Technological Advancements: Development of higher-resolution, more compact, and user-friendly devices.
- Growing Civilian Applications: Increased demand in law enforcement, security, and outdoor recreation.
- Infrastructure Development: Expansion of surveillance networks and border security initiatives.
Night Vision Devices Industry Product Analysis
Recent innovations in night vision technology have focused on improving image quality, reducing size and weight, and integrating advanced features. Thermal imaging systems are becoming increasingly sophisticated, offering greater range and resolution. The integration of augmented reality (AR) and artificial intelligence (AI) capabilities enhances situational awareness and target identification. This technological advancement improves market fit, catering to both military and civilian needs by providing superior performance, enhanced usability, and integration with other systems.
Key Drivers, Barriers & Challenges in Night Vision Devices Industry
Key Drivers:
The market is driven by factors such as increasing defense spending, advancements in sensor technology, and growing civilian applications in various sectors. The demand for enhanced situational awareness in military operations and the expanding use of night vision in security and surveillance are significant contributors to market growth. Government regulations and policies in many countries incentivize the adoption of night vision devices, particularly for defense and homeland security.
Key Challenges and Restraints:
High manufacturing costs and the stringent regulatory environment related to the export and use of night vision devices pose significant challenges. Competition from low-cost manufacturers, especially in the Asian market, adds further pressure. Supply chain disruptions affecting the availability of critical components can severely impact production and delivery timelines. These factors can potentially constrain the growth of this industry in the coming years.
Growth Drivers in the Night Vision Devices Industry Market
Increased defense budgets globally, particularly in regions experiencing geopolitical instability, significantly fuel demand. Technological advancements, such as the integration of artificial intelligence for enhanced target identification and improved thermal imaging for better low-light performance, are driving adoption. The growing use of night vision technology in civilian applications, such as wildlife monitoring and enhanced security measures, contributes significantly to market expansion.
Challenges Impacting Night Vision Devices Industry Growth
Stringent export regulations and licensing requirements, particularly for military-grade night vision devices, can impede market access and restrict growth. Supply chain vulnerabilities, with reliance on specific materials and manufacturing processes, make the industry susceptible to disruptions. Intense competition among established players and the emergence of new entrants create pressure on pricing and profitability.
Key Players Shaping the Night Vision Devices Industry Market
- L3Harris Technologies Inc
- TACTICAL NIGHT VISION COMPANY
- Exosens
- Raytheon Technologies Corporation
- Tak technologies private Limited
- Satir
- nivisys LLC
- Excelitas Technologies Corp
- sharp Corporation
- Elibit Systems Ltd
- BAE Systems PLC
- EOTECH LLC
- Thales Group SA
- Opgal Optronic Industries Ltd
- Apresys International Inc
- Luna Optics Inc
- Panasonic Holding Corporation
- American Technologies Network Corp
- Bushnell Inc
- Teledyne FLIR LLC
Significant Night Vision Devices Industry Industry Milestones
- November 2023: Night Vision LLC (Elbit Systems of America) secures a USD 500 Million contract from the US Department of Defense for SBNVG systems.
- October 2023: Thermoteknix Systems launches the Fused Night Vision Goggle with Augmented Reality (FNVG-AR).
Future Outlook for Night Vision Devices Industry Market
The night vision devices market is poised for continued growth, propelled by sustained military spending, technological innovation, and expanding civilian applications. Strategic opportunities exist in developing advanced thermal imaging and image intensification technologies, integrating AR/AI capabilities, and expanding into emerging markets. The market is expected to witness significant growth in the coming years, driven by these factors and further innovation.
Night Vision Devices Industry Segmentation
-
1. Type
- 1.1. Camera
- 1.2. Goggles
- 1.3. Monoculars and Binoculars
- 1.4. Rifle Scope
- 1.5. Other Types
-
2. Technology
- 2.1. Thermal Imaging
- 2.2. Image Intensifier
- 2.3. Infrared Illumination
- 2.4. Other Technologies
-
3. Application
- 3.1. Military and Defense
- 3.2. Wildlife Spotting and Conservation
- 3.3. Surveillance
- 3.4. Navigation
- 3.5. Other Applications
Night Vision Devices Industry Segmentation By Geography
- 1. North America
- 2. Europe
- 3. Asia Pacific
- 4. Latin America
- 5. Middle East and Africa
Night Vision Devices Industry Regional Market Share
Geographic Coverage of Night Vision Devices Industry
Night Vision Devices Industry REPORT HIGHLIGHTS
| Aspects | Details |
|---|---|
| Study Period | 2020-2034 |
| Base Year | 2025 |
| Estimated Year | 2026 |
| Forecast Period | 2026-2034 |
| Historical Period | 2020-2025 |
| Growth Rate | CAGR of 7.97% from 2020-2034 |
| Segmentation |
|
Table of Contents
- 1. Introduction
- 1.1. Research Scope
- 1.2. Market Segmentation
- 1.3. Research Objective
- 1.4. Definitions and Assumptions
- 2. Executive Summary
- 2.1. Market Snapshot
- 3. Market Dynamics
- 3.1. Market Drivers
- 3.2. Market Restrains
- 3.3. Market Trends
- 3.4. Market Opportunities
- 4. Market Factor Analysis
- 4.1. Porters Five Forces
- 4.1.1. Bargaining Power of Suppliers
- 4.1.2. Bargaining Power of Buyers
- 4.1.3. Threat of New Entrants
- 4.1.4. Threat of Substitutes
- 4.1.5. Competitive Rivalry
- 4.2. PESTEL analysis
- 4.3. BCG Analysis
- 4.3.1. Stars (High Growth, High Market Share)
- 4.3.2. Cash Cows (Low Growth, High Market Share)
- 4.3.3. Question Mark (High Growth, Low Market Share)
- 4.3.4. Dogs (Low Growth, Low Market Share)
- 4.4. Ansoff Matrix Analysis
- 4.5. Supply Chain Analysis
- 4.6. Regulatory Landscape
- 4.7. Current Market Potential and Opportunity Assessment (TAM–SAM–SOM Framework)
- 4.8. TIR Analyst Note
- 4.1. Porters Five Forces
- 5. Market Analysis, Insights and Forecast 2021-2033
- 5.1. Market Analysis, Insights and Forecast - by Type
- 5.1.1. Camera
- 5.1.2. Goggles
- 5.1.3. Monoculars and Binoculars
- 5.1.4. Rifle Scope
- 5.1.5. Other Types
- 5.2. Market Analysis, Insights and Forecast - by Technology
- 5.2.1. Thermal Imaging
- 5.2.2. Image Intensifier
- 5.2.3. Infrared Illumination
- 5.2.4. Other Technologies
- 5.3. Market Analysis, Insights and Forecast - by Application
- 5.3.1. Military and Defense
- 5.3.2. Wildlife Spotting and Conservation
- 5.3.3. Surveillance
- 5.3.4. Navigation
- 5.3.5. Other Applications
- 5.4. Market Analysis, Insights and Forecast - by Region
- 5.4.1. North America
- 5.4.2. Europe
- 5.4.3. Asia Pacific
- 5.4.4. Latin America
- 5.4.5. Middle East and Africa
- 5.1. Market Analysis, Insights and Forecast - by Type
- 6. Global Night Vision Devices Industry Analysis, Insights and Forecast, 2021-2033
- 6.1. Market Analysis, Insights and Forecast - by Type
- 6.1.1. Camera
- 6.1.2. Goggles
- 6.1.3. Monoculars and Binoculars
- 6.1.4. Rifle Scope
- 6.1.5. Other Types
- 6.2. Market Analysis, Insights and Forecast - by Technology
- 6.2.1. Thermal Imaging
- 6.2.2. Image Intensifier
- 6.2.3. Infrared Illumination
- 6.2.4. Other Technologies
- 6.3. Market Analysis, Insights and Forecast - by Application
- 6.3.1. Military and Defense
- 6.3.2. Wildlife Spotting and Conservation
- 6.3.3. Surveillance
- 6.3.4. Navigation
- 6.3.5. Other Applications
- 6.1. Market Analysis, Insights and Forecast - by Type
- 7. North America Night Vision Devices Industry Analysis, Insights and Forecast, 2020-2032
- 7.1. Market Analysis, Insights and Forecast - by Type
- 7.1.1. Camera
- 7.1.2. Goggles
- 7.1.3. Monoculars and Binoculars
- 7.1.4. Rifle Scope
- 7.1.5. Other Types
- 7.2. Market Analysis, Insights and Forecast - by Technology
- 7.2.1. Thermal Imaging
- 7.2.2. Image Intensifier
- 7.2.3. Infrared Illumination
- 7.2.4. Other Technologies
- 7.3. Market Analysis, Insights and Forecast - by Application
- 7.3.1. Military and Defense
- 7.3.2. Wildlife Spotting and Conservation
- 7.3.3. Surveillance
- 7.3.4. Navigation
- 7.3.5. Other Applications
- 7.1. Market Analysis, Insights and Forecast - by Type
- 8. Europe Night Vision Devices Industry Analysis, Insights and Forecast, 2020-2032
- 8.1. Market Analysis, Insights and Forecast - by Type
- 8.1.1. Camera
- 8.1.2. Goggles
- 8.1.3. Monoculars and Binoculars
- 8.1.4. Rifle Scope
- 8.1.5. Other Types
- 8.2. Market Analysis, Insights and Forecast - by Technology
- 8.2.1. Thermal Imaging
- 8.2.2. Image Intensifier
- 8.2.3. Infrared Illumination
- 8.2.4. Other Technologies
- 8.3. Market Analysis, Insights and Forecast - by Application
- 8.3.1. Military and Defense
- 8.3.2. Wildlife Spotting and Conservation
- 8.3.3. Surveillance
- 8.3.4. Navigation
- 8.3.5. Other Applications
- 8.1. Market Analysis, Insights and Forecast - by Type
- 9. Asia Pacific Night Vision Devices Industry Analysis, Insights and Forecast, 2020-2032
- 9.1. Market Analysis, Insights and Forecast - by Type
- 9.1.1. Camera
- 9.1.2. Goggles
- 9.1.3. Monoculars and Binoculars
- 9.1.4. Rifle Scope
- 9.1.5. Other Types
- 9.2. Market Analysis, Insights and Forecast - by Technology
- 9.2.1. Thermal Imaging
- 9.2.2. Image Intensifier
- 9.2.3. Infrared Illumination
- 9.2.4. Other Technologies
- 9.3. Market Analysis, Insights and Forecast - by Application
- 9.3.1. Military and Defense
- 9.3.2. Wildlife Spotting and Conservation
- 9.3.3. Surveillance
- 9.3.4. Navigation
- 9.3.5. Other Applications
- 9.1. Market Analysis, Insights and Forecast - by Type
- 10. Latin America Night Vision Devices Industry Analysis, Insights and Forecast, 2020-2032
- 10.1. Market Analysis, Insights and Forecast - by Type
- 10.1.1. Camera
- 10.1.2. Goggles
- 10.1.3. Monoculars and Binoculars
- 10.1.4. Rifle Scope
- 10.1.5. Other Types
- 10.2. Market Analysis, Insights and Forecast - by Technology
- 10.2.1. Thermal Imaging
- 10.2.2. Image Intensifier
- 10.2.3. Infrared Illumination
- 10.2.4. Other Technologies
- 10.3. Market Analysis, Insights and Forecast - by Application
- 10.3.1. Military and Defense
- 10.3.2. Wildlife Spotting and Conservation
- 10.3.3. Surveillance
- 10.3.4. Navigation
- 10.3.5. Other Applications
- 10.1. Market Analysis, Insights and Forecast - by Type
- 11. Middle East and Africa Night Vision Devices Industry Analysis, Insights and Forecast, 2020-2032
- 11.1. Market Analysis, Insights and Forecast - by Type
- 11.1.1. Camera
- 11.1.2. Goggles
- 11.1.3. Monoculars and Binoculars
- 11.1.4. Rifle Scope
- 11.1.5. Other Types
- 11.2. Market Analysis, Insights and Forecast - by Technology
- 11.2.1. Thermal Imaging
- 11.2.2. Image Intensifier
- 11.2.3. Infrared Illumination
- 11.2.4. Other Technologies
- 11.3. Market Analysis, Insights and Forecast - by Application
- 11.3.1. Military and Defense
- 11.3.2. Wildlife Spotting and Conservation
- 11.3.3. Surveillance
- 11.3.4. Navigation
- 11.3.5. Other Applications
- 11.1. Market Analysis, Insights and Forecast - by Type
- 12. Competitive Analysis
- 12.1. Company Profiles
- 12.1.1 L3Harris Technologies Inc
- 12.1.1.1. Company Overview
- 12.1.1.2. Products
- 12.1.1.3. Company Financials
- 12.1.1.4. SWOT Analysis
- 12.1.2 TACTICAL NIGHT VISION COMPANY
- 12.1.2.1. Company Overview
- 12.1.2.2. Products
- 12.1.2.3. Company Financials
- 12.1.2.4. SWOT Analysis
- 12.1.3 Exosens
- 12.1.3.1. Company Overview
- 12.1.3.2. Products
- 12.1.3.3. Company Financials
- 12.1.3.4. SWOT Analysis
- 12.1.4 Raytheon Technologies Corporation
- 12.1.4.1. Company Overview
- 12.1.4.2. Products
- 12.1.4.3. Company Financials
- 12.1.4.4. SWOT Analysis
- 12.1.5 Tak technologies private Limited
- 12.1.5.1. Company Overview
- 12.1.5.2. Products
- 12.1.5.3. Company Financials
- 12.1.5.4. SWOT Analysis
- 12.1.6 Satir
- 12.1.6.1. Company Overview
- 12.1.6.2. Products
- 12.1.6.3. Company Financials
- 12.1.6.4. SWOT Analysis
- 12.1.7 nivisys LLC
- 12.1.7.1. Company Overview
- 12.1.7.2. Products
- 12.1.7.3. Company Financials
- 12.1.7.4. SWOT Analysis
- 12.1.8 Excelitas Technologies Corp
- 12.1.8.1. Company Overview
- 12.1.8.2. Products
- 12.1.8.3. Company Financials
- 12.1.8.4. SWOT Analysis
- 12.1.9 sharp Corporation
- 12.1.9.1. Company Overview
- 12.1.9.2. Products
- 12.1.9.3. Company Financials
- 12.1.9.4. SWOT Analysis
- 12.1.10 Elibit Systems Ltd
- 12.1.10.1. Company Overview
- 12.1.10.2. Products
- 12.1.10.3. Company Financials
- 12.1.10.4. SWOT Analysis
- 12.1.11 BAE Systems PLC
- 12.1.11.1. Company Overview
- 12.1.11.2. Products
- 12.1.11.3. Company Financials
- 12.1.11.4. SWOT Analysis
- 12.1.12 EOTECH LLC
- 12.1.12.1. Company Overview
- 12.1.12.2. Products
- 12.1.12.3. Company Financials
- 12.1.12.4. SWOT Analysis
- 12.1.13 Thales Group SA
- 12.1.13.1. Company Overview
- 12.1.13.2. Products
- 12.1.13.3. Company Financials
- 12.1.13.4. SWOT Analysis
- 12.1.14 Opgal Optronic Industries Ltd
- 12.1.14.1. Company Overview
- 12.1.14.2. Products
- 12.1.14.3. Company Financials
- 12.1.14.4. SWOT Analysis
- 12.1.15 Apresys International Inc
- 12.1.15.1. Company Overview
- 12.1.15.2. Products
- 12.1.15.3. Company Financials
- 12.1.15.4. SWOT Analysis
- 12.1.16 Luna Optics Inc
- 12.1.16.1. Company Overview
- 12.1.16.2. Products
- 12.1.16.3. Company Financials
- 12.1.16.4. SWOT Analysis
- 12.1.17 Panasonic Holding Corporation
- 12.1.17.1. Company Overview
- 12.1.17.2. Products
- 12.1.17.3. Company Financials
- 12.1.17.4. SWOT Analysis
- 12.1.18 American Technologies Network Corp
- 12.1.18.1. Company Overview
- 12.1.18.2. Products
- 12.1.18.3. Company Financials
- 12.1.18.4. SWOT Analysis
- 12.1.19 Bushnell Inc
- 12.1.19.1. Company Overview
- 12.1.19.2. Products
- 12.1.19.3. Company Financials
- 12.1.19.4. SWOT Analysis
- 12.1.20 Teledyne FLIR LLC
- 12.1.20.1. Company Overview
- 12.1.20.2. Products
- 12.1.20.3. Company Financials
- 12.1.20.4. SWOT Analysis
- 12.1.1 L3Harris Technologies Inc
- 12.2. Market Entropy
- 12.2.1 Company's Key Areas Served
- 12.2.2 Recent Developments
- 12.3. Company Market Share Analysis 2025
- 12.3.1 Top 5 Companies Market Share Analysis
- 12.3.2 Top 3 Companies Market Share Analysis
- 12.4. List of Potential Customers
- 13. Research Methodology
List of Figures
- Figure 1: Global Night Vision Devices Industry Revenue Breakdown (Million, %) by Region 2025 & 2033
- Figure 2: North America Night Vision Devices Industry Revenue (Million), by Type 2025 & 2033
- Figure 3: North America Night Vision Devices Industry Revenue Share (%), by Type 2025 & 2033
- Figure 4: North America Night Vision Devices Industry Revenue (Million), by Technology 2025 & 2033
- Figure 5: North America Night Vision Devices Industry Revenue Share (%), by Technology 2025 & 2033
- Figure 6: North America Night Vision Devices Industry Revenue (Million), by Application 2025 & 2033
- Figure 7: North America Night Vision Devices Industry Revenue Share (%), by Application 2025 & 2033
- Figure 8: North America Night Vision Devices Industry Revenue (Million), by Country 2025 & 2033
- Figure 9: North America Night Vision Devices Industry Revenue Share (%), by Country 2025 & 2033
- Figure 10: Europe Night Vision Devices Industry Revenue (Million), by Type 2025 & 2033
- Figure 11: Europe Night Vision Devices Industry Revenue Share (%), by Type 2025 & 2033
- Figure 12: Europe Night Vision Devices Industry Revenue (Million), by Technology 2025 & 2033
- Figure 13: Europe Night Vision Devices Industry Revenue Share (%), by Technology 2025 & 2033
- Figure 14: Europe Night Vision Devices Industry Revenue (Million), by Application 2025 & 2033
- Figure 15: Europe Night Vision Devices Industry Revenue Share (%), by Application 2025 & 2033
- Figure 16: Europe Night Vision Devices Industry Revenue (Million), by Country 2025 & 2033
- Figure 17: Europe Night Vision Devices Industry Revenue Share (%), by Country 2025 & 2033
- Figure 18: Asia Pacific Night Vision Devices Industry Revenue (Million), by Type 2025 & 2033
- Figure 19: Asia Pacific Night Vision Devices Industry Revenue Share (%), by Type 2025 & 2033
- Figure 20: Asia Pacific Night Vision Devices Industry Revenue (Million), by Technology 2025 & 2033
- Figure 21: Asia Pacific Night Vision Devices Industry Revenue Share (%), by Technology 2025 & 2033
- Figure 22: Asia Pacific Night Vision Devices Industry Revenue (Million), by Application 2025 & 2033
- Figure 23: Asia Pacific Night Vision Devices Industry Revenue Share (%), by Application 2025 & 2033
- Figure 24: Asia Pacific Night Vision Devices Industry Revenue (Million), by Country 2025 & 2033
- Figure 25: Asia Pacific Night Vision Devices Industry Revenue Share (%), by Country 2025 & 2033
- Figure 26: Latin America Night Vision Devices Industry Revenue (Million), by Type 2025 & 2033
- Figure 27: Latin America Night Vision Devices Industry Revenue Share (%), by Type 2025 & 2033
- Figure 28: Latin America Night Vision Devices Industry Revenue (Million), by Technology 2025 & 2033
- Figure 29: Latin America Night Vision Devices Industry Revenue Share (%), by Technology 2025 & 2033
- Figure 30: Latin America Night Vision Devices Industry Revenue (Million), by Application 2025 & 2033
- Figure 31: Latin America Night Vision Devices Industry Revenue Share (%), by Application 2025 & 2033
- Figure 32: Latin America Night Vision Devices Industry Revenue (Million), by Country 2025 & 2033
- Figure 33: Latin America Night Vision Devices Industry Revenue Share (%), by Country 2025 & 2033
- Figure 34: Middle East and Africa Night Vision Devices Industry Revenue (Million), by Type 2025 & 2033
- Figure 35: Middle East and Africa Night Vision Devices Industry Revenue Share (%), by Type 2025 & 2033
- Figure 36: Middle East and Africa Night Vision Devices Industry Revenue (Million), by Technology 2025 & 2033
- Figure 37: Middle East and Africa Night Vision Devices Industry Revenue Share (%), by Technology 2025 & 2033
- Figure 38: Middle East and Africa Night Vision Devices Industry Revenue (Million), by Application 2025 & 2033
- Figure 39: Middle East and Africa Night Vision Devices Industry Revenue Share (%), by Application 2025 & 2033
- Figure 40: Middle East and Africa Night Vision Devices Industry Revenue (Million), by Country 2025 & 2033
- Figure 41: Middle East and Africa Night Vision Devices Industry Revenue Share (%), by Country 2025 & 2033
List of Tables
- Table 1: Global Night Vision Devices Industry Revenue Million Forecast, by Type 2020 & 2033
- Table 2: Global Night Vision Devices Industry Revenue Million Forecast, by Technology 2020 & 2033
- Table 3: Global Night Vision Devices Industry Revenue Million Forecast, by Application 2020 & 2033
- Table 4: Global Night Vision Devices Industry Revenue Million Forecast, by Region 2020 & 2033
- Table 5: Global Night Vision Devices Industry Revenue Million Forecast, by Type 2020 & 2033
- Table 6: Global Night Vision Devices Industry Revenue Million Forecast, by Technology 2020 & 2033
- Table 7: Global Night Vision Devices Industry Revenue Million Forecast, by Application 2020 & 2033
- Table 8: Global Night Vision Devices Industry Revenue Million Forecast, by Country 2020 & 2033
- Table 9: Global Night Vision Devices Industry Revenue Million Forecast, by Type 2020 & 2033
- Table 10: Global Night Vision Devices Industry Revenue Million Forecast, by Technology 2020 & 2033
- Table 11: Global Night Vision Devices Industry Revenue Million Forecast, by Application 2020 & 2033
- Table 12: Global Night Vision Devices Industry Revenue Million Forecast, by Country 2020 & 2033
- Table 13: Global Night Vision Devices Industry Revenue Million Forecast, by Type 2020 & 2033
- Table 14: Global Night Vision Devices Industry Revenue Million Forecast, by Technology 2020 & 2033
- Table 15: Global Night Vision Devices Industry Revenue Million Forecast, by Application 2020 & 2033
- Table 16: Global Night Vision Devices Industry Revenue Million Forecast, by Country 2020 & 2033
- Table 17: Global Night Vision Devices Industry Revenue Million Forecast, by Type 2020 & 2033
- Table 18: Global Night Vision Devices Industry Revenue Million Forecast, by Technology 2020 & 2033
- Table 19: Global Night Vision Devices Industry Revenue Million Forecast, by Application 2020 & 2033
- Table 20: Global Night Vision Devices Industry Revenue Million Forecast, by Country 2020 & 2033
- Table 21: Global Night Vision Devices Industry Revenue Million Forecast, by Type 2020 & 2033
- Table 22: Global Night Vision Devices Industry Revenue Million Forecast, by Technology 2020 & 2033
- Table 23: Global Night Vision Devices Industry Revenue Million Forecast, by Application 2020 & 2033
- Table 24: Global Night Vision Devices Industry Revenue Million Forecast, by Country 2020 & 2033
Frequently Asked Questions
1. What is the projected Compound Annual Growth Rate (CAGR) of the Night Vision Devices Industry?
The projected CAGR is approximately 7.97%.
2. Which companies are prominent players in the Night Vision Devices Industry?
Key companies in the market include L3Harris Technologies Inc, TACTICAL NIGHT VISION COMPANY, Exosens, Raytheon Technologies Corporation, Tak technologies private Limited, Satir, nivisys LLC, Excelitas Technologies Corp, sharp Corporation, Elibit Systems Ltd, BAE Systems PLC, EOTECH LLC, Thales Group SA, Opgal Optronic Industries Ltd, Apresys International Inc, Luna Optics Inc, Panasonic Holding Corporation, American Technologies Network Corp, Bushnell Inc, Teledyne FLIR LLC.
3. What are the main segments of the Night Vision Devices Industry?
The market segments include Type, Technology, Application.
4. Can you provide details about the market size?
The market size is estimated to be USD 8.68 Million as of 2022.
5. What are some drivers contributing to market growth?
Increasing Military Expenditure; Increasing Adoption from Law Enforcement.
6. What are the notable trends driving market growth?
Surveillance Applications to Hold Significant Share.
7. Are there any restraints impacting market growth?
High Costs Associated with Maintenance.
8. Can you provide examples of recent developments in the market?
November 2023 - Night Vision LLC, a subsidiary of Elbit Systems of America, announced that it secured USD 500 million from the US Department of Defense to enhance the US Marine Corps’ efficiency with the supply of Squad Binocular Night Vision Goggle (SBNVG) systems. The contract is expected to be completed by 2028, aiming to equip the Marines with technology for nighttime situational awareness, with work to be executed in Roanoke, Virginia.
9. What pricing options are available for accessing the report?
Pricing options include single-user, multi-user, and enterprise licenses priced at USD 4750, USD 5250, and USD 8750 respectively.
10. Is the market size provided in terms of value or volume?
The market size is provided in terms of value, measured in Million.
11. Are there any specific market keywords associated with the report?
Yes, the market keyword associated with the report is "Night Vision Devices Industry," which aids in identifying and referencing the specific market segment covered.
12. How do I determine which pricing option suits my needs best?
The pricing options vary based on user requirements and access needs. Individual users may opt for single-user licenses, while businesses requiring broader access may choose multi-user or enterprise licenses for cost-effective access to the report.
13. Are there any additional resources or data provided in the Night Vision Devices Industry report?
While the report offers comprehensive insights, it's advisable to review the specific contents or supplementary materials provided to ascertain if additional resources or data are available.
14. How can I stay updated on further developments or reports in the Night Vision Devices Industry?
To stay informed about further developments, trends, and reports in the Night Vision Devices Industry, consider subscribing to industry newsletters, following relevant companies and organizations, or regularly checking reputable industry news sources and publications.
Methodology
Step 1 - Identification of Relevant Samples Size from Population Database


Step 2 - Approaches for Defining Global Market Size (Value, Volume* & Price*)

Note*: In applicable scenarios
Step 3 - Data Sources
Primary Research
- Web Analytics
- Survey Reports
- Research Institute
- Latest Research Reports
- Opinion Leaders
Secondary Research
- Annual Reports
- White Paper
- Latest Press Release
- Industry Association
- Paid Database
- Investor Presentations

Step 4 - Data Triangulation
Involves using different sources of information in order to increase the validity of a study
These sources are likely to be stakeholders in a program - participants, other researchers, program staff, other community members, and so on.
Then we put all data in single framework & apply various statistical tools to find out the dynamic on the market.
During the analysis stage, feedback from the stakeholder groups would be compared to determine areas of agreement as well as areas of divergence