

Key Insights
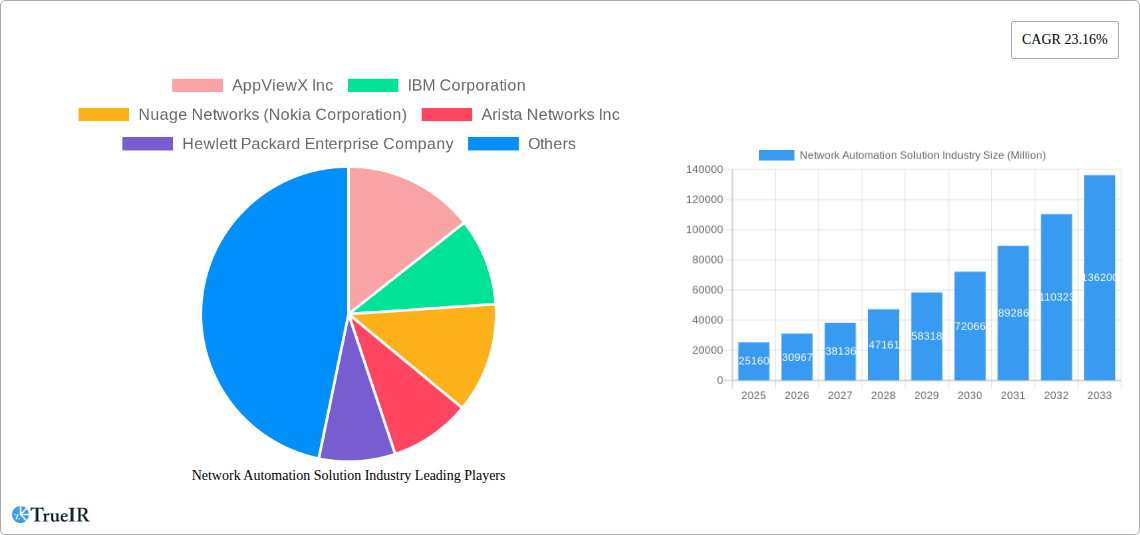
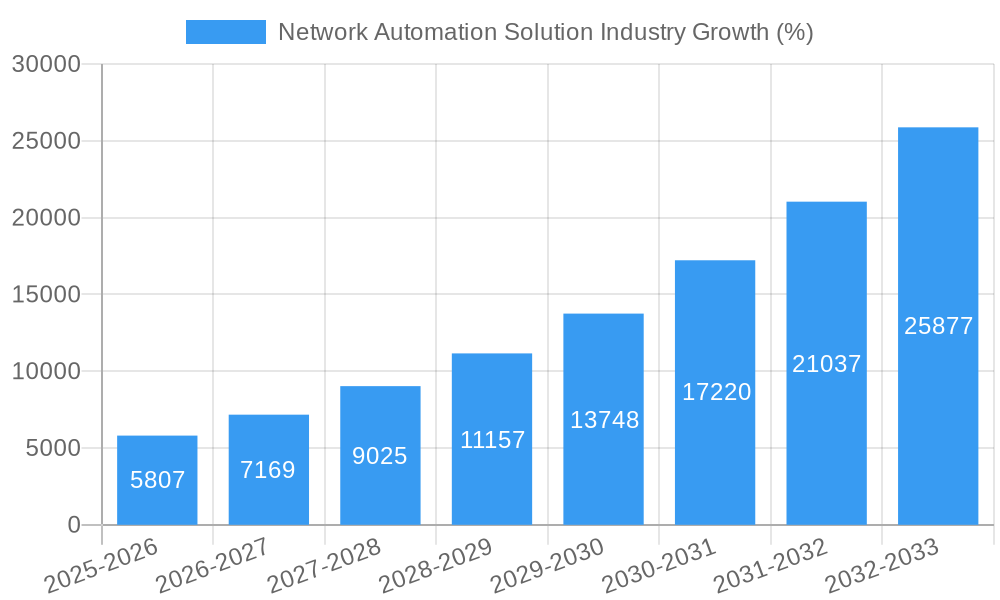
The Network Automation Solutions market is experiencing robust growth, projected to reach \$25.16 billion in 2025 and exhibiting a Compound Annual Growth Rate (CAGR) of 23.16% from 2025 to 2033. This expansion is driven by several key factors. Firstly, the increasing complexity of network infrastructure, coupled with the rising adoption of cloud computing and multi-cloud strategies, necessitates automation for efficient management and reduced operational costs. Secondly, the surge in digital transformation initiatives across various sectors – including IT and Telecom, Manufacturing, Banking, and Energy – is fueling demand for automated solutions to streamline network operations and enhance security. Furthermore, the emergence of intent-based networking and advancements in Artificial Intelligence (AI) and Machine Learning (ML) are significantly boosting the market's growth trajectory, enabling more intelligent and proactive network management. The market is segmented by component (solution type, service type), deployment (cloud, on-premise, hybrid), end-user industry, and network type (physical, virtual, hybrid). While cloud-based deployments are gaining traction due to scalability and cost-effectiveness, on-premise solutions still maintain significant market share due to existing infrastructure and security concerns. Competition is intense, with key players like Cisco, IBM, Juniper Networks, and others vying for market dominance through innovation and strategic partnerships.
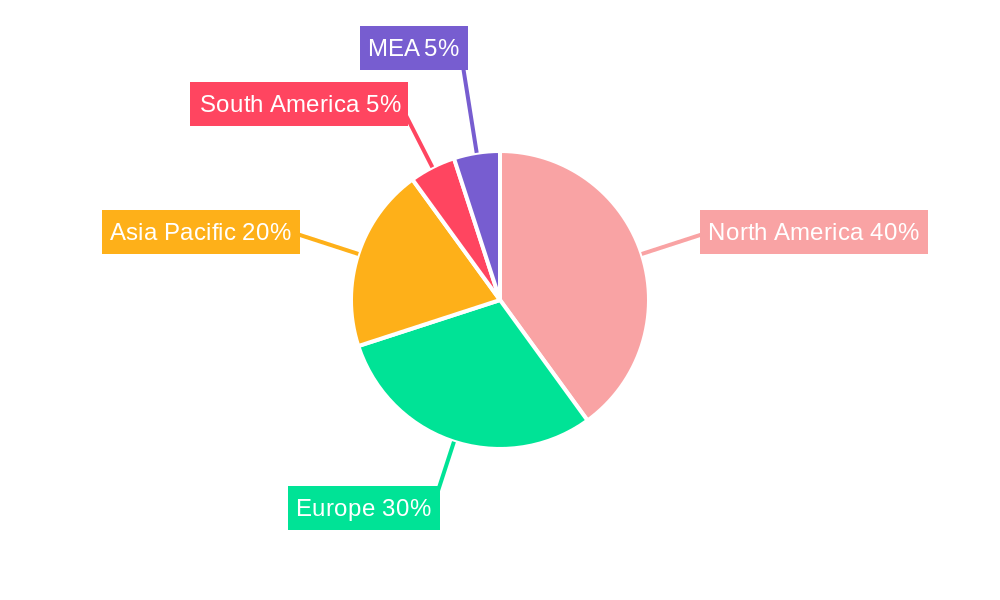
Geographical distribution reflects a mature North American market alongside strong growth potential in Asia-Pacific and other emerging regions. The substantial investment in digital infrastructure and the increasing adoption of advanced networking technologies in these regions are primary catalysts for their expansion. However, challenges such as integration complexities, security concerns related to automation, and the need for skilled workforce to manage these automated systems pose potential restraints to market growth. Nonetheless, the overall outlook for the Network Automation Solutions market remains highly positive, driven by the continued adoption of digital technologies and the imperative for businesses to optimize network efficiency and security. The forecast period of 2025-2033 anticipates sustained high growth, making it an attractive market for investment and innovation.
Network Automation Solution Industry Market Report: 2019-2033
This comprehensive report provides a detailed analysis of the Network Automation Solution industry, projecting a market valued at $XX Million by 2033. Leveraging data from 2019-2024 (Historical Period), with 2025 as the Base and Estimated Year, and forecasting to 2033 (Forecast Period), this report is an indispensable resource for businesses and investors navigating this rapidly evolving landscape.
Network Automation Solution Industry Market Structure & Competitive Landscape
The Network Automation Solution market is characterized by a moderately concentrated structure, with several major players commanding significant market share. Key players include IBM Corporation, Cisco Systems Inc, Juniper Networks Inc, Arista Networks Inc, and Hewlett Packard Enterprise Company, among others. The Herfindahl-Hirschman Index (HHI) is estimated at xx, suggesting a moderately competitive environment. However, the market is witnessing increasing consolidation through mergers and acquisitions (M&A). The total M&A volume in the sector from 2019 to 2024 was approximately $XX Million, indicating a trend toward larger players acquiring smaller, specialized companies.
Innovation is a crucial driver, with continuous advancements in software-defined networking (SDN), network function virtualization (NFV), and artificial intelligence (AI) fueling market growth. Regulatory landscapes vary across different geographies, impacting market access and adoption rates. Product substitutes, such as manual network management practices, are gradually becoming less prevalent due to the increasing complexity and scale of modern networks.
End-user segmentation significantly shapes market demand, with IT and Telecom, Banking and Financial Services, and Manufacturing sectors exhibiting strong adoption rates. M&A activity is largely driven by the need for companies to expand their product portfolios, enhance technological capabilities, and reach broader customer bases. This is further influenced by the desire to secure a larger share of the growing market for cloud-based network automation solutions.
Network Automation Solution Industry Market Trends & Opportunities
The Network Automation Solution market is experiencing robust growth, with a projected Compound Annual Growth Rate (CAGR) of xx% during the forecast period (2025-2033). This growth is primarily driven by the increasing adoption of cloud computing, the rising demand for improved network agility and efficiency, and the growing need for enhanced network security. Market penetration rates are steadily increasing, particularly in developed economies, where businesses are rapidly adopting advanced networking technologies.
Technological advancements, such as the integration of AI and machine learning, are transforming network automation solutions. This translates to improved network optimization, predictive maintenance, and automated troubleshooting, significantly boosting operational efficiency and reducing downtime. Consumer preferences are shifting toward cloud-based, scalable, and secure solutions, leading to increased demand for these types of offerings. Furthermore, the growing integration of IoT devices necessitates robust network automation capabilities to manage the increasing volume of data and devices. Competitive dynamics are characterized by a mix of established players and innovative startups, resulting in a highly dynamic market environment.
Dominant Markets & Segments in Network Automation Solution Industry
- By Component: The Solution Type segment dominates, followed by Intent-based Networking Service Type. Growth is driven by the need for comprehensive solutions encompassing various network management functions.
- By Deployment: Cloud-based deployments are experiencing the highest growth rate, driven by scalability, flexibility, and cost-effectiveness. On-premise solutions still hold a significant market share, particularly in industries with stringent security and compliance requirements.
- By End-user Industry: The IT and Telecom sector is currently the leading segment, followed by the Banking and Financial Services sector. High adoption rates are driven by these industries' critical reliance on robust and efficient network infrastructure. Growth drivers include the need for increased security and compliance, and the adoption of cloud-based solutions. The Manufacturing sector is also exhibiting significant growth due to the increasing automation of industrial processes.
- By Network Type: The Hybrid Network Type segment is showing strong growth due to the increasing integration of physical and virtual networks.
The North American region currently holds the largest market share, driven by high technological adoption rates and strong investments in network infrastructure. However, Asia-Pacific is poised for significant growth in the coming years, fueled by increasing digitalization and rapid economic development.
Network Automation Solution Industry Product Analysis
Recent product innovations focus on enhanced scalability, AI-driven intelligence, and seamless integration with existing network infrastructure. These advancements offer significant competitive advantages, including improved operational efficiency, reduced costs, and enhanced security. The market fit is strong, particularly for organizations seeking to optimize their network operations and improve their agility in a rapidly changing technological landscape. A key trend is the shift towards integrated platforms that offer a holistic solution for network management and automation.
Key Drivers, Barriers & Challenges in Network Automation Solution Industry
Key Drivers: The rapid growth of cloud computing, the increasing complexity of network infrastructure, and the growing demand for enhanced security and efficiency are driving the market. Government initiatives promoting digital transformation are further accelerating adoption.
Key Challenges: High initial investment costs, integration complexities, and a shortage of skilled professionals can hinder market growth. Supply chain disruptions can also impact the availability of components, resulting in delays and increased costs. Regulatory hurdles, particularly concerning data privacy and security, are also a significant concern. The estimated impact of these challenges on market growth is approximately xx% reduction in projected CAGR.
Growth Drivers in the Network Automation Solution Industry Market
Technological advancements, particularly in AI and machine learning, are driving significant growth. The increasing demand for cloud-based network solutions, coupled with government initiatives promoting digital transformation, are also strong growth factors. Economic factors, such as the need for increased operational efficiency and cost reduction, are further fueling market expansion.
Challenges Impacting Network Automation Solution Industry Growth
Regulatory complexities surrounding data privacy and security, supply chain disruptions impacting component availability, and intense competition among established and emerging players are key challenges. These factors can result in increased implementation costs and delays in project deployment.
Key Players Shaping the Network Automation Solution Industry Market
- AppViewX Inc
- IBM Corporation
- Nuage Networks (Nokia Corporation)
- Arista Networks Inc
- Hewlett Packard Enterprise Company
- Cisco Systems Inc
- Broadcom Inc
- Fujitsu Limited
- Juniper Networks Inc
- BMC Software Inc
- Extreme Networks Inc
- NetBrain Technologies Inc
- Forward Networks Inc
- Solarwinds Corporation
- Open Text Corporation
- Fortra LLC
Significant Network Automation Solution Industry Milestones
- March 2024: Arista announced CloudVision Universal Network Observability (CV UNO), a premium feature on Arista CloudVision, enhancing network automation and application visibility. This launch significantly impacted the market by strengthening Arista's position in the network observability segment.
- March 2024: Nokia enhanced its WaveSuite optical network automation platform, addressing the need for increased bandwidth and reliability. This upgrade provided customers with enhanced network visibility and management capabilities, boosting Nokia's competitive edge.
Future Outlook for Network Automation Solution Industry Market
The Network Automation Solution market is poised for continued strong growth, driven by ongoing technological advancements, increasing digitalization across various sectors, and the growing need for secure and efficient network operations. Strategic opportunities lie in the development of AI-powered solutions, enhanced integration capabilities, and expansion into emerging markets. The market potential is substantial, particularly in sectors such as healthcare, transportation, and smart cities, which are increasingly reliant on robust network infrastructure.
Network Automation Solution Industry Segmentation
-
1. Network Type
- 1.1. Physical
- 1.2. Virtual
- 1.3. Hybrid
-
2. Component
-
2.1. Solution Type
- 2.1.1. Network Automation Tools
- 2.1.2. SD-WAN and Network Virtualization
- 2.1.3. Intent-based Networking
-
2.2. Service Type
- 2.2.1. Managed Service
- 2.2.2. Professional Service
-
2.1. Solution Type
-
3. Deployment
- 3.1. Cloud
- 3.2. On-premise
- 3.3. Hybrid
-
4. End-user Industry
- 4.1. IT and Telecom
- 4.2. Manufacturing
- 4.3. Energy and Utility
- 4.4. Banking and Financial Services
- 4.5. Education
- 4.6. Other End-user Industries
Network Automation Solution Industry Segmentation By Geography
- 1. North America
- 2. Europe
- 3. Asia
- 4. Australia and New Zealand
- 5. Latin America
- 6. Middle East and Africa
Network Automation Solution Industry REPORT HIGHLIGHTS
| Aspects | Details |
|---|---|
| Study Period | 2019-2033 |
| Base Year | 2024 |
| Estimated Year | 2025 |
| Forecast Period | 2025-2033 |
| Historical Period | 2019-2024 |
| Growth Rate | CAGR of 23.16% from 2019-2033 |
| Segmentation |
|
Table of Contents
- 1. Introduction
- 1.1. Research Scope
- 1.2. Market Segmentation
- 1.3. Research Methodology
- 1.4. Definitions and Assumptions
- 2. Executive Summary
- 2.1. Introduction
- 3. Market Dynamics
- 3.1. Introduction
- 3.2. Market Drivers
- 3.2.1. Increasing Demand for Data Center Network; Rising Trend of Connected Devices
- 3.3. Market Restrains
- 3.3.1. Lack of Skilled Professional Across Industries
- 3.4. Market Trends
- 3.4.1. IT and Telecom End-user Industry is Expected to Hold Significant Market Share
- 4. Market Factor Analysis
- 4.1. Porters Five Forces
- 4.2. Supply/Value Chain
- 4.3. PESTEL analysis
- 4.4. Market Entropy
- 4.5. Patent/Trademark Analysis
- 5. Global Network Automation Solution Industry Analysis, Insights and Forecast, 2019-2031
- 5.1. Market Analysis, Insights and Forecast - by Network Type
- 5.1.1. Physical
- 5.1.2. Virtual
- 5.1.3. Hybrid
- 5.2. Market Analysis, Insights and Forecast - by Component
- 5.2.1. Solution Type
- 5.2.1.1. Network Automation Tools
- 5.2.1.2. SD-WAN and Network Virtualization
- 5.2.1.3. Intent-based Networking
- 5.2.2. Service Type
- 5.2.2.1. Managed Service
- 5.2.2.2. Professional Service
- 5.2.1. Solution Type
- 5.3. Market Analysis, Insights and Forecast - by Deployment
- 5.3.1. Cloud
- 5.3.2. On-premise
- 5.3.3. Hybrid
- 5.4. Market Analysis, Insights and Forecast - by End-user Industry
- 5.4.1. IT and Telecom
- 5.4.2. Manufacturing
- 5.4.3. Energy and Utility
- 5.4.4. Banking and Financial Services
- 5.4.5. Education
- 5.4.6. Other End-user Industries
- 5.5. Market Analysis, Insights and Forecast - by Region
- 5.5.1. North America
- 5.5.2. Europe
- 5.5.3. Asia
- 5.5.4. Australia and New Zealand
- 5.5.5. Latin America
- 5.5.6. Middle East and Africa
- 5.1. Market Analysis, Insights and Forecast - by Network Type
- 6. North America Network Automation Solution Industry Analysis, Insights and Forecast, 2019-2031
- 6.1. Market Analysis, Insights and Forecast - by Network Type
- 6.1.1. Physical
- 6.1.2. Virtual
- 6.1.3. Hybrid
- 6.2. Market Analysis, Insights and Forecast - by Component
- 6.2.1. Solution Type
- 6.2.1.1. Network Automation Tools
- 6.2.1.2. SD-WAN and Network Virtualization
- 6.2.1.3. Intent-based Networking
- 6.2.2. Service Type
- 6.2.2.1. Managed Service
- 6.2.2.2. Professional Service
- 6.2.1. Solution Type
- 6.3. Market Analysis, Insights and Forecast - by Deployment
- 6.3.1. Cloud
- 6.3.2. On-premise
- 6.3.3. Hybrid
- 6.4. Market Analysis, Insights and Forecast - by End-user Industry
- 6.4.1. IT and Telecom
- 6.4.2. Manufacturing
- 6.4.3. Energy and Utility
- 6.4.4. Banking and Financial Services
- 6.4.5. Education
- 6.4.6. Other End-user Industries
- 6.1. Market Analysis, Insights and Forecast - by Network Type
- 7. Europe Network Automation Solution Industry Analysis, Insights and Forecast, 2019-2031
- 7.1. Market Analysis, Insights and Forecast - by Network Type
- 7.1.1. Physical
- 7.1.2. Virtual
- 7.1.3. Hybrid
- 7.2. Market Analysis, Insights and Forecast - by Component
- 7.2.1. Solution Type
- 7.2.1.1. Network Automation Tools
- 7.2.1.2. SD-WAN and Network Virtualization
- 7.2.1.3. Intent-based Networking
- 7.2.2. Service Type
- 7.2.2.1. Managed Service
- 7.2.2.2. Professional Service
- 7.2.1. Solution Type
- 7.3. Market Analysis, Insights and Forecast - by Deployment
- 7.3.1. Cloud
- 7.3.2. On-premise
- 7.3.3. Hybrid
- 7.4. Market Analysis, Insights and Forecast - by End-user Industry
- 7.4.1. IT and Telecom
- 7.4.2. Manufacturing
- 7.4.3. Energy and Utility
- 7.4.4. Banking and Financial Services
- 7.4.5. Education
- 7.4.6. Other End-user Industries
- 7.1. Market Analysis, Insights and Forecast - by Network Type
- 8. Asia Network Automation Solution Industry Analysis, Insights and Forecast, 2019-2031
- 8.1. Market Analysis, Insights and Forecast - by Network Type
- 8.1.1. Physical
- 8.1.2. Virtual
- 8.1.3. Hybrid
- 8.2. Market Analysis, Insights and Forecast - by Component
- 8.2.1. Solution Type
- 8.2.1.1. Network Automation Tools
- 8.2.1.2. SD-WAN and Network Virtualization
- 8.2.1.3. Intent-based Networking
- 8.2.2. Service Type
- 8.2.2.1. Managed Service
- 8.2.2.2. Professional Service
- 8.2.1. Solution Type
- 8.3. Market Analysis, Insights and Forecast - by Deployment
- 8.3.1. Cloud
- 8.3.2. On-premise
- 8.3.3. Hybrid
- 8.4. Market Analysis, Insights and Forecast - by End-user Industry
- 8.4.1. IT and Telecom
- 8.4.2. Manufacturing
- 8.4.3. Energy and Utility
- 8.4.4. Banking and Financial Services
- 8.4.5. Education
- 8.4.6. Other End-user Industries
- 8.1. Market Analysis, Insights and Forecast - by Network Type
- 9. Australia and New Zealand Network Automation Solution Industry Analysis, Insights and Forecast, 2019-2031
- 9.1. Market Analysis, Insights and Forecast - by Network Type
- 9.1.1. Physical
- 9.1.2. Virtual
- 9.1.3. Hybrid
- 9.2. Market Analysis, Insights and Forecast - by Component
- 9.2.1. Solution Type
- 9.2.1.1. Network Automation Tools
- 9.2.1.2. SD-WAN and Network Virtualization
- 9.2.1.3. Intent-based Networking
- 9.2.2. Service Type
- 9.2.2.1. Managed Service
- 9.2.2.2. Professional Service
- 9.2.1. Solution Type
- 9.3. Market Analysis, Insights and Forecast - by Deployment
- 9.3.1. Cloud
- 9.3.2. On-premise
- 9.3.3. Hybrid
- 9.4. Market Analysis, Insights and Forecast - by End-user Industry
- 9.4.1. IT and Telecom
- 9.4.2. Manufacturing
- 9.4.3. Energy and Utility
- 9.4.4. Banking and Financial Services
- 9.4.5. Education
- 9.4.6. Other End-user Industries
- 9.1. Market Analysis, Insights and Forecast - by Network Type
- 10. Latin America Network Automation Solution Industry Analysis, Insights and Forecast, 2019-2031
- 10.1. Market Analysis, Insights and Forecast - by Network Type
- 10.1.1. Physical
- 10.1.2. Virtual
- 10.1.3. Hybrid
- 10.2. Market Analysis, Insights and Forecast - by Component
- 10.2.1. Solution Type
- 10.2.1.1. Network Automation Tools
- 10.2.1.2. SD-WAN and Network Virtualization
- 10.2.1.3. Intent-based Networking
- 10.2.2. Service Type
- 10.2.2.1. Managed Service
- 10.2.2.2. Professional Service
- 10.2.1. Solution Type
- 10.3. Market Analysis, Insights and Forecast - by Deployment
- 10.3.1. Cloud
- 10.3.2. On-premise
- 10.3.3. Hybrid
- 10.4. Market Analysis, Insights and Forecast - by End-user Industry
- 10.4.1. IT and Telecom
- 10.4.2. Manufacturing
- 10.4.3. Energy and Utility
- 10.4.4. Banking and Financial Services
- 10.4.5. Education
- 10.4.6. Other End-user Industries
- 10.1. Market Analysis, Insights and Forecast - by Network Type
- 11. Middle East and Africa Network Automation Solution Industry Analysis, Insights and Forecast, 2019-2031
- 11.1. Market Analysis, Insights and Forecast - by Network Type
- 11.1.1. Physical
- 11.1.2. Virtual
- 11.1.3. Hybrid
- 11.2. Market Analysis, Insights and Forecast - by Component
- 11.2.1. Solution Type
- 11.2.1.1. Network Automation Tools
- 11.2.1.2. SD-WAN and Network Virtualization
- 11.2.1.3. Intent-based Networking
- 11.2.2. Service Type
- 11.2.2.1. Managed Service
- 11.2.2.2. Professional Service
- 11.2.1. Solution Type
- 11.3. Market Analysis, Insights and Forecast - by Deployment
- 11.3.1. Cloud
- 11.3.2. On-premise
- 11.3.3. Hybrid
- 11.4. Market Analysis, Insights and Forecast - by End-user Industry
- 11.4.1. IT and Telecom
- 11.4.2. Manufacturing
- 11.4.3. Energy and Utility
- 11.4.4. Banking and Financial Services
- 11.4.5. Education
- 11.4.6. Other End-user Industries
- 11.1. Market Analysis, Insights and Forecast - by Network Type
- 12. North America Network Automation Solution Industry Analysis, Insights and Forecast, 2019-2031
- 12.1. Market Analysis, Insights and Forecast - By Country/Sub-region
- 12.1.1 United States
- 12.1.2 Canada
- 12.1.3 Mexico
- 13. Europe Network Automation Solution Industry Analysis, Insights and Forecast, 2019-2031
- 13.1. Market Analysis, Insights and Forecast - By Country/Sub-region
- 13.1.1 Germany
- 13.1.2 United Kingdom
- 13.1.3 France
- 13.1.4 Spain
- 13.1.5 Italy
- 13.1.6 Spain
- 13.1.7 Belgium
- 13.1.8 Netherland
- 13.1.9 Nordics
- 13.1.10 Rest of Europe
- 14. Asia Pacific Network Automation Solution Industry Analysis, Insights and Forecast, 2019-2031
- 14.1. Market Analysis, Insights and Forecast - By Country/Sub-region
- 14.1.1 China
- 14.1.2 Japan
- 14.1.3 India
- 14.1.4 South Korea
- 14.1.5 Southeast Asia
- 14.1.6 Australia
- 14.1.7 Indonesia
- 14.1.8 Phillipes
- 14.1.9 Singapore
- 14.1.10 Thailandc
- 14.1.11 Rest of Asia Pacific
- 15. South America Network Automation Solution Industry Analysis, Insights and Forecast, 2019-2031
- 15.1. Market Analysis, Insights and Forecast - By Country/Sub-region
- 15.1.1 Brazil
- 15.1.2 Argentina
- 15.1.3 Peru
- 15.1.4 Chile
- 15.1.5 Colombia
- 15.1.6 Ecuador
- 15.1.7 Venezuela
- 15.1.8 Rest of South America
- 16. North America Network Automation Solution Industry Analysis, Insights and Forecast, 2019-2031
- 16.1. Market Analysis, Insights and Forecast - By Country/Sub-region
- 16.1.1 United States
- 16.1.2 Canada
- 16.1.3 Mexico
- 17. MEA Network Automation Solution Industry Analysis, Insights and Forecast, 2019-2031
- 17.1. Market Analysis, Insights and Forecast - By Country/Sub-region
- 17.1.1 United Arab Emirates
- 17.1.2 Saudi Arabia
- 17.1.3 South Africa
- 17.1.4 Rest of Middle East and Africa
- 18. Competitive Analysis
- 18.1. Global Market Share Analysis 2024
- 18.2. Company Profiles
- 18.2.1 AppViewX Inc
- 18.2.1.1. Overview
- 18.2.1.2. Products
- 18.2.1.3. SWOT Analysis
- 18.2.1.4. Recent Developments
- 18.2.1.5. Financials (Based on Availability)
- 18.2.2 IBM Corporation
- 18.2.2.1. Overview
- 18.2.2.2. Products
- 18.2.2.3. SWOT Analysis
- 18.2.2.4. Recent Developments
- 18.2.2.5. Financials (Based on Availability)
- 18.2.3 Nuage Networks (Nokia Corporation)
- 18.2.3.1. Overview
- 18.2.3.2. Products
- 18.2.3.3. SWOT Analysis
- 18.2.3.4. Recent Developments
- 18.2.3.5. Financials (Based on Availability)
- 18.2.4 Arista Networks Inc
- 18.2.4.1. Overview
- 18.2.4.2. Products
- 18.2.4.3. SWOT Analysis
- 18.2.4.4. Recent Developments
- 18.2.4.5. Financials (Based on Availability)
- 18.2.5 Hewlett Packard Enterprise Company
- 18.2.5.1. Overview
- 18.2.5.2. Products
- 18.2.5.3. SWOT Analysis
- 18.2.5.4. Recent Developments
- 18.2.5.5. Financials (Based on Availability)
- 18.2.6 Cisco Systems Inc
- 18.2.6.1. Overview
- 18.2.6.2. Products
- 18.2.6.3. SWOT Analysis
- 18.2.6.4. Recent Developments
- 18.2.6.5. Financials (Based on Availability)
- 18.2.7 Broadcom Inc
- 18.2.7.1. Overview
- 18.2.7.2. Products
- 18.2.7.3. SWOT Analysis
- 18.2.7.4. Recent Developments
- 18.2.7.5. Financials (Based on Availability)
- 18.2.8 Fujitsu Limited
- 18.2.8.1. Overview
- 18.2.8.2. Products
- 18.2.8.3. SWOT Analysis
- 18.2.8.4. Recent Developments
- 18.2.8.5. Financials (Based on Availability)
- 18.2.9 Juniper Networks Inc
- 18.2.9.1. Overview
- 18.2.9.2. Products
- 18.2.9.3. SWOT Analysis
- 18.2.9.4. Recent Developments
- 18.2.9.5. Financials (Based on Availability)
- 18.2.10 BMC Software Inc
- 18.2.10.1. Overview
- 18.2.10.2. Products
- 18.2.10.3. SWOT Analysis
- 18.2.10.4. Recent Developments
- 18.2.10.5. Financials (Based on Availability)
- 18.2.11 Extreme Networks Inc
- 18.2.11.1. Overview
- 18.2.11.2. Products
- 18.2.11.3. SWOT Analysis
- 18.2.11.4. Recent Developments
- 18.2.11.5. Financials (Based on Availability)
- 18.2.12 NetBrain Technologies Inc
- 18.2.12.1. Overview
- 18.2.12.2. Products
- 18.2.12.3. SWOT Analysis
- 18.2.12.4. Recent Developments
- 18.2.12.5. Financials (Based on Availability)
- 18.2.13 Forward Networks Inc
- 18.2.13.1. Overview
- 18.2.13.2. Products
- 18.2.13.3. SWOT Analysis
- 18.2.13.4. Recent Developments
- 18.2.13.5. Financials (Based on Availability)
- 18.2.14 Solarwinds Corporation
- 18.2.14.1. Overview
- 18.2.14.2. Products
- 18.2.14.3. SWOT Analysis
- 18.2.14.4. Recent Developments
- 18.2.14.5. Financials (Based on Availability)
- 18.2.15 Open Text Corporation
- 18.2.15.1. Overview
- 18.2.15.2. Products
- 18.2.15.3. SWOT Analysis
- 18.2.15.4. Recent Developments
- 18.2.15.5. Financials (Based on Availability)
- 18.2.16 Fortra LLC
- 18.2.16.1. Overview
- 18.2.16.2. Products
- 18.2.16.3. SWOT Analysis
- 18.2.16.4. Recent Developments
- 18.2.16.5. Financials (Based on Availability)
- 18.2.1 AppViewX Inc
List of Figures
- Figure 1: Global Network Automation Solution Industry Revenue Breakdown (Million, %) by Region 2024 & 2032
- Figure 2: North America Network Automation Solution Industry Revenue (Million), by Country 2024 & 2032
- Figure 3: North America Network Automation Solution Industry Revenue Share (%), by Country 2024 & 2032
- Figure 4: Europe Network Automation Solution Industry Revenue (Million), by Country 2024 & 2032
- Figure 5: Europe Network Automation Solution Industry Revenue Share (%), by Country 2024 & 2032
- Figure 6: Asia Pacific Network Automation Solution Industry Revenue (Million), by Country 2024 & 2032
- Figure 7: Asia Pacific Network Automation Solution Industry Revenue Share (%), by Country 2024 & 2032
- Figure 8: South America Network Automation Solution Industry Revenue (Million), by Country 2024 & 2032
- Figure 9: South America Network Automation Solution Industry Revenue Share (%), by Country 2024 & 2032
- Figure 10: North America Network Automation Solution Industry Revenue (Million), by Country 2024 & 2032
- Figure 11: North America Network Automation Solution Industry Revenue Share (%), by Country 2024 & 2032
- Figure 12: MEA Network Automation Solution Industry Revenue (Million), by Country 2024 & 2032
- Figure 13: MEA Network Automation Solution Industry Revenue Share (%), by Country 2024 & 2032
- Figure 14: North America Network Automation Solution Industry Revenue (Million), by Network Type 2024 & 2032
- Figure 15: North America Network Automation Solution Industry Revenue Share (%), by Network Type 2024 & 2032
- Figure 16: North America Network Automation Solution Industry Revenue (Million), by Component 2024 & 2032
- Figure 17: North America Network Automation Solution Industry Revenue Share (%), by Component 2024 & 2032
- Figure 18: North America Network Automation Solution Industry Revenue (Million), by Deployment 2024 & 2032
- Figure 19: North America Network Automation Solution Industry Revenue Share (%), by Deployment 2024 & 2032
- Figure 20: North America Network Automation Solution Industry Revenue (Million), by End-user Industry 2024 & 2032
- Figure 21: North America Network Automation Solution Industry Revenue Share (%), by End-user Industry 2024 & 2032
- Figure 22: North America Network Automation Solution Industry Revenue (Million), by Country 2024 & 2032
- Figure 23: North America Network Automation Solution Industry Revenue Share (%), by Country 2024 & 2032
- Figure 24: Europe Network Automation Solution Industry Revenue (Million), by Network Type 2024 & 2032
- Figure 25: Europe Network Automation Solution Industry Revenue Share (%), by Network Type 2024 & 2032
- Figure 26: Europe Network Automation Solution Industry Revenue (Million), by Component 2024 & 2032
- Figure 27: Europe Network Automation Solution Industry Revenue Share (%), by Component 2024 & 2032
- Figure 28: Europe Network Automation Solution Industry Revenue (Million), by Deployment 2024 & 2032
- Figure 29: Europe Network Automation Solution Industry Revenue Share (%), by Deployment 2024 & 2032
- Figure 30: Europe Network Automation Solution Industry Revenue (Million), by End-user Industry 2024 & 2032
- Figure 31: Europe Network Automation Solution Industry Revenue Share (%), by End-user Industry 2024 & 2032
- Figure 32: Europe Network Automation Solution Industry Revenue (Million), by Country 2024 & 2032
- Figure 33: Europe Network Automation Solution Industry Revenue Share (%), by Country 2024 & 2032
- Figure 34: Asia Network Automation Solution Industry Revenue (Million), by Network Type 2024 & 2032
- Figure 35: Asia Network Automation Solution Industry Revenue Share (%), by Network Type 2024 & 2032
- Figure 36: Asia Network Automation Solution Industry Revenue (Million), by Component 2024 & 2032
- Figure 37: Asia Network Automation Solution Industry Revenue Share (%), by Component 2024 & 2032
- Figure 38: Asia Network Automation Solution Industry Revenue (Million), by Deployment 2024 & 2032
- Figure 39: Asia Network Automation Solution Industry Revenue Share (%), by Deployment 2024 & 2032
- Figure 40: Asia Network Automation Solution Industry Revenue (Million), by End-user Industry 2024 & 2032
- Figure 41: Asia Network Automation Solution Industry Revenue Share (%), by End-user Industry 2024 & 2032
- Figure 42: Asia Network Automation Solution Industry Revenue (Million), by Country 2024 & 2032
- Figure 43: Asia Network Automation Solution Industry Revenue Share (%), by Country 2024 & 2032
- Figure 44: Australia and New Zealand Network Automation Solution Industry Revenue (Million), by Network Type 2024 & 2032
- Figure 45: Australia and New Zealand Network Automation Solution Industry Revenue Share (%), by Network Type 2024 & 2032
- Figure 46: Australia and New Zealand Network Automation Solution Industry Revenue (Million), by Component 2024 & 2032
- Figure 47: Australia and New Zealand Network Automation Solution Industry Revenue Share (%), by Component 2024 & 2032
- Figure 48: Australia and New Zealand Network Automation Solution Industry Revenue (Million), by Deployment 2024 & 2032
- Figure 49: Australia and New Zealand Network Automation Solution Industry Revenue Share (%), by Deployment 2024 & 2032
- Figure 50: Australia and New Zealand Network Automation Solution Industry Revenue (Million), by End-user Industry 2024 & 2032
- Figure 51: Australia and New Zealand Network Automation Solution Industry Revenue Share (%), by End-user Industry 2024 & 2032
- Figure 52: Australia and New Zealand Network Automation Solution Industry Revenue (Million), by Country 2024 & 2032
- Figure 53: Australia and New Zealand Network Automation Solution Industry Revenue Share (%), by Country 2024 & 2032
- Figure 54: Latin America Network Automation Solution Industry Revenue (Million), by Network Type 2024 & 2032
- Figure 55: Latin America Network Automation Solution Industry Revenue Share (%), by Network Type 2024 & 2032
- Figure 56: Latin America Network Automation Solution Industry Revenue (Million), by Component 2024 & 2032
- Figure 57: Latin America Network Automation Solution Industry Revenue Share (%), by Component 2024 & 2032
- Figure 58: Latin America Network Automation Solution Industry Revenue (Million), by Deployment 2024 & 2032
- Figure 59: Latin America Network Automation Solution Industry Revenue Share (%), by Deployment 2024 & 2032
- Figure 60: Latin America Network Automation Solution Industry Revenue (Million), by End-user Industry 2024 & 2032
- Figure 61: Latin America Network Automation Solution Industry Revenue Share (%), by End-user Industry 2024 & 2032
- Figure 62: Latin America Network Automation Solution Industry Revenue (Million), by Country 2024 & 2032
- Figure 63: Latin America Network Automation Solution Industry Revenue Share (%), by Country 2024 & 2032
- Figure 64: Middle East and Africa Network Automation Solution Industry Revenue (Million), by Network Type 2024 & 2032
- Figure 65: Middle East and Africa Network Automation Solution Industry Revenue Share (%), by Network Type 2024 & 2032
- Figure 66: Middle East and Africa Network Automation Solution Industry Revenue (Million), by Component 2024 & 2032
- Figure 67: Middle East and Africa Network Automation Solution Industry Revenue Share (%), by Component 2024 & 2032
- Figure 68: Middle East and Africa Network Automation Solution Industry Revenue (Million), by Deployment 2024 & 2032
- Figure 69: Middle East and Africa Network Automation Solution Industry Revenue Share (%), by Deployment 2024 & 2032
- Figure 70: Middle East and Africa Network Automation Solution Industry Revenue (Million), by End-user Industry 2024 & 2032
- Figure 71: Middle East and Africa Network Automation Solution Industry Revenue Share (%), by End-user Industry 2024 & 2032
- Figure 72: Middle East and Africa Network Automation Solution Industry Revenue (Million), by Country 2024 & 2032
- Figure 73: Middle East and Africa Network Automation Solution Industry Revenue Share (%), by Country 2024 & 2032
List of Tables
- Table 1: Global Network Automation Solution Industry Revenue Million Forecast, by Region 2019 & 2032
- Table 2: Global Network Automation Solution Industry Revenue Million Forecast, by Network Type 2019 & 2032
- Table 3: Global Network Automation Solution Industry Revenue Million Forecast, by Component 2019 & 2032
- Table 4: Global Network Automation Solution Industry Revenue Million Forecast, by Deployment 2019 & 2032
- Table 5: Global Network Automation Solution Industry Revenue Million Forecast, by End-user Industry 2019 & 2032
- Table 6: Global Network Automation Solution Industry Revenue Million Forecast, by Region 2019 & 2032
- Table 7: Global Network Automation Solution Industry Revenue Million Forecast, by Country 2019 & 2032
- Table 8: United States Network Automation Solution Industry Revenue (Million) Forecast, by Application 2019 & 2032
- Table 9: Canada Network Automation Solution Industry Revenue (Million) Forecast, by Application 2019 & 2032
- Table 10: Mexico Network Automation Solution Industry Revenue (Million) Forecast, by Application 2019 & 2032
- Table 11: Global Network Automation Solution Industry Revenue Million Forecast, by Country 2019 & 2032
- Table 12: Germany Network Automation Solution Industry Revenue (Million) Forecast, by Application 2019 & 2032
- Table 13: United Kingdom Network Automation Solution Industry Revenue (Million) Forecast, by Application 2019 & 2032
- Table 14: France Network Automation Solution Industry Revenue (Million) Forecast, by Application 2019 & 2032
- Table 15: Spain Network Automation Solution Industry Revenue (Million) Forecast, by Application 2019 & 2032
- Table 16: Italy Network Automation Solution Industry Revenue (Million) Forecast, by Application 2019 & 2032
- Table 17: Spain Network Automation Solution Industry Revenue (Million) Forecast, by Application 2019 & 2032
- Table 18: Belgium Network Automation Solution Industry Revenue (Million) Forecast, by Application 2019 & 2032
- Table 19: Netherland Network Automation Solution Industry Revenue (Million) Forecast, by Application 2019 & 2032
- Table 20: Nordics Network Automation Solution Industry Revenue (Million) Forecast, by Application 2019 & 2032
- Table 21: Rest of Europe Network Automation Solution Industry Revenue (Million) Forecast, by Application 2019 & 2032
- Table 22: Global Network Automation Solution Industry Revenue Million Forecast, by Country 2019 & 2032
- Table 23: China Network Automation Solution Industry Revenue (Million) Forecast, by Application 2019 & 2032
- Table 24: Japan Network Automation Solution Industry Revenue (Million) Forecast, by Application 2019 & 2032
- Table 25: India Network Automation Solution Industry Revenue (Million) Forecast, by Application 2019 & 2032
- Table 26: South Korea Network Automation Solution Industry Revenue (Million) Forecast, by Application 2019 & 2032
- Table 27: Southeast Asia Network Automation Solution Industry Revenue (Million) Forecast, by Application 2019 & 2032
- Table 28: Australia Network Automation Solution Industry Revenue (Million) Forecast, by Application 2019 & 2032
- Table 29: Indonesia Network Automation Solution Industry Revenue (Million) Forecast, by Application 2019 & 2032
- Table 30: Phillipes Network Automation Solution Industry Revenue (Million) Forecast, by Application 2019 & 2032
- Table 31: Singapore Network Automation Solution Industry Revenue (Million) Forecast, by Application 2019 & 2032
- Table 32: Thailandc Network Automation Solution Industry Revenue (Million) Forecast, by Application 2019 & 2032
- Table 33: Rest of Asia Pacific Network Automation Solution Industry Revenue (Million) Forecast, by Application 2019 & 2032
- Table 34: Global Network Automation Solution Industry Revenue Million Forecast, by Country 2019 & 2032
- Table 35: Brazil Network Automation Solution Industry Revenue (Million) Forecast, by Application 2019 & 2032
- Table 36: Argentina Network Automation Solution Industry Revenue (Million) Forecast, by Application 2019 & 2032
- Table 37: Peru Network Automation Solution Industry Revenue (Million) Forecast, by Application 2019 & 2032
- Table 38: Chile Network Automation Solution Industry Revenue (Million) Forecast, by Application 2019 & 2032
- Table 39: Colombia Network Automation Solution Industry Revenue (Million) Forecast, by Application 2019 & 2032
- Table 40: Ecuador Network Automation Solution Industry Revenue (Million) Forecast, by Application 2019 & 2032
- Table 41: Venezuela Network Automation Solution Industry Revenue (Million) Forecast, by Application 2019 & 2032
- Table 42: Rest of South America Network Automation Solution Industry Revenue (Million) Forecast, by Application 2019 & 2032
- Table 43: Global Network Automation Solution Industry Revenue Million Forecast, by Country 2019 & 2032
- Table 44: United States Network Automation Solution Industry Revenue (Million) Forecast, by Application 2019 & 2032
- Table 45: Canada Network Automation Solution Industry Revenue (Million) Forecast, by Application 2019 & 2032
- Table 46: Mexico Network Automation Solution Industry Revenue (Million) Forecast, by Application 2019 & 2032
- Table 47: Global Network Automation Solution Industry Revenue Million Forecast, by Country 2019 & 2032
- Table 48: United Arab Emirates Network Automation Solution Industry Revenue (Million) Forecast, by Application 2019 & 2032
- Table 49: Saudi Arabia Network Automation Solution Industry Revenue (Million) Forecast, by Application 2019 & 2032
- Table 50: South Africa Network Automation Solution Industry Revenue (Million) Forecast, by Application 2019 & 2032
- Table 51: Rest of Middle East and Africa Network Automation Solution Industry Revenue (Million) Forecast, by Application 2019 & 2032
- Table 52: Global Network Automation Solution Industry Revenue Million Forecast, by Network Type 2019 & 2032
- Table 53: Global Network Automation Solution Industry Revenue Million Forecast, by Component 2019 & 2032
- Table 54: Global Network Automation Solution Industry Revenue Million Forecast, by Deployment 2019 & 2032
- Table 55: Global Network Automation Solution Industry Revenue Million Forecast, by End-user Industry 2019 & 2032
- Table 56: Global Network Automation Solution Industry Revenue Million Forecast, by Country 2019 & 2032
- Table 57: Global Network Automation Solution Industry Revenue Million Forecast, by Network Type 2019 & 2032
- Table 58: Global Network Automation Solution Industry Revenue Million Forecast, by Component 2019 & 2032
- Table 59: Global Network Automation Solution Industry Revenue Million Forecast, by Deployment 2019 & 2032
- Table 60: Global Network Automation Solution Industry Revenue Million Forecast, by End-user Industry 2019 & 2032
- Table 61: Global Network Automation Solution Industry Revenue Million Forecast, by Country 2019 & 2032
- Table 62: Global Network Automation Solution Industry Revenue Million Forecast, by Network Type 2019 & 2032
- Table 63: Global Network Automation Solution Industry Revenue Million Forecast, by Component 2019 & 2032
- Table 64: Global Network Automation Solution Industry Revenue Million Forecast, by Deployment 2019 & 2032
- Table 65: Global Network Automation Solution Industry Revenue Million Forecast, by End-user Industry 2019 & 2032
- Table 66: Global Network Automation Solution Industry Revenue Million Forecast, by Country 2019 & 2032
- Table 67: Global Network Automation Solution Industry Revenue Million Forecast, by Network Type 2019 & 2032
- Table 68: Global Network Automation Solution Industry Revenue Million Forecast, by Component 2019 & 2032
- Table 69: Global Network Automation Solution Industry Revenue Million Forecast, by Deployment 2019 & 2032
- Table 70: Global Network Automation Solution Industry Revenue Million Forecast, by End-user Industry 2019 & 2032
- Table 71: Global Network Automation Solution Industry Revenue Million Forecast, by Country 2019 & 2032
- Table 72: Global Network Automation Solution Industry Revenue Million Forecast, by Network Type 2019 & 2032
- Table 73: Global Network Automation Solution Industry Revenue Million Forecast, by Component 2019 & 2032
- Table 74: Global Network Automation Solution Industry Revenue Million Forecast, by Deployment 2019 & 2032
- Table 75: Global Network Automation Solution Industry Revenue Million Forecast, by End-user Industry 2019 & 2032
- Table 76: Global Network Automation Solution Industry Revenue Million Forecast, by Country 2019 & 2032
- Table 77: Global Network Automation Solution Industry Revenue Million Forecast, by Network Type 2019 & 2032
- Table 78: Global Network Automation Solution Industry Revenue Million Forecast, by Component 2019 & 2032
- Table 79: Global Network Automation Solution Industry Revenue Million Forecast, by Deployment 2019 & 2032
- Table 80: Global Network Automation Solution Industry Revenue Million Forecast, by End-user Industry 2019 & 2032
- Table 81: Global Network Automation Solution Industry Revenue Million Forecast, by Country 2019 & 2032
Frequently Asked Questions
1. What is the projected Compound Annual Growth Rate (CAGR) of the Network Automation Solution Industry?
The projected CAGR is approximately 23.16%.
2. Which companies are prominent players in the Network Automation Solution Industry?
Key companies in the market include AppViewX Inc, IBM Corporation, Nuage Networks (Nokia Corporation), Arista Networks Inc, Hewlett Packard Enterprise Company, Cisco Systems Inc, Broadcom Inc, Fujitsu Limited, Juniper Networks Inc, BMC Software Inc, Extreme Networks Inc, NetBrain Technologies Inc, Forward Networks Inc, Solarwinds Corporation, Open Text Corporation, Fortra LLC.
3. What are the main segments of the Network Automation Solution Industry?
The market segments include Network Type, Component, Deployment, End-user Industry.
4. Can you provide details about the market size?
The market size is estimated to be USD 25.16 Million as of 2022.
5. What are some drivers contributing to market growth?
Increasing Demand for Data Center Network; Rising Trend of Connected Devices.
6. What are the notable trends driving market growth?
IT and Telecom End-user Industry is Expected to Hold Significant Market Share.
7. Are there any restraints impacting market growth?
Lack of Skilled Professional Across Industries.
8. Can you provide examples of recent developments in the market?
March 2024: Arista announced a new network observability software. This offering integrates data from network infrastructure performance with insights from compute and server systems to provide comprehensive insights into application and workload performance across data centers, campuses, and wide-area networks. Arista’s CloudVision Universal Network ObservabilityTM (CV UNOTM) system, available as a premium feature on Arista CloudVision, facilitates network automation, systems, and application visibility.
9. What pricing options are available for accessing the report?
Pricing options include single-user, multi-user, and enterprise licenses priced at USD 4750, USD 5250, and USD 8750 respectively.
10. Is the market size provided in terms of value or volume?
The market size is provided in terms of value, measured in Million.
11. Are there any specific market keywords associated with the report?
Yes, the market keyword associated with the report is "Network Automation Solution Industry," which aids in identifying and referencing the specific market segment covered.
12. How do I determine which pricing option suits my needs best?
The pricing options vary based on user requirements and access needs. Individual users may opt for single-user licenses, while businesses requiring broader access may choose multi-user or enterprise licenses for cost-effective access to the report.
13. Are there any additional resources or data provided in the Network Automation Solution Industry report?
While the report offers comprehensive insights, it's advisable to review the specific contents or supplementary materials provided to ascertain if additional resources or data are available.
14. How can I stay updated on further developments or reports in the Network Automation Solution Industry?
To stay informed about further developments, trends, and reports in the Network Automation Solution Industry, consider subscribing to industry newsletters, following relevant companies and organizations, or regularly checking reputable industry news sources and publications.
Methodology
Step 1 - Identification of Relevant Samples Size from Population Database


Step 2 - Approaches for Defining Global Market Size (Value, Volume* & Price*)

Note*: In applicable scenarios
Step 3 - Data Sources
Primary Research
- Web Analytics
- Survey Reports
- Research Institute
- Latest Research Reports
- Opinion Leaders
Secondary Research
- Annual Reports
- White Paper
- Latest Press Release
- Industry Association
- Paid Database
- Investor Presentations

Step 4 - Data Triangulation
Involves using different sources of information in order to increase the validity of a study
These sources are likely to be stakeholders in a program - participants, other researchers, program staff, other community members, and so on.
Then we put all data in single framework & apply various statistical tools to find out the dynamic on the market.
During the analysis stage, feedback from the stakeholder groups would be compared to determine areas of agreement as well as areas of divergence
