

Key Insights
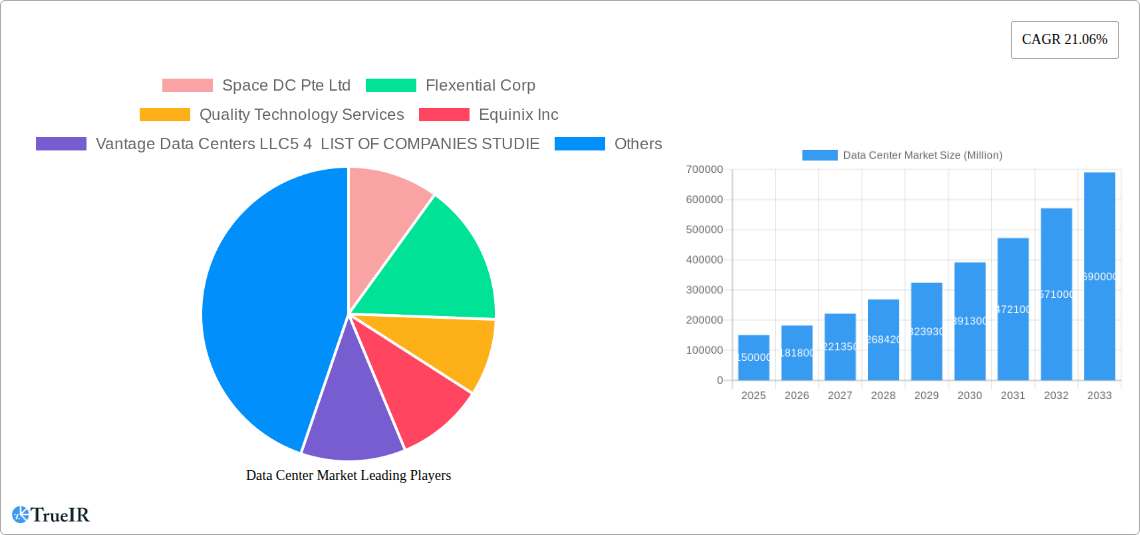
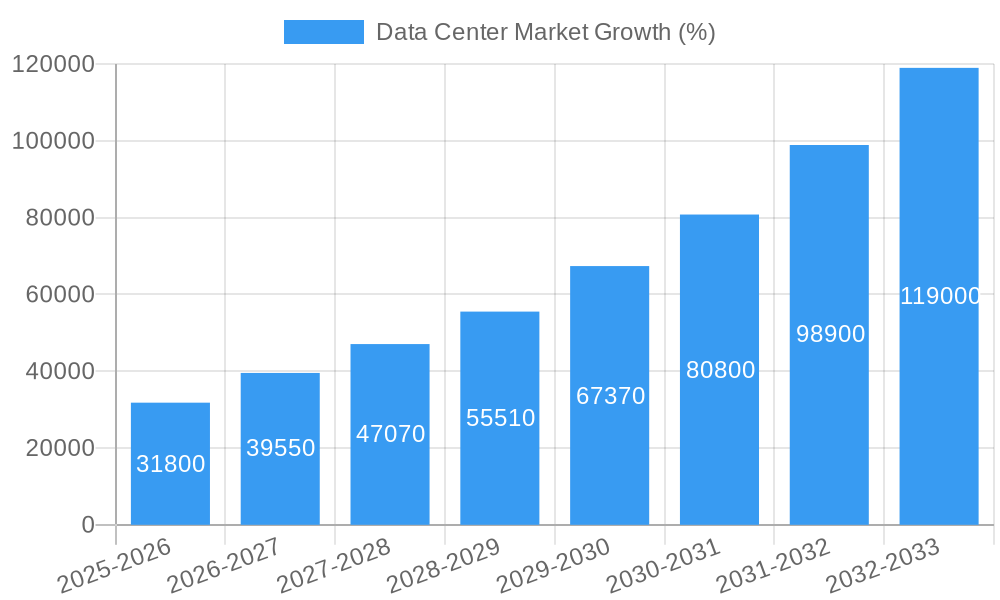
The global data center market is experiencing robust growth, projected to reach a substantial size driven by the increasing demand for cloud computing, big data analytics, and the Internet of Things (IoT). The compound annual growth rate (CAGR) of 21.06% from 2019 to 2024 indicates a significant expansion, with this momentum expected to continue through 2033. Key drivers include the rising adoption of digital transformation strategies across various industries, the proliferation of 5G networks fueling higher bandwidth requirements, and the growing need for edge computing to reduce latency. Market segmentation reveals a diverse landscape, with large and mega data centers dominating the market share due to economies of scale and their ability to accommodate substantial computing power. However, the market also sees significant growth in smaller data centers, especially within the edge computing sector. Tier 1 and Tier 2 data centers continue to be the prevalent types, while the absorption rate shows a growing demand for utilized space, indicating increased operational efficiency and capacity utilization within the industry. Geographical distribution will likely show strong performance in regions with robust digital infrastructure and high technological adoption rates.
Competition within the data center market is fierce, with established players like Equinix, Digital Realty, and Switch competing alongside emerging providers like Chindata and AirTrunk. The market is further shaped by strategic mergers and acquisitions, expanding geographical reach, and the continuous development of innovative technologies to enhance efficiency, sustainability, and security. While potential restraints such as high infrastructure costs and regulatory hurdles exist, the overall positive market outlook remains strong, fueled by the relentless growth of data generation and the ever-increasing reliance on digital technologies across all sectors of the global economy. The forecast period (2025-2033) is expected to witness further consolidation and innovation, with a focus on sustainable and efficient data center solutions. The market will see continued investment in advanced technologies like AI-powered resource management, improved cooling systems, and renewable energy sources.
Data Center Market: A Comprehensive Market Report (2019-2033)
This dynamic report provides a comprehensive analysis of the Data Center Market, encompassing market structure, competitive landscape, trends, opportunities, and future outlook from 2019 to 2033. With a focus on key players like Equinix Inc, Digital Realty Trust Inc, and CyrusOne Inc, this report is an invaluable resource for investors, industry professionals, and strategic decision-makers. The report leverages extensive data analysis, including market size estimations, CAGR calculations, and in-depth segment analysis, to offer actionable insights. The base year for this analysis is 2025, with a forecast period extending to 2033.
Data Center Market Market Structure & Competitive Landscape
The Data Center market exhibits a moderately concentrated structure, with a handful of major players commanding significant market share. The Herfindahl-Hirschman Index (HHI) for the market in 2024 is estimated at xx, indicating a moderate level of concentration. However, the market is also characterized by intense competition, driven by continuous innovation and a high entry barrier due to significant capital investment requirements. Mergers and acquisitions (M&A) activity has been substantial, with a total M&A volume of approximately $xx Million in 2024, primarily focused on expanding geographic reach and technological capabilities.
- Market Concentration: The HHI is estimated at xx in 2024.
- Innovation Drivers: The constant need for higher processing speeds, increased storage capacity, and enhanced energy efficiency drive innovation.
- Regulatory Impacts: Government regulations concerning data privacy, security, and energy consumption significantly influence market dynamics.
- Product Substitutes: Cloud computing services present a key substitute for traditional data centers, influencing market growth.
- End-User Segmentation: The market is segmented by data center size (Large, Massive, Medium, Mega, Small), tier type (Tier 1, Tier 2, Tier 3), and absorption (Utilized, Non-Utilized, Other End User).
- M&A Trends: Strategic acquisitions have focused on expanding geographical reach, enhancing technological capabilities, and securing key talent.
Data Center Market Market Trends & Opportunities
The global Data Center market is experiencing robust growth, with a projected Compound Annual Growth Rate (CAGR) of xx% from 2025 to 2033. This expansion is fueled by several key factors: the burgeoning demand for cloud-based services, the proliferation of the Internet of Things (IoT), the rise of big data analytics, and increased adoption of 5G technology. Technological advancements, such as the adoption of artificial intelligence (AI) and machine learning (ML) in data center operations, are further enhancing efficiency and scalability. Market penetration rates for cloud-based data center services are steadily increasing, exceeding xx% in key regions by 2024, indicating a significant shift in consumer preference. Competitive dynamics are intensifying as existing players expand their offerings and new entrants challenge the status quo. The market is expected to reach a value of approximately $xx Million by 2033.
Dominant Markets & Segments in Data Center Market
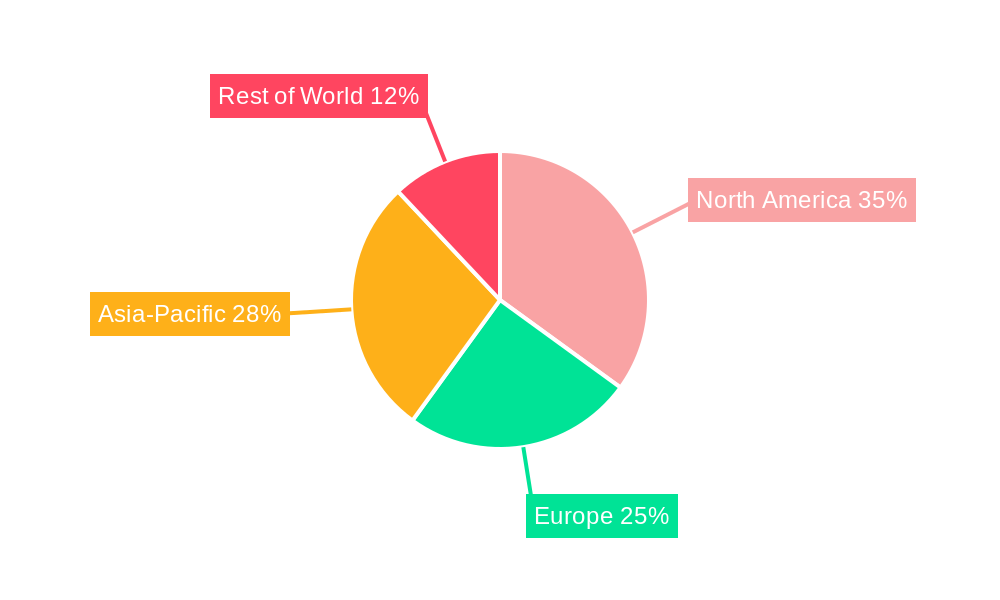
The North American region currently holds the dominant position in the global Data Center market, followed by Europe and Asia-Pacific. Within the United States, California and Virginia are key growth hubs.
- Key Growth Drivers:
- Robust Infrastructure Investments: Significant investments in network infrastructure are facilitating growth.
- Supportive Government Policies: Government initiatives promoting digital transformation are driving demand.
- High Adoption of Cloud Services: The increasing demand for cloud computing is a key growth catalyst.
- Dominant Segments: The Large and Mega data center segments are experiencing the most rapid growth. Tier 1 and Tier 2 facilities are seeing higher demand due to their enhanced reliability and security features. The utilized absorption segment commands the largest market share.
The dominance of North America is attributed to strong technological advancements, robust infrastructure, and supportive government policies. Europe is witnessing rapid growth due to increased data center investments in key markets such as Germany, the UK, and the Netherlands. The Asia-Pacific region is experiencing a surge in demand, fueled by the rapid growth of the digital economy in countries like China, India, and Singapore.
Data Center Market Product Analysis
Data center products are constantly evolving, with innovations focused on improving energy efficiency, scalability, and security. Advancements in server technology, networking infrastructure, and cooling systems are driving product differentiation and enhancing the competitive landscape. The increasing adoption of modular and prefabricated data centers is simplifying deployment and reducing construction times. This innovation allows for better market fit by providing faster deployment and cost-effective solutions.
Key Drivers, Barriers & Challenges in Data Center Market
Key Drivers: The explosive growth of big data, the increasing demand for cloud computing services, and the widespread adoption of 5G technology are key drivers. The increasing need for robust data security and disaster recovery solutions is also boosting market growth.
Key Challenges: High capital expenditure requirements, stringent regulatory compliance, and the need for skilled workforce are key barriers to market entry. Supply chain disruptions and increasing energy costs pose significant operational challenges. The competitive landscape, marked by established players and new entrants, adds to the market complexity. Supply chain disruptions caused a xx% increase in data center construction costs in 2024.
Growth Drivers in the Data Center Market Market
The increasing adoption of cloud services and the expansion of the Internet of Things (IoT) are major growth drivers. Government initiatives promoting digital transformation are creating favorable conditions for data center development. Moreover, technological advancements, such as AI and ML applications, are enhancing data center efficiency.
Challenges Impacting Data Center Market Growth
Regulatory complexities surrounding data privacy and security represent a significant challenge. Supply chain disruptions, particularly concerning semiconductor components, impede growth. Intense competition among established players and new entrants also adds pressure.
Key Players Shaping the Data Center Market Market
- Space DC Pte Ltd
- Flexential Corp
- Quality Technology Services
- Equinix Inc
- Vantage Data Centers LLC
- Cyxtera Technologies
- Switch
- Digital Realty Trust Inc
- CyrusOne Inc
- AirTrunk Operating Pty Ltd
- Chindata Group Holdings Ltd
- NTT Ltd
Significant Data Center Market Industry Milestones
- December 2022: Equinix, Inc. announced a USD 160 Million investment in a new data center in Johannesburg, South Africa, expanding its African presence.
- December 2022: HGC Global Communications partnered with Digital Realty to enhance edge connectivity for OTT customers in Singapore.
- January 2023: CyrusOne acquired an office complex in Frankfurt, Germany, for USD 102.3 Million, planning to transform it into a data center campus.
Future Outlook for Data Center Market Market
The Data Center market is poised for continued expansion, driven by increasing digitalization and the growing demand for cloud-based services. Strategic investments in infrastructure, technological innovations, and strategic partnerships will shape market dynamics. The market offers significant opportunities for growth, particularly in emerging economies and underserved regions. The potential for further consolidation through M&A activity remains high.
Data Center Market Segmentation
-
1. Data Center Size
- 1.1. Large
- 1.2. Massive
- 1.3. Medium
- 1.4. Mega
- 1.5. Small
-
2. Tier Type
- 2.1. Tier 1 and 2
- 2.2. Tier 3
- 2.3. Tier 4
-
3. Absorption
- 3.1. Non-Utilized
-
4. Colocation Type
- 4.1. Hyperscale
- 4.2. Retail
- 4.3. Wholesale
-
5. End User
- 5.1. BFSI
- 5.2. Cloud
- 5.3. E-Commerce
- 5.4. Government
- 5.5. Manufacturing
- 5.6. Media & Entertainment
- 5.7. Telecom
- 5.8. Other End User
Data Center Market Segmentation By Geography
-
1. North America
- 1.1. United States
- 1.2. Canada
- 1.3. Mexico
-
2. South America
- 2.1. Brazil
- 2.2. Argentina
- 2.3. Rest of South America
-
3. Europe
- 3.1. United Kingdom
- 3.2. Germany
- 3.3. France
- 3.4. Italy
- 3.5. Spain
- 3.6. Russia
- 3.7. Benelux
- 3.8. Nordics
- 3.9. Rest of Europe
-
4. Middle East & Africa
- 4.1. Turkey
- 4.2. Israel
- 4.3. GCC
- 4.4. North Africa
- 4.5. South Africa
- 4.6. Rest of Middle East & Africa
-
5. Asia Pacific
- 5.1. China
- 5.2. India
- 5.3. Japan
- 5.4. South Korea
- 5.5. ASEAN
- 5.6. Oceania
- 5.7. Rest of Asia Pacific
Data Center Market REPORT HIGHLIGHTS
| Aspects | Details |
|---|---|
| Study Period | 2019-2033 |
| Base Year | 2024 |
| Estimated Year | 2025 |
| Forecast Period | 2025-2033 |
| Historical Period | 2019-2024 |
| Growth Rate | CAGR of 21.06% from 2019-2033 |
| Segmentation |
|
Table of Contents
- 1. Introduction
- 1.1. Research Scope
- 1.2. Market Segmentation
- 1.3. Research Methodology
- 1.4. Definitions and Assumptions
- 2. Executive Summary
- 2.1. Introduction
- 3. Market Dynamics
- 3.1. Introduction
- 3.2. Market Drivers
- 3.2.1. Rise of E-Commerce; Flourishing Startup Culture
- 3.3. Market Restrains
- 3.3.1. Slow Penetration Rate in Developing Countries
- 3.4. Market Trends
- 3.4.1. OTHER KEY INDUSTRY TRENDS COVERED IN THE REPORT
- 4. Market Factor Analysis
- 4.1. Porters Five Forces
- 4.2. Supply/Value Chain
- 4.3. PESTEL analysis
- 4.4. Market Entropy
- 4.5. Patent/Trademark Analysis
- 5. Global Data Center Market Analysis, Insights and Forecast, 2019-2031
- 5.1. Market Analysis, Insights and Forecast - by Data Center Size
- 5.1.1. Large
- 5.1.2. Massive
- 5.1.3. Medium
- 5.1.4. Mega
- 5.1.5. Small
- 5.2. Market Analysis, Insights and Forecast - by Tier Type
- 5.2.1. Tier 1 and 2
- 5.2.2. Tier 3
- 5.2.3. Tier 4
- 5.3. Market Analysis, Insights and Forecast - by Absorption
- 5.3.1. Non-Utilized
- 5.4. Market Analysis, Insights and Forecast - by Colocation Type
- 5.4.1. Hyperscale
- 5.4.2. Retail
- 5.4.3. Wholesale
- 5.5. Market Analysis, Insights and Forecast - by End User
- 5.5.1. BFSI
- 5.5.2. Cloud
- 5.5.3. E-Commerce
- 5.5.4. Government
- 5.5.5. Manufacturing
- 5.5.6. Media & Entertainment
- 5.5.7. Telecom
- 5.5.8. Other End User
- 5.6. Market Analysis, Insights and Forecast - by Region
- 5.6.1. North America
- 5.6.2. South America
- 5.6.3. Europe
- 5.6.4. Middle East & Africa
- 5.6.5. Asia Pacific
- 5.1. Market Analysis, Insights and Forecast - by Data Center Size
- 6. North America Data Center Market Analysis, Insights and Forecast, 2019-2031
- 6.1. Market Analysis, Insights and Forecast - by Data Center Size
- 6.1.1. Large
- 6.1.2. Massive
- 6.1.3. Medium
- 6.1.4. Mega
- 6.1.5. Small
- 6.2. Market Analysis, Insights and Forecast - by Tier Type
- 6.2.1. Tier 1 and 2
- 6.2.2. Tier 3
- 6.2.3. Tier 4
- 6.3. Market Analysis, Insights and Forecast - by Absorption
- 6.3.1. Non-Utilized
- 6.4. Market Analysis, Insights and Forecast - by Colocation Type
- 6.4.1. Hyperscale
- 6.4.2. Retail
- 6.4.3. Wholesale
- 6.5. Market Analysis, Insights and Forecast - by End User
- 6.5.1. BFSI
- 6.5.2. Cloud
- 6.5.3. E-Commerce
- 6.5.4. Government
- 6.5.5. Manufacturing
- 6.5.6. Media & Entertainment
- 6.5.7. Telecom
- 6.5.8. Other End User
- 6.1. Market Analysis, Insights and Forecast - by Data Center Size
- 7. South America Data Center Market Analysis, Insights and Forecast, 2019-2031
- 7.1. Market Analysis, Insights and Forecast - by Data Center Size
- 7.1.1. Large
- 7.1.2. Massive
- 7.1.3. Medium
- 7.1.4. Mega
- 7.1.5. Small
- 7.2. Market Analysis, Insights and Forecast - by Tier Type
- 7.2.1. Tier 1 and 2
- 7.2.2. Tier 3
- 7.2.3. Tier 4
- 7.3. Market Analysis, Insights and Forecast - by Absorption
- 7.3.1. Non-Utilized
- 7.4. Market Analysis, Insights and Forecast - by Colocation Type
- 7.4.1. Hyperscale
- 7.4.2. Retail
- 7.4.3. Wholesale
- 7.5. Market Analysis, Insights and Forecast - by End User
- 7.5.1. BFSI
- 7.5.2. Cloud
- 7.5.3. E-Commerce
- 7.5.4. Government
- 7.5.5. Manufacturing
- 7.5.6. Media & Entertainment
- 7.5.7. Telecom
- 7.5.8. Other End User
- 7.1. Market Analysis, Insights and Forecast - by Data Center Size
- 8. Europe Data Center Market Analysis, Insights and Forecast, 2019-2031
- 8.1. Market Analysis, Insights and Forecast - by Data Center Size
- 8.1.1. Large
- 8.1.2. Massive
- 8.1.3. Medium
- 8.1.4. Mega
- 8.1.5. Small
- 8.2. Market Analysis, Insights and Forecast - by Tier Type
- 8.2.1. Tier 1 and 2
- 8.2.2. Tier 3
- 8.2.3. Tier 4
- 8.3. Market Analysis, Insights and Forecast - by Absorption
- 8.3.1. Non-Utilized
- 8.4. Market Analysis, Insights and Forecast - by Colocation Type
- 8.4.1. Hyperscale
- 8.4.2. Retail
- 8.4.3. Wholesale
- 8.5. Market Analysis, Insights and Forecast - by End User
- 8.5.1. BFSI
- 8.5.2. Cloud
- 8.5.3. E-Commerce
- 8.5.4. Government
- 8.5.5. Manufacturing
- 8.5.6. Media & Entertainment
- 8.5.7. Telecom
- 8.5.8. Other End User
- 8.1. Market Analysis, Insights and Forecast - by Data Center Size
- 9. Middle East & Africa Data Center Market Analysis, Insights and Forecast, 2019-2031
- 9.1. Market Analysis, Insights and Forecast - by Data Center Size
- 9.1.1. Large
- 9.1.2. Massive
- 9.1.3. Medium
- 9.1.4. Mega
- 9.1.5. Small
- 9.2. Market Analysis, Insights and Forecast - by Tier Type
- 9.2.1. Tier 1 and 2
- 9.2.2. Tier 3
- 9.2.3. Tier 4
- 9.3. Market Analysis, Insights and Forecast - by Absorption
- 9.3.1. Non-Utilized
- 9.4. Market Analysis, Insights and Forecast - by Colocation Type
- 9.4.1. Hyperscale
- 9.4.2. Retail
- 9.4.3. Wholesale
- 9.5. Market Analysis, Insights and Forecast - by End User
- 9.5.1. BFSI
- 9.5.2. Cloud
- 9.5.3. E-Commerce
- 9.5.4. Government
- 9.5.5. Manufacturing
- 9.5.6. Media & Entertainment
- 9.5.7. Telecom
- 9.5.8. Other End User
- 9.1. Market Analysis, Insights and Forecast - by Data Center Size
- 10. Asia Pacific Data Center Market Analysis, Insights and Forecast, 2019-2031
- 10.1. Market Analysis, Insights and Forecast - by Data Center Size
- 10.1.1. Large
- 10.1.2. Massive
- 10.1.3. Medium
- 10.1.4. Mega
- 10.1.5. Small
- 10.2. Market Analysis, Insights and Forecast - by Tier Type
- 10.2.1. Tier 1 and 2
- 10.2.2. Tier 3
- 10.2.3. Tier 4
- 10.3. Market Analysis, Insights and Forecast - by Absorption
- 10.3.1. Non-Utilized
- 10.4. Market Analysis, Insights and Forecast - by Colocation Type
- 10.4.1. Hyperscale
- 10.4.2. Retail
- 10.4.3. Wholesale
- 10.5. Market Analysis, Insights and Forecast - by End User
- 10.5.1. BFSI
- 10.5.2. Cloud
- 10.5.3. E-Commerce
- 10.5.4. Government
- 10.5.5. Manufacturing
- 10.5.6. Media & Entertainment
- 10.5.7. Telecom
- 10.5.8. Other End User
- 10.1. Market Analysis, Insights and Forecast - by Data Center Size
- 11. Competitive Analysis
- 11.1. Global Market Share Analysis 2024
- 11.2. Company Profiles
- 11.2.1 Space DC Pte Ltd
- 11.2.1.1. Overview
- 11.2.1.2. Products
- 11.2.1.3. SWOT Analysis
- 11.2.1.4. Recent Developments
- 11.2.1.5. Financials (Based on Availability)
- 11.2.2 Flexential Corp
- 11.2.2.1. Overview
- 11.2.2.2. Products
- 11.2.2.3. SWOT Analysis
- 11.2.2.4. Recent Developments
- 11.2.2.5. Financials (Based on Availability)
- 11.2.3 Quality Technology Services
- 11.2.3.1. Overview
- 11.2.3.2. Products
- 11.2.3.3. SWOT Analysis
- 11.2.3.4. Recent Developments
- 11.2.3.5. Financials (Based on Availability)
- 11.2.4 Equinix Inc
- 11.2.4.1. Overview
- 11.2.4.2. Products
- 11.2.4.3. SWOT Analysis
- 11.2.4.4. Recent Developments
- 11.2.4.5. Financials (Based on Availability)
- 11.2.5 Vantage Data Centers LLC5 4 LIST OF COMPANIES STUDIE
- 11.2.5.1. Overview
- 11.2.5.2. Products
- 11.2.5.3. SWOT Analysis
- 11.2.5.4. Recent Developments
- 11.2.5.5. Financials (Based on Availability)
- 11.2.6 Cyxtera Technologies
- 11.2.6.1. Overview
- 11.2.6.2. Products
- 11.2.6.3. SWOT Analysis
- 11.2.6.4. Recent Developments
- 11.2.6.5. Financials (Based on Availability)
- 11.2.7 Switch
- 11.2.7.1. Overview
- 11.2.7.2. Products
- 11.2.7.3. SWOT Analysis
- 11.2.7.4. Recent Developments
- 11.2.7.5. Financials (Based on Availability)
- 11.2.8 Digital Realty Trust Inc
- 11.2.8.1. Overview
- 11.2.8.2. Products
- 11.2.8.3. SWOT Analysis
- 11.2.8.4. Recent Developments
- 11.2.8.5. Financials (Based on Availability)
- 11.2.9 CyrusOne Inc
- 11.2.9.1. Overview
- 11.2.9.2. Products
- 11.2.9.3. SWOT Analysis
- 11.2.9.4. Recent Developments
- 11.2.9.5. Financials (Based on Availability)
- 11.2.10 AirTrunk Operating Pty Ltd
- 11.2.10.1. Overview
- 11.2.10.2. Products
- 11.2.10.3. SWOT Analysis
- 11.2.10.4. Recent Developments
- 11.2.10.5. Financials (Based on Availability)
- 11.2.11 Chindata Group Holdings Ltd
- 11.2.11.1. Overview
- 11.2.11.2. Products
- 11.2.11.3. SWOT Analysis
- 11.2.11.4. Recent Developments
- 11.2.11.5. Financials (Based on Availability)
- 11.2.12 NTT Ltd
- 11.2.12.1. Overview
- 11.2.12.2. Products
- 11.2.12.3. SWOT Analysis
- 11.2.12.4. Recent Developments
- 11.2.12.5. Financials (Based on Availability)
- 11.2.1 Space DC Pte Ltd
List of Figures
- Figure 1: Global Data Center Market Revenue Breakdown (Million, %) by Region 2024 & 2032
- Figure 2: Global Data Center Market Volume Breakdown (K Unit, %) by Region 2024 & 2032
- Figure 3: North America Data Center Market Revenue (Million), by Data Center Size 2024 & 2032
- Figure 4: North America Data Center Market Volume (K Unit), by Data Center Size 2024 & 2032
- Figure 5: North America Data Center Market Revenue Share (%), by Data Center Size 2024 & 2032
- Figure 6: North America Data Center Market Volume Share (%), by Data Center Size 2024 & 2032
- Figure 7: North America Data Center Market Revenue (Million), by Tier Type 2024 & 2032
- Figure 8: North America Data Center Market Volume (K Unit), by Tier Type 2024 & 2032
- Figure 9: North America Data Center Market Revenue Share (%), by Tier Type 2024 & 2032
- Figure 10: North America Data Center Market Volume Share (%), by Tier Type 2024 & 2032
- Figure 11: North America Data Center Market Revenue (Million), by Absorption 2024 & 2032
- Figure 12: North America Data Center Market Volume (K Unit), by Absorption 2024 & 2032
- Figure 13: North America Data Center Market Revenue Share (%), by Absorption 2024 & 2032
- Figure 14: North America Data Center Market Volume Share (%), by Absorption 2024 & 2032
- Figure 15: North America Data Center Market Revenue (Million), by Colocation Type 2024 & 2032
- Figure 16: North America Data Center Market Volume (K Unit), by Colocation Type 2024 & 2032
- Figure 17: North America Data Center Market Revenue Share (%), by Colocation Type 2024 & 2032
- Figure 18: North America Data Center Market Volume Share (%), by Colocation Type 2024 & 2032
- Figure 19: North America Data Center Market Revenue (Million), by End User 2024 & 2032
- Figure 20: North America Data Center Market Volume (K Unit), by End User 2024 & 2032
- Figure 21: North America Data Center Market Revenue Share (%), by End User 2024 & 2032
- Figure 22: North America Data Center Market Volume Share (%), by End User 2024 & 2032
- Figure 23: North America Data Center Market Revenue (Million), by Country 2024 & 2032
- Figure 24: North America Data Center Market Volume (K Unit), by Country 2024 & 2032
- Figure 25: North America Data Center Market Revenue Share (%), by Country 2024 & 2032
- Figure 26: North America Data Center Market Volume Share (%), by Country 2024 & 2032
- Figure 27: South America Data Center Market Revenue (Million), by Data Center Size 2024 & 2032
- Figure 28: South America Data Center Market Volume (K Unit), by Data Center Size 2024 & 2032
- Figure 29: South America Data Center Market Revenue Share (%), by Data Center Size 2024 & 2032
- Figure 30: South America Data Center Market Volume Share (%), by Data Center Size 2024 & 2032
- Figure 31: South America Data Center Market Revenue (Million), by Tier Type 2024 & 2032
- Figure 32: South America Data Center Market Volume (K Unit), by Tier Type 2024 & 2032
- Figure 33: South America Data Center Market Revenue Share (%), by Tier Type 2024 & 2032
- Figure 34: South America Data Center Market Volume Share (%), by Tier Type 2024 & 2032
- Figure 35: South America Data Center Market Revenue (Million), by Absorption 2024 & 2032
- Figure 36: South America Data Center Market Volume (K Unit), by Absorption 2024 & 2032
- Figure 37: South America Data Center Market Revenue Share (%), by Absorption 2024 & 2032
- Figure 38: South America Data Center Market Volume Share (%), by Absorption 2024 & 2032
- Figure 39: South America Data Center Market Revenue (Million), by Colocation Type 2024 & 2032
- Figure 40: South America Data Center Market Volume (K Unit), by Colocation Type 2024 & 2032
- Figure 41: South America Data Center Market Revenue Share (%), by Colocation Type 2024 & 2032
- Figure 42: South America Data Center Market Volume Share (%), by Colocation Type 2024 & 2032
- Figure 43: South America Data Center Market Revenue (Million), by End User 2024 & 2032
- Figure 44: South America Data Center Market Volume (K Unit), by End User 2024 & 2032
- Figure 45: South America Data Center Market Revenue Share (%), by End User 2024 & 2032
- Figure 46: South America Data Center Market Volume Share (%), by End User 2024 & 2032
- Figure 47: South America Data Center Market Revenue (Million), by Country 2024 & 2032
- Figure 48: South America Data Center Market Volume (K Unit), by Country 2024 & 2032
- Figure 49: South America Data Center Market Revenue Share (%), by Country 2024 & 2032
- Figure 50: South America Data Center Market Volume Share (%), by Country 2024 & 2032
- Figure 51: Europe Data Center Market Revenue (Million), by Data Center Size 2024 & 2032
- Figure 52: Europe Data Center Market Volume (K Unit), by Data Center Size 2024 & 2032
- Figure 53: Europe Data Center Market Revenue Share (%), by Data Center Size 2024 & 2032
- Figure 54: Europe Data Center Market Volume Share (%), by Data Center Size 2024 & 2032
- Figure 55: Europe Data Center Market Revenue (Million), by Tier Type 2024 & 2032
- Figure 56: Europe Data Center Market Volume (K Unit), by Tier Type 2024 & 2032
- Figure 57: Europe Data Center Market Revenue Share (%), by Tier Type 2024 & 2032
- Figure 58: Europe Data Center Market Volume Share (%), by Tier Type 2024 & 2032
- Figure 59: Europe Data Center Market Revenue (Million), by Absorption 2024 & 2032
- Figure 60: Europe Data Center Market Volume (K Unit), by Absorption 2024 & 2032
- Figure 61: Europe Data Center Market Revenue Share (%), by Absorption 2024 & 2032
- Figure 62: Europe Data Center Market Volume Share (%), by Absorption 2024 & 2032
- Figure 63: Europe Data Center Market Revenue (Million), by Colocation Type 2024 & 2032
- Figure 64: Europe Data Center Market Volume (K Unit), by Colocation Type 2024 & 2032
- Figure 65: Europe Data Center Market Revenue Share (%), by Colocation Type 2024 & 2032
- Figure 66: Europe Data Center Market Volume Share (%), by Colocation Type 2024 & 2032
- Figure 67: Europe Data Center Market Revenue (Million), by End User 2024 & 2032
- Figure 68: Europe Data Center Market Volume (K Unit), by End User 2024 & 2032
- Figure 69: Europe Data Center Market Revenue Share (%), by End User 2024 & 2032
- Figure 70: Europe Data Center Market Volume Share (%), by End User 2024 & 2032
- Figure 71: Europe Data Center Market Revenue (Million), by Country 2024 & 2032
- Figure 72: Europe Data Center Market Volume (K Unit), by Country 2024 & 2032
- Figure 73: Europe Data Center Market Revenue Share (%), by Country 2024 & 2032
- Figure 74: Europe Data Center Market Volume Share (%), by Country 2024 & 2032
- Figure 75: Middle East & Africa Data Center Market Revenue (Million), by Data Center Size 2024 & 2032
- Figure 76: Middle East & Africa Data Center Market Volume (K Unit), by Data Center Size 2024 & 2032
- Figure 77: Middle East & Africa Data Center Market Revenue Share (%), by Data Center Size 2024 & 2032
- Figure 78: Middle East & Africa Data Center Market Volume Share (%), by Data Center Size 2024 & 2032
- Figure 79: Middle East & Africa Data Center Market Revenue (Million), by Tier Type 2024 & 2032
- Figure 80: Middle East & Africa Data Center Market Volume (K Unit), by Tier Type 2024 & 2032
- Figure 81: Middle East & Africa Data Center Market Revenue Share (%), by Tier Type 2024 & 2032
- Figure 82: Middle East & Africa Data Center Market Volume Share (%), by Tier Type 2024 & 2032
- Figure 83: Middle East & Africa Data Center Market Revenue (Million), by Absorption 2024 & 2032
- Figure 84: Middle East & Africa Data Center Market Volume (K Unit), by Absorption 2024 & 2032
- Figure 85: Middle East & Africa Data Center Market Revenue Share (%), by Absorption 2024 & 2032
- Figure 86: Middle East & Africa Data Center Market Volume Share (%), by Absorption 2024 & 2032
- Figure 87: Middle East & Africa Data Center Market Revenue (Million), by Colocation Type 2024 & 2032
- Figure 88: Middle East & Africa Data Center Market Volume (K Unit), by Colocation Type 2024 & 2032
- Figure 89: Middle East & Africa Data Center Market Revenue Share (%), by Colocation Type 2024 & 2032
- Figure 90: Middle East & Africa Data Center Market Volume Share (%), by Colocation Type 2024 & 2032
- Figure 91: Middle East & Africa Data Center Market Revenue (Million), by End User 2024 & 2032
- Figure 92: Middle East & Africa Data Center Market Volume (K Unit), by End User 2024 & 2032
- Figure 93: Middle East & Africa Data Center Market Revenue Share (%), by End User 2024 & 2032
- Figure 94: Middle East & Africa Data Center Market Volume Share (%), by End User 2024 & 2032
- Figure 95: Middle East & Africa Data Center Market Revenue (Million), by Country 2024 & 2032
- Figure 96: Middle East & Africa Data Center Market Volume (K Unit), by Country 2024 & 2032
- Figure 97: Middle East & Africa Data Center Market Revenue Share (%), by Country 2024 & 2032
- Figure 98: Middle East & Africa Data Center Market Volume Share (%), by Country 2024 & 2032
- Figure 99: Asia Pacific Data Center Market Revenue (Million), by Data Center Size 2024 & 2032
- Figure 100: Asia Pacific Data Center Market Volume (K Unit), by Data Center Size 2024 & 2032
- Figure 101: Asia Pacific Data Center Market Revenue Share (%), by Data Center Size 2024 & 2032
- Figure 102: Asia Pacific Data Center Market Volume Share (%), by Data Center Size 2024 & 2032
- Figure 103: Asia Pacific Data Center Market Revenue (Million), by Tier Type 2024 & 2032
- Figure 104: Asia Pacific Data Center Market Volume (K Unit), by Tier Type 2024 & 2032
- Figure 105: Asia Pacific Data Center Market Revenue Share (%), by Tier Type 2024 & 2032
- Figure 106: Asia Pacific Data Center Market Volume Share (%), by Tier Type 2024 & 2032
- Figure 107: Asia Pacific Data Center Market Revenue (Million), by Absorption 2024 & 2032
- Figure 108: Asia Pacific Data Center Market Volume (K Unit), by Absorption 2024 & 2032
- Figure 109: Asia Pacific Data Center Market Revenue Share (%), by Absorption 2024 & 2032
- Figure 110: Asia Pacific Data Center Market Volume Share (%), by Absorption 2024 & 2032
- Figure 111: Asia Pacific Data Center Market Revenue (Million), by Colocation Type 2024 & 2032
- Figure 112: Asia Pacific Data Center Market Volume (K Unit), by Colocation Type 2024 & 2032
- Figure 113: Asia Pacific Data Center Market Revenue Share (%), by Colocation Type 2024 & 2032
- Figure 114: Asia Pacific Data Center Market Volume Share (%), by Colocation Type 2024 & 2032
- Figure 115: Asia Pacific Data Center Market Revenue (Million), by End User 2024 & 2032
- Figure 116: Asia Pacific Data Center Market Volume (K Unit), by End User 2024 & 2032
- Figure 117: Asia Pacific Data Center Market Revenue Share (%), by End User 2024 & 2032
- Figure 118: Asia Pacific Data Center Market Volume Share (%), by End User 2024 & 2032
- Figure 119: Asia Pacific Data Center Market Revenue (Million), by Country 2024 & 2032
- Figure 120: Asia Pacific Data Center Market Volume (K Unit), by Country 2024 & 2032
- Figure 121: Asia Pacific Data Center Market Revenue Share (%), by Country 2024 & 2032
- Figure 122: Asia Pacific Data Center Market Volume Share (%), by Country 2024 & 2032
List of Tables
- Table 1: Global Data Center Market Revenue Million Forecast, by Region 2019 & 2032
- Table 2: Global Data Center Market Volume K Unit Forecast, by Region 2019 & 2032
- Table 3: Global Data Center Market Revenue Million Forecast, by Data Center Size 2019 & 2032
- Table 4: Global Data Center Market Volume K Unit Forecast, by Data Center Size 2019 & 2032
- Table 5: Global Data Center Market Revenue Million Forecast, by Tier Type 2019 & 2032
- Table 6: Global Data Center Market Volume K Unit Forecast, by Tier Type 2019 & 2032
- Table 7: Global Data Center Market Revenue Million Forecast, by Absorption 2019 & 2032
- Table 8: Global Data Center Market Volume K Unit Forecast, by Absorption 2019 & 2032
- Table 9: Global Data Center Market Revenue Million Forecast, by Colocation Type 2019 & 2032
- Table 10: Global Data Center Market Volume K Unit Forecast, by Colocation Type 2019 & 2032
- Table 11: Global Data Center Market Revenue Million Forecast, by End User 2019 & 2032
- Table 12: Global Data Center Market Volume K Unit Forecast, by End User 2019 & 2032
- Table 13: Global Data Center Market Revenue Million Forecast, by Region 2019 & 2032
- Table 14: Global Data Center Market Volume K Unit Forecast, by Region 2019 & 2032
- Table 15: Global Data Center Market Revenue Million Forecast, by Data Center Size 2019 & 2032
- Table 16: Global Data Center Market Volume K Unit Forecast, by Data Center Size 2019 & 2032
- Table 17: Global Data Center Market Revenue Million Forecast, by Tier Type 2019 & 2032
- Table 18: Global Data Center Market Volume K Unit Forecast, by Tier Type 2019 & 2032
- Table 19: Global Data Center Market Revenue Million Forecast, by Absorption 2019 & 2032
- Table 20: Global Data Center Market Volume K Unit Forecast, by Absorption 2019 & 2032
- Table 21: Global Data Center Market Revenue Million Forecast, by Colocation Type 2019 & 2032
- Table 22: Global Data Center Market Volume K Unit Forecast, by Colocation Type 2019 & 2032
- Table 23: Global Data Center Market Revenue Million Forecast, by End User 2019 & 2032
- Table 24: Global Data Center Market Volume K Unit Forecast, by End User 2019 & 2032
- Table 25: Global Data Center Market Revenue Million Forecast, by Country 2019 & 2032
- Table 26: Global Data Center Market Volume K Unit Forecast, by Country 2019 & 2032
- Table 27: United States Data Center Market Revenue (Million) Forecast, by Application 2019 & 2032
- Table 28: United States Data Center Market Volume (K Unit) Forecast, by Application 2019 & 2032
- Table 29: Canada Data Center Market Revenue (Million) Forecast, by Application 2019 & 2032
- Table 30: Canada Data Center Market Volume (K Unit) Forecast, by Application 2019 & 2032
- Table 31: Mexico Data Center Market Revenue (Million) Forecast, by Application 2019 & 2032
- Table 32: Mexico Data Center Market Volume (K Unit) Forecast, by Application 2019 & 2032
- Table 33: Global Data Center Market Revenue Million Forecast, by Data Center Size 2019 & 2032
- Table 34: Global Data Center Market Volume K Unit Forecast, by Data Center Size 2019 & 2032
- Table 35: Global Data Center Market Revenue Million Forecast, by Tier Type 2019 & 2032
- Table 36: Global Data Center Market Volume K Unit Forecast, by Tier Type 2019 & 2032
- Table 37: Global Data Center Market Revenue Million Forecast, by Absorption 2019 & 2032
- Table 38: Global Data Center Market Volume K Unit Forecast, by Absorption 2019 & 2032
- Table 39: Global Data Center Market Revenue Million Forecast, by Colocation Type 2019 & 2032
- Table 40: Global Data Center Market Volume K Unit Forecast, by Colocation Type 2019 & 2032
- Table 41: Global Data Center Market Revenue Million Forecast, by End User 2019 & 2032
- Table 42: Global Data Center Market Volume K Unit Forecast, by End User 2019 & 2032
- Table 43: Global Data Center Market Revenue Million Forecast, by Country 2019 & 2032
- Table 44: Global Data Center Market Volume K Unit Forecast, by Country 2019 & 2032
- Table 45: Brazil Data Center Market Revenue (Million) Forecast, by Application 2019 & 2032
- Table 46: Brazil Data Center Market Volume (K Unit) Forecast, by Application 2019 & 2032
- Table 47: Argentina Data Center Market Revenue (Million) Forecast, by Application 2019 & 2032
- Table 48: Argentina Data Center Market Volume (K Unit) Forecast, by Application 2019 & 2032
- Table 49: Rest of South America Data Center Market Revenue (Million) Forecast, by Application 2019 & 2032
- Table 50: Rest of South America Data Center Market Volume (K Unit) Forecast, by Application 2019 & 2032
- Table 51: Global Data Center Market Revenue Million Forecast, by Data Center Size 2019 & 2032
- Table 52: Global Data Center Market Volume K Unit Forecast, by Data Center Size 2019 & 2032
- Table 53: Global Data Center Market Revenue Million Forecast, by Tier Type 2019 & 2032
- Table 54: Global Data Center Market Volume K Unit Forecast, by Tier Type 2019 & 2032
- Table 55: Global Data Center Market Revenue Million Forecast, by Absorption 2019 & 2032
- Table 56: Global Data Center Market Volume K Unit Forecast, by Absorption 2019 & 2032
- Table 57: Global Data Center Market Revenue Million Forecast, by Colocation Type 2019 & 2032
- Table 58: Global Data Center Market Volume K Unit Forecast, by Colocation Type 2019 & 2032
- Table 59: Global Data Center Market Revenue Million Forecast, by End User 2019 & 2032
- Table 60: Global Data Center Market Volume K Unit Forecast, by End User 2019 & 2032
- Table 61: Global Data Center Market Revenue Million Forecast, by Country 2019 & 2032
- Table 62: Global Data Center Market Volume K Unit Forecast, by Country 2019 & 2032
- Table 63: United Kingdom Data Center Market Revenue (Million) Forecast, by Application 2019 & 2032
- Table 64: United Kingdom Data Center Market Volume (K Unit) Forecast, by Application 2019 & 2032
- Table 65: Germany Data Center Market Revenue (Million) Forecast, by Application 2019 & 2032
- Table 66: Germany Data Center Market Volume (K Unit) Forecast, by Application 2019 & 2032
- Table 67: France Data Center Market Revenue (Million) Forecast, by Application 2019 & 2032
- Table 68: France Data Center Market Volume (K Unit) Forecast, by Application 2019 & 2032
- Table 69: Italy Data Center Market Revenue (Million) Forecast, by Application 2019 & 2032
- Table 70: Italy Data Center Market Volume (K Unit) Forecast, by Application 2019 & 2032
- Table 71: Spain Data Center Market Revenue (Million) Forecast, by Application 2019 & 2032
- Table 72: Spain Data Center Market Volume (K Unit) Forecast, by Application 2019 & 2032
- Table 73: Russia Data Center Market Revenue (Million) Forecast, by Application 2019 & 2032
- Table 74: Russia Data Center Market Volume (K Unit) Forecast, by Application 2019 & 2032
- Table 75: Benelux Data Center Market Revenue (Million) Forecast, by Application 2019 & 2032
- Table 76: Benelux Data Center Market Volume (K Unit) Forecast, by Application 2019 & 2032
- Table 77: Nordics Data Center Market Revenue (Million) Forecast, by Application 2019 & 2032
- Table 78: Nordics Data Center Market Volume (K Unit) Forecast, by Application 2019 & 2032
- Table 79: Rest of Europe Data Center Market Revenue (Million) Forecast, by Application 2019 & 2032
- Table 80: Rest of Europe Data Center Market Volume (K Unit) Forecast, by Application 2019 & 2032
- Table 81: Global Data Center Market Revenue Million Forecast, by Data Center Size 2019 & 2032
- Table 82: Global Data Center Market Volume K Unit Forecast, by Data Center Size 2019 & 2032
- Table 83: Global Data Center Market Revenue Million Forecast, by Tier Type 2019 & 2032
- Table 84: Global Data Center Market Volume K Unit Forecast, by Tier Type 2019 & 2032
- Table 85: Global Data Center Market Revenue Million Forecast, by Absorption 2019 & 2032
- Table 86: Global Data Center Market Volume K Unit Forecast, by Absorption 2019 & 2032
- Table 87: Global Data Center Market Revenue Million Forecast, by Colocation Type 2019 & 2032
- Table 88: Global Data Center Market Volume K Unit Forecast, by Colocation Type 2019 & 2032
- Table 89: Global Data Center Market Revenue Million Forecast, by End User 2019 & 2032
- Table 90: Global Data Center Market Volume K Unit Forecast, by End User 2019 & 2032
- Table 91: Global Data Center Market Revenue Million Forecast, by Country 2019 & 2032
- Table 92: Global Data Center Market Volume K Unit Forecast, by Country 2019 & 2032
- Table 93: Turkey Data Center Market Revenue (Million) Forecast, by Application 2019 & 2032
- Table 94: Turkey Data Center Market Volume (K Unit) Forecast, by Application 2019 & 2032
- Table 95: Israel Data Center Market Revenue (Million) Forecast, by Application 2019 & 2032
- Table 96: Israel Data Center Market Volume (K Unit) Forecast, by Application 2019 & 2032
- Table 97: GCC Data Center Market Revenue (Million) Forecast, by Application 2019 & 2032
- Table 98: GCC Data Center Market Volume (K Unit) Forecast, by Application 2019 & 2032
- Table 99: North Africa Data Center Market Revenue (Million) Forecast, by Application 2019 & 2032
- Table 100: North Africa Data Center Market Volume (K Unit) Forecast, by Application 2019 & 2032
- Table 101: South Africa Data Center Market Revenue (Million) Forecast, by Application 2019 & 2032
- Table 102: South Africa Data Center Market Volume (K Unit) Forecast, by Application 2019 & 2032
- Table 103: Rest of Middle East & Africa Data Center Market Revenue (Million) Forecast, by Application 2019 & 2032
- Table 104: Rest of Middle East & Africa Data Center Market Volume (K Unit) Forecast, by Application 2019 & 2032
- Table 105: Global Data Center Market Revenue Million Forecast, by Data Center Size 2019 & 2032
- Table 106: Global Data Center Market Volume K Unit Forecast, by Data Center Size 2019 & 2032
- Table 107: Global Data Center Market Revenue Million Forecast, by Tier Type 2019 & 2032
- Table 108: Global Data Center Market Volume K Unit Forecast, by Tier Type 2019 & 2032
- Table 109: Global Data Center Market Revenue Million Forecast, by Absorption 2019 & 2032
- Table 110: Global Data Center Market Volume K Unit Forecast, by Absorption 2019 & 2032
- Table 111: Global Data Center Market Revenue Million Forecast, by Colocation Type 2019 & 2032
- Table 112: Global Data Center Market Volume K Unit Forecast, by Colocation Type 2019 & 2032
- Table 113: Global Data Center Market Revenue Million Forecast, by End User 2019 & 2032
- Table 114: Global Data Center Market Volume K Unit Forecast, by End User 2019 & 2032
- Table 115: Global Data Center Market Revenue Million Forecast, by Country 2019 & 2032
- Table 116: Global Data Center Market Volume K Unit Forecast, by Country 2019 & 2032
- Table 117: China Data Center Market Revenue (Million) Forecast, by Application 2019 & 2032
- Table 118: China Data Center Market Volume (K Unit) Forecast, by Application 2019 & 2032
- Table 119: India Data Center Market Revenue (Million) Forecast, by Application 2019 & 2032
- Table 120: India Data Center Market Volume (K Unit) Forecast, by Application 2019 & 2032
- Table 121: Japan Data Center Market Revenue (Million) Forecast, by Application 2019 & 2032
- Table 122: Japan Data Center Market Volume (K Unit) Forecast, by Application 2019 & 2032
- Table 123: South Korea Data Center Market Revenue (Million) Forecast, by Application 2019 & 2032
- Table 124: South Korea Data Center Market Volume (K Unit) Forecast, by Application 2019 & 2032
- Table 125: ASEAN Data Center Market Revenue (Million) Forecast, by Application 2019 & 2032
- Table 126: ASEAN Data Center Market Volume (K Unit) Forecast, by Application 2019 & 2032
- Table 127: Oceania Data Center Market Revenue (Million) Forecast, by Application 2019 & 2032
- Table 128: Oceania Data Center Market Volume (K Unit) Forecast, by Application 2019 & 2032
- Table 129: Rest of Asia Pacific Data Center Market Revenue (Million) Forecast, by Application 2019 & 2032
- Table 130: Rest of Asia Pacific Data Center Market Volume (K Unit) Forecast, by Application 2019 & 2032
Frequently Asked Questions
1. What is the projected Compound Annual Growth Rate (CAGR) of the Data Center Market?
The projected CAGR is approximately 21.06%.
2. Which companies are prominent players in the Data Center Market?
Key companies in the market include Space DC Pte Ltd, Flexential Corp, Quality Technology Services, Equinix Inc, Vantage Data Centers LLC5 4 LIST OF COMPANIES STUDIE, Cyxtera Technologies, Switch, Digital Realty Trust Inc, CyrusOne Inc, AirTrunk Operating Pty Ltd, Chindata Group Holdings Ltd, NTT Ltd.
3. What are the main segments of the Data Center Market?
The market segments include Data Center Size, Tier Type, Absorption, Colocation Type, End User.
4. Can you provide details about the market size?
The market size is estimated to be USD XX Million as of 2022.
5. What are some drivers contributing to market growth?
Rise of E-Commerce; Flourishing Startup Culture.
6. What are the notable trends driving market growth?
OTHER KEY INDUSTRY TRENDS COVERED IN THE REPORT.
7. Are there any restraints impacting market growth?
Slow Penetration Rate in Developing Countries.
8. Can you provide examples of recent developments in the market?
January 2023: CyrusOne acquired an office complex in Frankfurt, Germany, planning to turn it into a data center campus. The investment group Corum had sold the Europark office complex in Frankfurt for EUR 95 million (USD 102.3 million), before confirming that CyrusOne was the buyer.December 2022: With a USD 160 million data center investment in JOHANNESBURG, Equinix, Inc., a provider of digital infrastructure, wants to expand its presence on the African continent beyond its current locations in NIGERIA, GHANA, and Côte d'Ivoire. In mid-2024, the brand-new data center is anticipated to open in South Africa; JN1, a new 4.0 MW data center, will offer more than 20,000 gross square feet of colocation space and 690+ cabinets. Also, there will be two further phases of development. The fully completed 20.0 MW retail complex will offer more than 100,000 gross square feet of colocation space and 3,450+ cabinets.December 2022: HGC Global Communications has established an agreement with Digital Realty to boost customers’ edge connectivity. Under the agreement, Digital Realty will use edgeX by HGC services for over-the-top (OTT) customers in its three Singapore data centres.
9. What pricing options are available for accessing the report?
Pricing options include single-user, multi-user, and enterprise licenses priced at USD 3800, USD 4500, and USD 5800 respectively.
10. Is the market size provided in terms of value or volume?
The market size is provided in terms of value, measured in Million and volume, measured in K Unit.
11. Are there any specific market keywords associated with the report?
Yes, the market keyword associated with the report is "Data Center Market," which aids in identifying and referencing the specific market segment covered.
12. How do I determine which pricing option suits my needs best?
The pricing options vary based on user requirements and access needs. Individual users may opt for single-user licenses, while businesses requiring broader access may choose multi-user or enterprise licenses for cost-effective access to the report.
13. Are there any additional resources or data provided in the Data Center Market report?
While the report offers comprehensive insights, it's advisable to review the specific contents or supplementary materials provided to ascertain if additional resources or data are available.
14. How can I stay updated on further developments or reports in the Data Center Market?
To stay informed about further developments, trends, and reports in the Data Center Market, consider subscribing to industry newsletters, following relevant companies and organizations, or regularly checking reputable industry news sources and publications.
Methodology
Step 1 - Identification of Relevant Samples Size from Population Database


Step 2 - Approaches for Defining Global Market Size (Value, Volume* & Price*)

Note*: In applicable scenarios
Step 3 - Data Sources
Primary Research
- Web Analytics
- Survey Reports
- Research Institute
- Latest Research Reports
- Opinion Leaders
Secondary Research
- Annual Reports
- White Paper
- Latest Press Release
- Industry Association
- Paid Database
- Investor Presentations

Step 4 - Data Triangulation
Involves using different sources of information in order to increase the validity of a study
These sources are likely to be stakeholders in a program - participants, other researchers, program staff, other community members, and so on.
Then we put all data in single framework & apply various statistical tools to find out the dynamic on the market.
During the analysis stage, feedback from the stakeholder groups would be compared to determine areas of agreement as well as areas of divergence
