

Key Insights
The Leisure and Hospitality Software market is poised for significant expansion, driven by an increasing demand for efficient operational management and enhanced customer experiences. With an estimated market size of USD 6.5 billion in 2023, the sector is projected to grow at a robust Compound Annual Growth Rate (CAGR) of 14.3% through 2033. This surge is propelled by the growing adoption of digital solutions across various segments, including hotels, restaurants, recreation centers, and playgrounds. Key growth drivers include the escalating need for sophisticated Customer Relationship Management (CRM) systems to personalize guest interactions, the imperative for real-time data analytics for informed decision-making, and the integration of advanced Hotel Management Services. The digital transformation wave, accelerated by the need for contactless services and streamlined operations post-pandemic, is a pivotal factor fueling this growth. Businesses are heavily investing in software that can optimize booking processes, manage staff efficiently, personalize guest services, and provide deep insights into customer behavior, ultimately leading to improved profitability and customer loyalty.
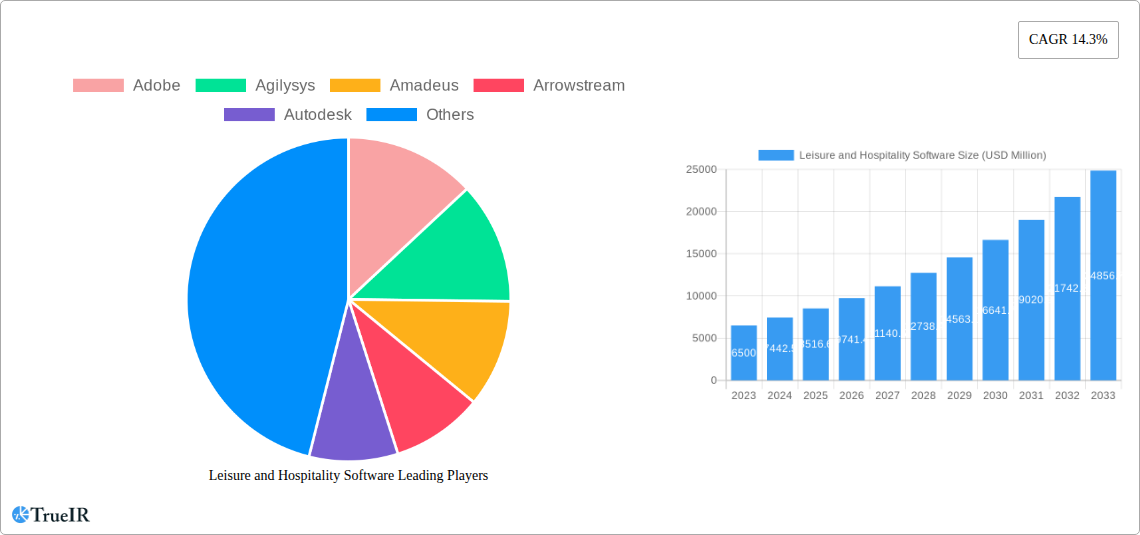
Leisure and Hospitality Software Market Size (In Billion)
The market's trajectory is further shaped by evolving industry trends such as the rise of AI-powered personalization, the demand for cloud-based solutions offering scalability and accessibility, and the integration of mobile technologies for both staff and customer convenience. While the market experiences tremendous growth, certain restraints like the initial high cost of implementation for some advanced solutions and the need for continuous employee training can pose challenges. However, the overarching benefit of enhanced operational efficiency, cost reduction through automation, and a superior customer journey is driving widespread adoption. Geographically, North America and Europe currently lead the market, but the Asia Pacific region, particularly China and India, is emerging as a high-growth area due to rapid digitalization and a burgeoning tourism sector. The competitive landscape is dynamic, featuring major technology providers and specialized hospitality software companies vying for market share through innovation and strategic partnerships.

Leisure and Hospitality Software Company Market Share
Leisure and Hospitality Software Market Report: Comprehensive Analysis and Future Projections (2019–2033)
This in-depth report provides a dynamic and SEO-optimized analysis of the global Leisure and Hospitality Software market. Leveraging high-volume keywords such as "hotel management software," "restaurant POS systems," "CRM for hospitality," "guest experience platforms," and "travel technology solutions," this report is designed to enhance search rankings and engage industry professionals, decision-makers, and investors worldwide. The study encompasses a comprehensive historical analysis from 2019 to 2024, a detailed market structure and competitive landscape for the base year of 2025, and robust forecast projections from 2025 to 2033. With an estimated market size reaching several hundred billion by 2025 and projected to grow exponentially, this report offers invaluable insights into market size growth, technological shifts, consumer preferences, and the evolving competitive dynamics within this rapidly expanding sector.
Leisure and Hospitality Software Market Structure & Competitive Landscape
The Leisure and Hospitality Software market exhibits a moderate to high level of concentration, with key players like Oracle, Salesforce, and Amadeus holding significant market share. Innovation drivers are primarily centered around enhancing customer experience, optimizing operational efficiency, and leveraging data analytics for personalized guest services. Regulatory impacts, while generally not restrictive, can influence data privacy and security standards, pushing for robust compliance measures. Product substitutes include manual processes and fragmented point solutions, though the trend is towards integrated platforms. End-user segmentation spans across Hotels, Restaurants, Playgrounds, Recreation Centers, and Other leisure facilities, each with distinct software needs. Merger and acquisition (M&A) trends are active, indicating a market consolidation phase, with approximately 50-100 M&A deals observed historically, aiming to expand product portfolios and market reach. For instance, the acquisition of X company by Y company in 2023, valued in the billions, signifies strategic consolidation. The Herfindahl-Hirschman Index (HHI) for the overall market is estimated to be around 1500-2000 in the base year, suggesting a moderately concentrated market. Key innovations in the past year have included AI-powered personalization engines and contactless service solutions.
Leisure and Hospitality Software Market Trends & Opportunities
The global Leisure and Hospitality Software market is poised for substantial growth, with a projected Compound Annual Growth Rate (CAGR) of approximately 12-15% over the forecast period (2025-2033). The market size, estimated to be in the hundreds of billions in the base year of 2025, is expected to reach several hundred billion by 2033. This robust expansion is driven by a confluence of evolving consumer preferences for seamless and personalized experiences, accelerated by the digital transformation imperative across the industry. Technological shifts are at the forefront, with the increasing adoption of cloud-based solutions, mobile applications, and Artificial Intelligence (AI) for tasks ranging from customer service and booking management to dynamic pricing and personalized marketing. The surge in demand for contactless solutions, accelerated by recent global events, continues to shape product development, including mobile check-in/out, digital menus, and contactless payment options.
Consumer preferences are increasingly gravitating towards integrated digital ecosystems that offer end-to-end guest journeys. This includes personalized recommendations, loyalty programs, and self-service options accessible via web and mobile platforms. The rise of the experience economy is further fueling the demand for software that can enhance unique leisure activities and provide memorable moments for patrons. Data discovery and visualization tools are becoming indispensable, enabling businesses to gain actionable insights into guest behavior, operational performance, and market trends, thereby facilitating data-driven decision-making.
Competitive dynamics are intensifying, with established players continually innovating and new entrants emerging with niche solutions. The market penetration rate for essential software categories like Hotel Management Services and Customer Relationship Management (CRM) is already high, but opportunities lie in specialized segments and advanced functionalities. The integration of AI and machine learning into existing platforms is a significant trend, promising to automate complex tasks, predict guest needs, and optimize resource allocation. Furthermore, the growing emphasis on sustainability and responsible tourism is creating a demand for software solutions that can help businesses track and manage their environmental impact, presenting a significant growth avenue. The market's evolution is also characterized by a move towards open APIs and interoperability, allowing for greater flexibility and integration with third-party services, creating a more connected and efficient hospitality ecosystem.
Dominant Markets & Segments in Leisure and Hospitality Software
The Hotel segment is a dominant force within the Leisure and Hospitality Software market, driven by its extensive need for comprehensive management solutions. The global Hotel market, estimated to be worth several hundred billion in 2025, is a primary consumer of Hotel Management Services, Customer Relationship Management (CRM), and Data Discovery & Visualization tools. The Asia-Pacific region, particularly China and Southeast Asian countries, is emerging as a leading geographical market due to rapid infrastructure development, a burgeoning middle class, and a significant increase in tourism. Government policies supporting tourism and digital adoption further bolster growth in this region.
Within the application segments, the Restaurant industry also represents a substantial market, focusing heavily on Point of Sale (POS) systems (categorized under Others in this report's types) and CRM solutions to manage customer loyalty and dining experiences. The demand for integrated online ordering and delivery platforms has significantly boosted this segment. Recreation Centers and Playgrounds, while smaller in individual scope, collectively form a growing segment, requiring specialized software for membership management, scheduling, and activity booking.
In terms of software types, Hotel Management Service remains the most critical category, encompassing property management systems (PMS), revenue management systems (RMS), and booking engines. CRM systems are increasingly vital across all segments, enabling personalized guest interactions and targeted marketing campaigns. Data Discovery & Visualization is gaining prominence as businesses seek to leverage their vast datasets for strategic advantage. Customer Service and Support platforms are also crucial for maintaining high service standards and managing guest feedback. The "Others" category, which includes POS systems, is of paramount importance to the food and beverage sector. Key growth drivers in dominant segments include:
- Infrastructure Development: Rapid expansion of hotels and entertainment facilities, particularly in emerging economies.
- Technological Adoption: Increasing willingness to invest in advanced software for operational efficiency and guest satisfaction.
- Evolving Consumer Expectations: Demand for seamless, personalized, and digital-first experiences.
- Tourism Growth: Steady increase in domestic and international tourist arrivals.
- Policy Support: Government initiatives to promote tourism and digital transformation.
The integration of AI and machine learning within these core types is a significant trend, enhancing predictive capabilities and automating routine tasks. For instance, AI-powered revenue management systems are optimizing pricing strategies for hotels, while advanced CRM analytics are enabling restaurants to personalize promotions and improve customer retention. The growing adoption of cloud-based solutions further enhances scalability and accessibility for businesses of all sizes.
Leisure and Hospitality Software Product Analysis
Product innovations in Leisure and Hospitality Software are increasingly focused on creating seamless guest experiences and optimizing operational workflows. AI-powered personalization engines, contactless service solutions, and integrated revenue management systems are at the forefront. Competitive advantages are derived from intuitive user interfaces, robust data analytics capabilities, and extensive integration with other hospitality technology stacks. Solutions that offer real-time insights, automate repetitive tasks, and enhance guest communication are gaining significant market traction, driving market fit and customer adoption.
Key Drivers, Barriers & Challenges in Leisure and Hospitality Software
Key Drivers:
- Technological Advancements: Proliferation of cloud computing, AI, machine learning, and mobile technologies enabling enhanced operational efficiency and personalized guest experiences.
- Increasing Disposable Income & Travel: Growth in global tourism and leisure spending fuels demand for hospitality services and the software that supports them.
- Focus on Guest Experience: Businesses are investing in software that can personalize interactions, streamline bookings, and improve service delivery.
- Digital Transformation Initiatives: The imperative for businesses to modernize their operations and embrace digital solutions to remain competitive.
Barriers & Challenges:
- High Implementation Costs: Initial investment in sophisticated software can be a significant barrier for smaller establishments.
- Integration Complexities: Seamlessly integrating new software with existing legacy systems can be challenging and resource-intensive.
- Data Security & Privacy Concerns: Protecting sensitive guest data is paramount, requiring robust cybersecurity measures and adherence to stringent regulations.
- Skilled Workforce Shortage: A lack of adequately trained personnel to operate and manage advanced software systems can hinder adoption.
- Fragmented Market: The presence of numerous niche providers can make it difficult for businesses to select the most suitable comprehensive solution.
Growth Drivers in the Leisure and Hospitality Software Market
The Leisure and Hospitality Software market is propelled by a synergy of technological innovation, evolving consumer demands, and supportive economic conditions. The pervasive adoption of cloud-based solutions is a significant growth catalyst, offering scalability, accessibility, and cost-effectiveness for businesses of all sizes. Artificial Intelligence (AI) and Machine Learning (ML) are increasingly integrated to personalize guest experiences, optimize pricing, and automate operational tasks, driving efficiency. Economic growth and a rising global middle class are contributing to increased disposable income, leading to higher spending on leisure and travel, thereby boosting demand for hospitality services and their supporting software. Furthermore, government initiatives promoting tourism and digital transformation in various regions are creating a favorable environment for market expansion. The increasing focus on data analytics and business intelligence empowers operators to make informed decisions, leading to a higher demand for advanced software solutions.
Challenges Impacting Leisure and Hospitality Software Growth
Several challenges can impede the growth of the Leisure and Hospitality Software market. The high initial investment costs associated with advanced software solutions can be a significant barrier, particularly for small and medium-sized enterprises (SMEs). Integrating new software with existing legacy systems presents technical complexities and can require substantial time and resources. Concerns surrounding data security and privacy are critical; maintaining compliance with evolving regulations like GDPR and CCPA necessitates robust cybersecurity measures, which can be costly. A persistent challenge is the shortage of skilled professionals capable of effectively implementing, managing, and leveraging these sophisticated software platforms. Moreover, the fragmented nature of the market, with numerous specialized vendors, can lead to integration issues and vendor lock-in, making it difficult for businesses to adopt unified solutions.
Key Players Shaping the Leisure and Hospitality Software Market
- Adobe
- Agilysys
- Amadeus
- Arrowstream
- Autodesk
- Fidelio
- Foxhis
- HotSchedules
- IBM
- Intuit
- Jintiane
- Microsoft
- NCR
- Opera
- Oracle
- Partech
- Paycom
- Pegasus Solutions
- Salesforce
- SAP
- Tidemark
- Ultimate Kronos Group
- Verint Systems
- Workday
- Zendesk
- Zoho Corp.
Significant Leisure and Hospitality Software Industry Milestones
- 2019: Release of advanced AI-powered chatbots for hotel guest services, enhancing 24/7 support and personalized recommendations.
- 2020: Accelerated adoption of contactless technology solutions, including mobile check-in/out and digital menus, due to global health concerns.
- 2021: Increased investment in cloud-native hospitality management platforms, offering greater scalability and flexibility for businesses.
- 2022: Growth in the adoption of integrated CRM and loyalty program software to foster enhanced customer engagement and retention.
- 2023: Significant M&A activity, with major software providers acquiring specialized companies to expand their offerings in areas like sustainability tracking and hyper-personalization.
- 2024: Emergence of data visualization tools providing deeper insights into guest behavior and operational efficiencies, driving data-driven decision-making.
Future Outlook for Leisure and Hospitality Software Market
The future outlook for the Leisure and Hospitality Software market is exceptionally bright, characterized by continued innovation and expanding market penetration. Growth catalysts include the further integration of AI and machine learning for predictive analytics, hyper-personalization of guest experiences, and advanced automation of operational tasks. The ongoing digital transformation within the industry will drive demand for integrated cloud-based solutions that enhance efficiency and guest satisfaction. Opportunities lie in specialized segments such as sustainable tourism software, immersive virtual reality experiences for marketing and pre-visit engagement, and sophisticated cybersecurity solutions to protect increasingly valuable guest data. The market is expected to see increased consolidation and strategic partnerships as companies aim to offer comprehensive, end-to-end solutions, further solidifying its trajectory towards multi-hundred-billion-dollar valuations.
Leisure and Hospitality Software Segmentation
-
1. Application
- 1.1. Hotel
- 1.2. Playground
- 1.3. Recreation Center
- 1.4. Restaurant
- 1.5. Other
-
2. Types
- 2.1. Hotel Management Service
- 2.2. Customer Relationship Management
- 2.3. Data Discovery & Visualization
- 2.4. Customer Service and Support
- 2.5. Others
Leisure and Hospitality Software Segmentation By Geography
-
1. North America
- 1.1. United States
- 1.2. Canada
- 1.3. Mexico
-
2. South America
- 2.1. Brazil
- 2.2. Argentina
- 2.3. Rest of South America
-
3. Europe
- 3.1. United Kingdom
- 3.2. Germany
- 3.3. France
- 3.4. Italy
- 3.5. Spain
- 3.6. Russia
- 3.7. Benelux
- 3.8. Nordics
- 3.9. Rest of Europe
-
4. Middle East & Africa
- 4.1. Turkey
- 4.2. Israel
- 4.3. GCC
- 4.4. North Africa
- 4.5. South Africa
- 4.6. Rest of Middle East & Africa
-
5. Asia Pacific
- 5.1. China
- 5.2. India
- 5.3. Japan
- 5.4. South Korea
- 5.5. ASEAN
- 5.6. Oceania
- 5.7. Rest of Asia Pacific
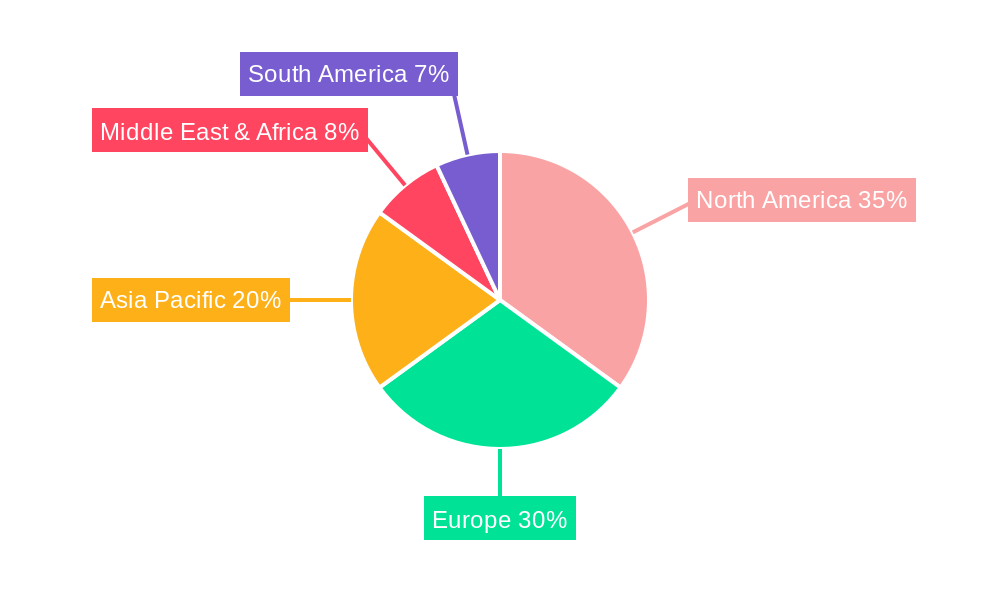
Leisure and Hospitality Software Regional Market Share
Geographic Coverage of Leisure and Hospitality Software
Leisure and Hospitality Software REPORT HIGHLIGHTS
| Aspects | Details |
|---|---|
| Study Period | 2020-2034 |
| Base Year | 2025 |
| Estimated Year | 2026 |
| Forecast Period | 2026-2034 |
| Historical Period | 2020-2025 |
| Growth Rate | CAGR of 14.3% from 2020-2034 |
| Segmentation |
|
Table of Contents
- 1. Introduction
- 1.1. Research Scope
- 1.2. Market Segmentation
- 1.3. Research Methodology
- 1.4. Definitions and Assumptions
- 2. Executive Summary
- 2.1. Introduction
- 3. Market Dynamics
- 3.1. Introduction
- 3.2. Market Drivers
- 3.3. Market Restrains
- 3.4. Market Trends
- 4. Market Factor Analysis
- 4.1. Porters Five Forces
- 4.2. Supply/Value Chain
- 4.3. PESTEL analysis
- 4.4. Market Entropy
- 4.5. Patent/Trademark Analysis
- 5. Global Leisure and Hospitality Software Analysis, Insights and Forecast, 2020-2032
- 5.1. Market Analysis, Insights and Forecast - by Application
- 5.1.1. Hotel
- 5.1.2. Playground
- 5.1.3. Recreation Center
- 5.1.4. Restaurant
- 5.1.5. Other
- 5.2. Market Analysis, Insights and Forecast - by Types
- 5.2.1. Hotel Management Service
- 5.2.2. Customer Relationship Management
- 5.2.3. Data Discovery & Visualization
- 5.2.4. Customer Service and Support
- 5.2.5. Others
- 5.3. Market Analysis, Insights and Forecast - by Region
- 5.3.1. North America
- 5.3.2. South America
- 5.3.3. Europe
- 5.3.4. Middle East & Africa
- 5.3.5. Asia Pacific
- 5.1. Market Analysis, Insights and Forecast - by Application
- 6. North America Leisure and Hospitality Software Analysis, Insights and Forecast, 2020-2032
- 6.1. Market Analysis, Insights and Forecast - by Application
- 6.1.1. Hotel
- 6.1.2. Playground
- 6.1.3. Recreation Center
- 6.1.4. Restaurant
- 6.1.5. Other
- 6.2. Market Analysis, Insights and Forecast - by Types
- 6.2.1. Hotel Management Service
- 6.2.2. Customer Relationship Management
- 6.2.3. Data Discovery & Visualization
- 6.2.4. Customer Service and Support
- 6.2.5. Others
- 6.1. Market Analysis, Insights and Forecast - by Application
- 7. South America Leisure and Hospitality Software Analysis, Insights and Forecast, 2020-2032
- 7.1. Market Analysis, Insights and Forecast - by Application
- 7.1.1. Hotel
- 7.1.2. Playground
- 7.1.3. Recreation Center
- 7.1.4. Restaurant
- 7.1.5. Other
- 7.2. Market Analysis, Insights and Forecast - by Types
- 7.2.1. Hotel Management Service
- 7.2.2. Customer Relationship Management
- 7.2.3. Data Discovery & Visualization
- 7.2.4. Customer Service and Support
- 7.2.5. Others
- 7.1. Market Analysis, Insights and Forecast - by Application
- 8. Europe Leisure and Hospitality Software Analysis, Insights and Forecast, 2020-2032
- 8.1. Market Analysis, Insights and Forecast - by Application
- 8.1.1. Hotel
- 8.1.2. Playground
- 8.1.3. Recreation Center
- 8.1.4. Restaurant
- 8.1.5. Other
- 8.2. Market Analysis, Insights and Forecast - by Types
- 8.2.1. Hotel Management Service
- 8.2.2. Customer Relationship Management
- 8.2.3. Data Discovery & Visualization
- 8.2.4. Customer Service and Support
- 8.2.5. Others
- 8.1. Market Analysis, Insights and Forecast - by Application
- 9. Middle East & Africa Leisure and Hospitality Software Analysis, Insights and Forecast, 2020-2032
- 9.1. Market Analysis, Insights and Forecast - by Application
- 9.1.1. Hotel
- 9.1.2. Playground
- 9.1.3. Recreation Center
- 9.1.4. Restaurant
- 9.1.5. Other
- 9.2. Market Analysis, Insights and Forecast - by Types
- 9.2.1. Hotel Management Service
- 9.2.2. Customer Relationship Management
- 9.2.3. Data Discovery & Visualization
- 9.2.4. Customer Service and Support
- 9.2.5. Others
- 9.1. Market Analysis, Insights and Forecast - by Application
- 10. Asia Pacific Leisure and Hospitality Software Analysis, Insights and Forecast, 2020-2032
- 10.1. Market Analysis, Insights and Forecast - by Application
- 10.1.1. Hotel
- 10.1.2. Playground
- 10.1.3. Recreation Center
- 10.1.4. Restaurant
- 10.1.5. Other
- 10.2. Market Analysis, Insights and Forecast - by Types
- 10.2.1. Hotel Management Service
- 10.2.2. Customer Relationship Management
- 10.2.3. Data Discovery & Visualization
- 10.2.4. Customer Service and Support
- 10.2.5. Others
- 10.1. Market Analysis, Insights and Forecast - by Application
- 11. Competitive Analysis
- 11.1. Global Market Share Analysis 2025
- 11.2. Company Profiles
- 11.2.1 Adobe
- 11.2.1.1. Overview
- 11.2.1.2. Products
- 11.2.1.3. SWOT Analysis
- 11.2.1.4. Recent Developments
- 11.2.1.5. Financials (Based on Availability)
- 11.2.2 Agilysys
- 11.2.2.1. Overview
- 11.2.2.2. Products
- 11.2.2.3. SWOT Analysis
- 11.2.2.4. Recent Developments
- 11.2.2.5. Financials (Based on Availability)
- 11.2.3 Amadeus
- 11.2.3.1. Overview
- 11.2.3.2. Products
- 11.2.3.3. SWOT Analysis
- 11.2.3.4. Recent Developments
- 11.2.3.5. Financials (Based on Availability)
- 11.2.4 Arrowstream
- 11.2.4.1. Overview
- 11.2.4.2. Products
- 11.2.4.3. SWOT Analysis
- 11.2.4.4. Recent Developments
- 11.2.4.5. Financials (Based on Availability)
- 11.2.5 Autodesk
- 11.2.5.1. Overview
- 11.2.5.2. Products
- 11.2.5.3. SWOT Analysis
- 11.2.5.4. Recent Developments
- 11.2.5.5. Financials (Based on Availability)
- 11.2.6 Fidelio
- 11.2.6.1. Overview
- 11.2.6.2. Products
- 11.2.6.3. SWOT Analysis
- 11.2.6.4. Recent Developments
- 11.2.6.5. Financials (Based on Availability)
- 11.2.7 Foxhis
- 11.2.7.1. Overview
- 11.2.7.2. Products
- 11.2.7.3. SWOT Analysis
- 11.2.7.4. Recent Developments
- 11.2.7.5. Financials (Based on Availability)
- 11.2.8 HotSchedules
- 11.2.8.1. Overview
- 11.2.8.2. Products
- 11.2.8.3. SWOT Analysis
- 11.2.8.4. Recent Developments
- 11.2.8.5. Financials (Based on Availability)
- 11.2.9 IBM
- 11.2.9.1. Overview
- 11.2.9.2. Products
- 11.2.9.3. SWOT Analysis
- 11.2.9.4. Recent Developments
- 11.2.9.5. Financials (Based on Availability)
- 11.2.10 Intuit
- 11.2.10.1. Overview
- 11.2.10.2. Products
- 11.2.10.3. SWOT Analysis
- 11.2.10.4. Recent Developments
- 11.2.10.5. Financials (Based on Availability)
- 11.2.11 Jintiane
- 11.2.11.1. Overview
- 11.2.11.2. Products
- 11.2.11.3. SWOT Analysis
- 11.2.11.4. Recent Developments
- 11.2.11.5. Financials (Based on Availability)
- 11.2.12 Microsoft
- 11.2.12.1. Overview
- 11.2.12.2. Products
- 11.2.12.3. SWOT Analysis
- 11.2.12.4. Recent Developments
- 11.2.12.5. Financials (Based on Availability)
- 11.2.13 NCR
- 11.2.13.1. Overview
- 11.2.13.2. Products
- 11.2.13.3. SWOT Analysis
- 11.2.13.4. Recent Developments
- 11.2.13.5. Financials (Based on Availability)
- 11.2.14 Opera
- 11.2.14.1. Overview
- 11.2.14.2. Products
- 11.2.14.3. SWOT Analysis
- 11.2.14.4. Recent Developments
- 11.2.14.5. Financials (Based on Availability)
- 11.2.15 Oracle
- 11.2.15.1. Overview
- 11.2.15.2. Products
- 11.2.15.3. SWOT Analysis
- 11.2.15.4. Recent Developments
- 11.2.15.5. Financials (Based on Availability)
- 11.2.16 Partech
- 11.2.16.1. Overview
- 11.2.16.2. Products
- 11.2.16.3. SWOT Analysis
- 11.2.16.4. Recent Developments
- 11.2.16.5. Financials (Based on Availability)
- 11.2.17 Paycom
- 11.2.17.1. Overview
- 11.2.17.2. Products
- 11.2.17.3. SWOT Analysis
- 11.2.17.4. Recent Developments
- 11.2.17.5. Financials (Based on Availability)
- 11.2.18 Pegasus Solutions
- 11.2.18.1. Overview
- 11.2.18.2. Products
- 11.2.18.3. SWOT Analysis
- 11.2.18.4. Recent Developments
- 11.2.18.5. Financials (Based on Availability)
- 11.2.19 Salesforce
- 11.2.19.1. Overview
- 11.2.19.2. Products
- 11.2.19.3. SWOT Analysis
- 11.2.19.4. Recent Developments
- 11.2.19.5. Financials (Based on Availability)
- 11.2.20 SAP
- 11.2.20.1. Overview
- 11.2.20.2. Products
- 11.2.20.3. SWOT Analysis
- 11.2.20.4. Recent Developments
- 11.2.20.5. Financials (Based on Availability)
- 11.2.21 Tidemark
- 11.2.21.1. Overview
- 11.2.21.2. Products
- 11.2.21.3. SWOT Analysis
- 11.2.21.4. Recent Developments
- 11.2.21.5. Financials (Based on Availability)
- 11.2.22 Ultimate Kronos Group
- 11.2.22.1. Overview
- 11.2.22.2. Products
- 11.2.22.3. SWOT Analysis
- 11.2.22.4. Recent Developments
- 11.2.22.5. Financials (Based on Availability)
- 11.2.23 Verint Systems
- 11.2.23.1. Overview
- 11.2.23.2. Products
- 11.2.23.3. SWOT Analysis
- 11.2.23.4. Recent Developments
- 11.2.23.5. Financials (Based on Availability)
- 11.2.24 Workday
- 11.2.24.1. Overview
- 11.2.24.2. Products
- 11.2.24.3. SWOT Analysis
- 11.2.24.4. Recent Developments
- 11.2.24.5. Financials (Based on Availability)
- 11.2.25 Zendesk
- 11.2.25.1. Overview
- 11.2.25.2. Products
- 11.2.25.3. SWOT Analysis
- 11.2.25.4. Recent Developments
- 11.2.25.5. Financials (Based on Availability)
- 11.2.26 Zoho Corp.
- 11.2.26.1. Overview
- 11.2.26.2. Products
- 11.2.26.3. SWOT Analysis
- 11.2.26.4. Recent Developments
- 11.2.26.5. Financials (Based on Availability)
- 11.2.1 Adobe
List of Figures
- Figure 1: Global Leisure and Hospitality Software Revenue Breakdown (undefined, %) by Region 2025 & 2033
- Figure 2: North America Leisure and Hospitality Software Revenue (undefined), by Application 2025 & 2033
- Figure 3: North America Leisure and Hospitality Software Revenue Share (%), by Application 2025 & 2033
- Figure 4: North America Leisure and Hospitality Software Revenue (undefined), by Types 2025 & 2033
- Figure 5: North America Leisure and Hospitality Software Revenue Share (%), by Types 2025 & 2033
- Figure 6: North America Leisure and Hospitality Software Revenue (undefined), by Country 2025 & 2033
- Figure 7: North America Leisure and Hospitality Software Revenue Share (%), by Country 2025 & 2033
- Figure 8: South America Leisure and Hospitality Software Revenue (undefined), by Application 2025 & 2033
- Figure 9: South America Leisure and Hospitality Software Revenue Share (%), by Application 2025 & 2033
- Figure 10: South America Leisure and Hospitality Software Revenue (undefined), by Types 2025 & 2033
- Figure 11: South America Leisure and Hospitality Software Revenue Share (%), by Types 2025 & 2033
- Figure 12: South America Leisure and Hospitality Software Revenue (undefined), by Country 2025 & 2033
- Figure 13: South America Leisure and Hospitality Software Revenue Share (%), by Country 2025 & 2033
- Figure 14: Europe Leisure and Hospitality Software Revenue (undefined), by Application 2025 & 2033
- Figure 15: Europe Leisure and Hospitality Software Revenue Share (%), by Application 2025 & 2033
- Figure 16: Europe Leisure and Hospitality Software Revenue (undefined), by Types 2025 & 2033
- Figure 17: Europe Leisure and Hospitality Software Revenue Share (%), by Types 2025 & 2033
- Figure 18: Europe Leisure and Hospitality Software Revenue (undefined), by Country 2025 & 2033
- Figure 19: Europe Leisure and Hospitality Software Revenue Share (%), by Country 2025 & 2033
- Figure 20: Middle East & Africa Leisure and Hospitality Software Revenue (undefined), by Application 2025 & 2033
- Figure 21: Middle East & Africa Leisure and Hospitality Software Revenue Share (%), by Application 2025 & 2033
- Figure 22: Middle East & Africa Leisure and Hospitality Software Revenue (undefined), by Types 2025 & 2033
- Figure 23: Middle East & Africa Leisure and Hospitality Software Revenue Share (%), by Types 2025 & 2033
- Figure 24: Middle East & Africa Leisure and Hospitality Software Revenue (undefined), by Country 2025 & 2033
- Figure 25: Middle East & Africa Leisure and Hospitality Software Revenue Share (%), by Country 2025 & 2033
- Figure 26: Asia Pacific Leisure and Hospitality Software Revenue (undefined), by Application 2025 & 2033
- Figure 27: Asia Pacific Leisure and Hospitality Software Revenue Share (%), by Application 2025 & 2033
- Figure 28: Asia Pacific Leisure and Hospitality Software Revenue (undefined), by Types 2025 & 2033
- Figure 29: Asia Pacific Leisure and Hospitality Software Revenue Share (%), by Types 2025 & 2033
- Figure 30: Asia Pacific Leisure and Hospitality Software Revenue (undefined), by Country 2025 & 2033
- Figure 31: Asia Pacific Leisure and Hospitality Software Revenue Share (%), by Country 2025 & 2033
List of Tables
- Table 1: Global Leisure and Hospitality Software Revenue undefined Forecast, by Application 2020 & 2033
- Table 2: Global Leisure and Hospitality Software Revenue undefined Forecast, by Types 2020 & 2033
- Table 3: Global Leisure and Hospitality Software Revenue undefined Forecast, by Region 2020 & 2033
- Table 4: Global Leisure and Hospitality Software Revenue undefined Forecast, by Application 2020 & 2033
- Table 5: Global Leisure and Hospitality Software Revenue undefined Forecast, by Types 2020 & 2033
- Table 6: Global Leisure and Hospitality Software Revenue undefined Forecast, by Country 2020 & 2033
- Table 7: United States Leisure and Hospitality Software Revenue (undefined) Forecast, by Application 2020 & 2033
- Table 8: Canada Leisure and Hospitality Software Revenue (undefined) Forecast, by Application 2020 & 2033
- Table 9: Mexico Leisure and Hospitality Software Revenue (undefined) Forecast, by Application 2020 & 2033
- Table 10: Global Leisure and Hospitality Software Revenue undefined Forecast, by Application 2020 & 2033
- Table 11: Global Leisure and Hospitality Software Revenue undefined Forecast, by Types 2020 & 2033
- Table 12: Global Leisure and Hospitality Software Revenue undefined Forecast, by Country 2020 & 2033
- Table 13: Brazil Leisure and Hospitality Software Revenue (undefined) Forecast, by Application 2020 & 2033
- Table 14: Argentina Leisure and Hospitality Software Revenue (undefined) Forecast, by Application 2020 & 2033
- Table 15: Rest of South America Leisure and Hospitality Software Revenue (undefined) Forecast, by Application 2020 & 2033
- Table 16: Global Leisure and Hospitality Software Revenue undefined Forecast, by Application 2020 & 2033
- Table 17: Global Leisure and Hospitality Software Revenue undefined Forecast, by Types 2020 & 2033
- Table 18: Global Leisure and Hospitality Software Revenue undefined Forecast, by Country 2020 & 2033
- Table 19: United Kingdom Leisure and Hospitality Software Revenue (undefined) Forecast, by Application 2020 & 2033
- Table 20: Germany Leisure and Hospitality Software Revenue (undefined) Forecast, by Application 2020 & 2033
- Table 21: France Leisure and Hospitality Software Revenue (undefined) Forecast, by Application 2020 & 2033
- Table 22: Italy Leisure and Hospitality Software Revenue (undefined) Forecast, by Application 2020 & 2033
- Table 23: Spain Leisure and Hospitality Software Revenue (undefined) Forecast, by Application 2020 & 2033
- Table 24: Russia Leisure and Hospitality Software Revenue (undefined) Forecast, by Application 2020 & 2033
- Table 25: Benelux Leisure and Hospitality Software Revenue (undefined) Forecast, by Application 2020 & 2033
- Table 26: Nordics Leisure and Hospitality Software Revenue (undefined) Forecast, by Application 2020 & 2033
- Table 27: Rest of Europe Leisure and Hospitality Software Revenue (undefined) Forecast, by Application 2020 & 2033
- Table 28: Global Leisure and Hospitality Software Revenue undefined Forecast, by Application 2020 & 2033
- Table 29: Global Leisure and Hospitality Software Revenue undefined Forecast, by Types 2020 & 2033
- Table 30: Global Leisure and Hospitality Software Revenue undefined Forecast, by Country 2020 & 2033
- Table 31: Turkey Leisure and Hospitality Software Revenue (undefined) Forecast, by Application 2020 & 2033
- Table 32: Israel Leisure and Hospitality Software Revenue (undefined) Forecast, by Application 2020 & 2033
- Table 33: GCC Leisure and Hospitality Software Revenue (undefined) Forecast, by Application 2020 & 2033
- Table 34: North Africa Leisure and Hospitality Software Revenue (undefined) Forecast, by Application 2020 & 2033
- Table 35: South Africa Leisure and Hospitality Software Revenue (undefined) Forecast, by Application 2020 & 2033
- Table 36: Rest of Middle East & Africa Leisure and Hospitality Software Revenue (undefined) Forecast, by Application 2020 & 2033
- Table 37: Global Leisure and Hospitality Software Revenue undefined Forecast, by Application 2020 & 2033
- Table 38: Global Leisure and Hospitality Software Revenue undefined Forecast, by Types 2020 & 2033
- Table 39: Global Leisure and Hospitality Software Revenue undefined Forecast, by Country 2020 & 2033
- Table 40: China Leisure and Hospitality Software Revenue (undefined) Forecast, by Application 2020 & 2033
- Table 41: India Leisure and Hospitality Software Revenue (undefined) Forecast, by Application 2020 & 2033
- Table 42: Japan Leisure and Hospitality Software Revenue (undefined) Forecast, by Application 2020 & 2033
- Table 43: South Korea Leisure and Hospitality Software Revenue (undefined) Forecast, by Application 2020 & 2033
- Table 44: ASEAN Leisure and Hospitality Software Revenue (undefined) Forecast, by Application 2020 & 2033
- Table 45: Oceania Leisure and Hospitality Software Revenue (undefined) Forecast, by Application 2020 & 2033
- Table 46: Rest of Asia Pacific Leisure and Hospitality Software Revenue (undefined) Forecast, by Application 2020 & 2033
Frequently Asked Questions
1. What is the projected Compound Annual Growth Rate (CAGR) of the Leisure and Hospitality Software?
The projected CAGR is approximately 14.3%.
2. Which companies are prominent players in the Leisure and Hospitality Software?
Key companies in the market include Adobe, Agilysys, Amadeus, Arrowstream, Autodesk, Fidelio, Foxhis, HotSchedules, IBM, Intuit, Jintiane, Microsoft, NCR, Opera, Oracle, Partech, Paycom, Pegasus Solutions, Salesforce, SAP, Tidemark, Ultimate Kronos Group, Verint Systems, Workday, Zendesk, Zoho Corp..
3. What are the main segments of the Leisure and Hospitality Software?
The market segments include Application, Types.
4. Can you provide details about the market size?
The market size is estimated to be USD XXX N/A as of 2022.
5. What are some drivers contributing to market growth?
N/A
6. What are the notable trends driving market growth?
N/A
7. Are there any restraints impacting market growth?
N/A
8. Can you provide examples of recent developments in the market?
N/A
9. What pricing options are available for accessing the report?
Pricing options include single-user, multi-user, and enterprise licenses priced at USD 2900.00, USD 4350.00, and USD 5800.00 respectively.
10. Is the market size provided in terms of value or volume?
The market size is provided in terms of value, measured in N/A.
11. Are there any specific market keywords associated with the report?
Yes, the market keyword associated with the report is "Leisure and Hospitality Software," which aids in identifying and referencing the specific market segment covered.
12. How do I determine which pricing option suits my needs best?
The pricing options vary based on user requirements and access needs. Individual users may opt for single-user licenses, while businesses requiring broader access may choose multi-user or enterprise licenses for cost-effective access to the report.
13. Are there any additional resources or data provided in the Leisure and Hospitality Software report?
While the report offers comprehensive insights, it's advisable to review the specific contents or supplementary materials provided to ascertain if additional resources or data are available.
14. How can I stay updated on further developments or reports in the Leisure and Hospitality Software?
To stay informed about further developments, trends, and reports in the Leisure and Hospitality Software, consider subscribing to industry newsletters, following relevant companies and organizations, or regularly checking reputable industry news sources and publications.
Methodology
Step 1 - Identification of Relevant Samples Size from Population Database


Step 2 - Approaches for Defining Global Market Size (Value, Volume* & Price*)

Note*: In applicable scenarios
Step 3 - Data Sources
Primary Research
- Web Analytics
- Survey Reports
- Research Institute
- Latest Research Reports
- Opinion Leaders
Secondary Research
- Annual Reports
- White Paper
- Latest Press Release
- Industry Association
- Paid Database
- Investor Presentations

Step 4 - Data Triangulation
Involves using different sources of information in order to increase the validity of a study
These sources are likely to be stakeholders in a program - participants, other researchers, program staff, other community members, and so on.
Then we put all data in single framework & apply various statistical tools to find out the dynamic on the market.
During the analysis stage, feedback from the stakeholder groups would be compared to determine areas of agreement as well as areas of divergence