

Key Insights
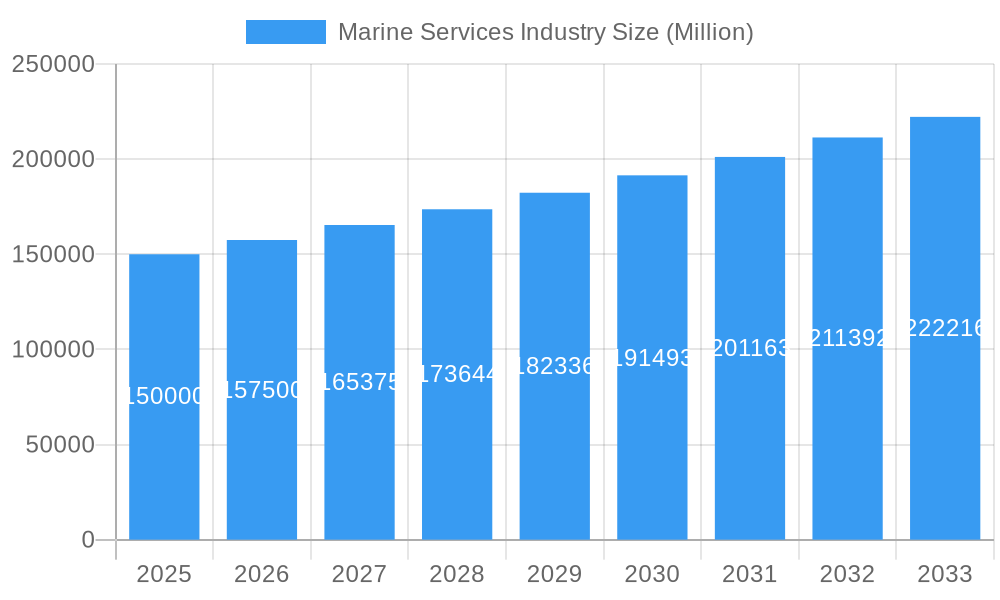
The global marine services industry is experiencing robust growth, projected to maintain a Compound Annual Growth Rate (CAGR) exceeding 5% from 2025 to 2033. This expansion is driven by several key factors. Increasing global trade volumes necessitate efficient port operations and robust container handling services, fueling demand for specialized equipment and expertise. The aging global fleet also necessitates significant investment in ship repair and maintenance, contributing significantly to market growth. Furthermore, the growing adoption of advanced technologies, such as digitalization and automation in port operations and supply chain management, is streamlining processes and boosting efficiency, thereby stimulating market expansion. The rising complexity of global supply chains is also creating opportunities for specialized logistics solutions and integrated services providers. Significant regional variations exist, with Asia-Pacific, driven by its substantial port infrastructure and burgeoning trade activities, expected to hold a dominant market share. North America and Europe, while mature markets, will continue to contribute significantly, driven by ongoing investments in port modernization and infrastructure upgrades.
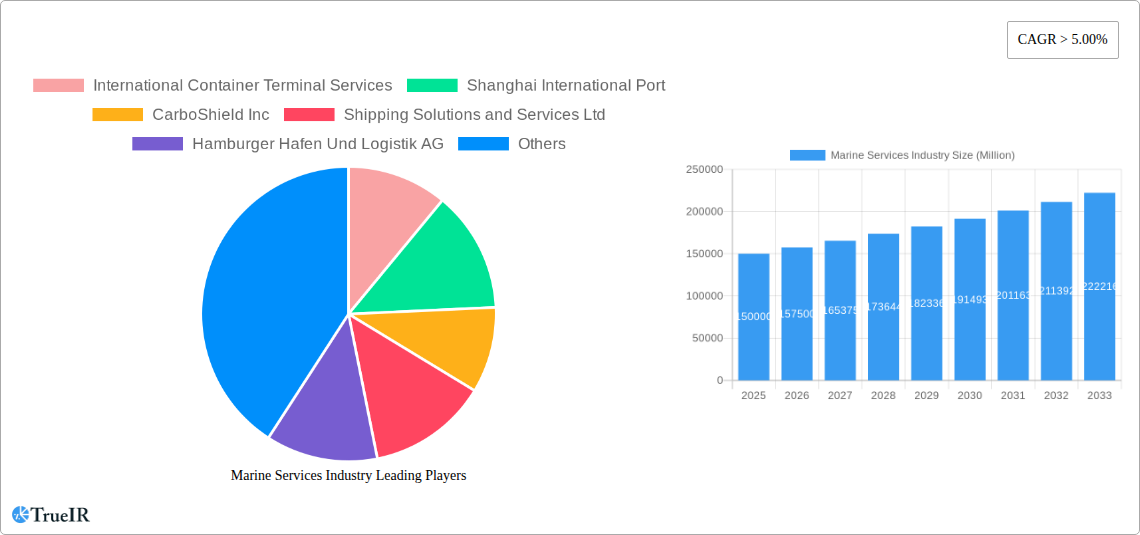
Marine Services Industry Market Size (In Billion)
The industry's segmentation reveals a diverse landscape. Container handling services represent a major segment, encompassing terminal operations, cargo handling, and related activities. Ship repair and maintenance is another crucial area, fueled by the need for regular upkeep and upgrades of vessels. Supply chain management solutions, including logistics planning, inventory management, and freight forwarding, are gaining traction due to the increasing emphasis on efficiency and cost optimization. Mechanical and electrical engineering services are essential for the maintenance and repair of vessels and port equipment. Navigation services, encompassing charting, positioning, and communication technologies, are critical for safe and efficient maritime operations. Finally, the demand for integrated logistics solutions, offering end-to-end supply chain management capabilities, continues to increase. Leading players like International Container Terminal Services, DP World Limited, and AP Moller Maersk are driving innovation and consolidating market share through strategic investments and acquisitions. However, challenges such as fluctuating fuel prices, geopolitical instability, and environmental regulations pose potential restraints to market growth.
Marine Services Industry Company Market Share
Marine Services Industry Market Report: 2019-2033
This comprehensive report provides a detailed analysis of the global marine services industry, encompassing market size, segmentation, competitive landscape, key players, and future growth projections from 2019 to 2033. With a base year of 2025 and a forecast period extending to 2033, this report is an invaluable resource for industry stakeholders, investors, and strategists seeking to navigate this dynamic sector. The report leverages millions in market value data across all segments and examines major milestones, including significant M&A activity and substantial infrastructural investments.
Marine Services Industry Market Structure & Competitive Landscape
The marine services industry exhibits a moderately concentrated market structure, with a handful of multinational giants commanding significant market share. Concentration ratios, while varying across segments, suggest a degree of oligopoly in areas like container handling and global logistics. Key drivers of innovation include automation, digitalization (e.g., IoT, AI), and the pursuit of enhanced operational efficiency. Regulatory impacts, particularly concerning environmental regulations (e.g., IMO 2020) and safety standards, significantly influence operational costs and investment strategies. Product substitutes, such as alternative transportation modes (rail, road), pose a competitive threat, especially for shorter distances. The industry’s end-user segmentation is broad, encompassing shipping lines, port authorities, energy companies, and various government entities. M&A activity has been significant in recent years, with over USD xx million in transactions recorded between 2019 and 2024, driven by efforts to consolidate market share, expand geographical reach, and enhance service offerings.
- Market Concentration: High in container handling, moderate in other segments. CR4 (Concentration Ratio of top 4 firms) estimated at xx%.
- Innovation Drivers: Automation, AI, IoT, sustainable solutions.
- Regulatory Impacts: Stringent environmental and safety regulations impacting costs.
- Product Substitutes: Rail, road transport, impacting market share in certain segments.
- End-User Segmentation: Shipping lines, port authorities, energy companies, government.
- M&A Trends: Significant consolidation; USD xx million in deals from 2019-2024.
Marine Services Industry Market Trends & Opportunities
The global marine services market is experiencing robust growth, projected to reach USD xx million by 2033, exhibiting a Compound Annual Growth Rate (CAGR) of xx% during the forecast period (2025-2033). This growth is fueled by increasing global trade volumes, expanding port infrastructure, technological advancements leading to improved efficiency and capacity, and the rising demand for integrated logistics solutions. Consumer preferences are shifting toward faster, more reliable, and environmentally sustainable shipping options. Competitive dynamics are shaped by continuous innovation, strategic alliances, and the ongoing consolidation of the industry. Market penetration rates for advanced technologies like autonomous vessels and digital port management systems are increasing, although adoption varies across regions.
Dominant Markets & Segments in Marine Services Industry
The Asia-Pacific region, particularly China and Southeast Asia, holds the largest market share due to rapid economic growth, burgeoning trade, and significant investments in port infrastructure. Within the service segments, container handling services represent the largest revenue contributor, followed by supply chain solutions and ship repair and maintenance.
- Key Growth Drivers:
- Container Handling Services: Rising global trade, port expansion, automation investments.
- Ship Repair & Maintenance Services: Aging fleet, stricter regulations, increased demand for specialized services.
- Supply Chain Solutions: Growth of e-commerce, demand for end-to-end logistics solutions.
- Mechanical & Electrical Engineering Services: Technological advancements, increased maintenance needs.
- Navigation Services: Demand for safety and efficiency in maritime operations.
- Logistics Solutions: Growth of e-commerce, focus on supply chain optimization.
The dominance of these regions and segments is attributable to several factors, including favorable government policies, strong economic growth, and substantial investments in infrastructure development.
Marine Services Industry Product Analysis
Significant product innovations are transforming the marine services landscape. These include autonomous vessels, remote-controlled equipment, advanced port management systems, and AI-driven optimization tools. These advancements enhance operational efficiency, reduce costs, and improve safety. The competitive advantage lies in the ability to offer integrated, technology-driven solutions that meet the evolving needs of a globally connected supply chain.
Key Drivers, Barriers & Challenges in Marine Services Industry
Key Drivers: Rising global trade, increasing demand for efficient logistics solutions, technological advancements (automation, AI), government investments in port infrastructure, and the growing focus on sustainable shipping practices.
Challenges: Stringent environmental regulations, geopolitical instability impacting trade routes, supply chain disruptions (e.g., container shortages), and intense competition leading to price pressures. These challenges significantly impact profitability and require strategic adaptation.
Growth Drivers in the Marine Services Industry Market
The industry's growth is primarily driven by burgeoning global trade, particularly within Asia-Pacific, coupled with sustained investment in port infrastructure modernization and digitalization. Regulatory pressures towards greener shipping solutions also stimulate innovation and investment in related services.
Challenges Impacting Marine Services Industry Growth
Significant challenges include fluctuating fuel prices, geopolitical uncertainties, and the ongoing impact of supply chain disruptions, directly affecting operational costs and project timelines. Moreover, intense competition requires continuous innovation and cost optimization.
Key Players Shaping the Marine Services Industry Market
- International Container Terminal Services
- Shanghai International Port (website unavailable)
- CarboShield Inc (website unavailable)
- Shipping Solutions and Services Ltd (website unavailable)
- Hamburger Hafen Und Logistik AG
- TomWorks LLC (website unavailable)
- Montreal Port Authority
- DP World Limited
- Tianjin Port Development Holdings Ltd (website unavailable)
- AP Moller Maersk
Significant Marine Services Industry Milestones
- June 2022: DP World and the Saudi Ports Authority announce a USD 133.33 million partnership for a Jeddah logistics park.
- May 2021: Hutchison Ports acquires APM Terminals Rotterdam.
- May 2021: Régie du Terminal à Conteneurs (RTC) orders new harbor cranes from Konecranes.
Future Outlook for Marine Services Industry Market
The marine services industry is poised for continued growth, driven by technological innovation, strategic investments in infrastructure, and the ongoing expansion of global trade. Opportunities abound in areas such as autonomous shipping, digital port operations, and sustainable solutions. The industry's future hinges on adapting to evolving regulatory landscapes and effectively managing supply chain risks.
Marine Services Industry Segmentation
-
1. Service Analysis
- 1.1. Container Handling Services
- 1.2. Ship repair and maintenance services
- 1.3. Supply Chain
- 1.4. Mechanical and Electrical Engineering Services
- 1.5. Navigation Services
- 1.6. Logistics Solutions
Marine Services Industry Segmentation By Geography
-
1. North America
- 1.1. US
- 1.2. Canada
- 1.3. Mexico
-
2. Europe
- 2.1. Germany
- 2.2. UK
- 2.3. France
- 2.4. Russia
- 2.5. Spain
- 2.6. Rest of Europe
-
3. Asia Pacific
- 3.1. India
- 3.2. China
- 3.3. Japan
- 3.4. Australia
- 3.5. Singapore
- 3.6. Malaysia
- 3.7. South Korea
- 3.8. Rest of Asia Pacific
-
4. South America
- 4.1. Brazil
- 4.2. Argentina
- 4.3. Rest Of South America
- 5. Middle East
-
6. UAE
- 6.1. Saudi Arabia
- 6.2. South Africa
- 6.3. Others
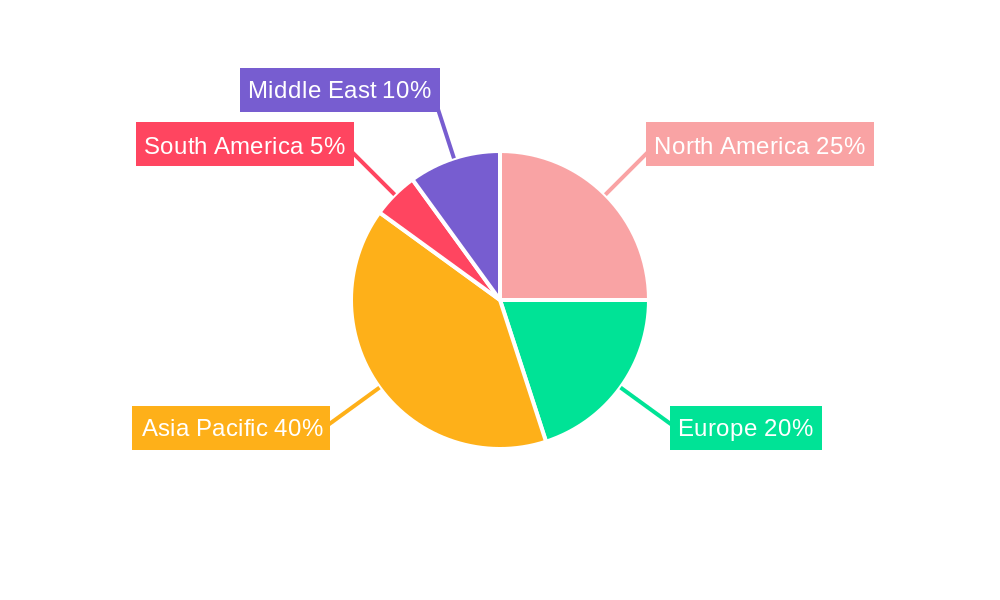
Marine Services Industry Regional Market Share
Geographic Coverage of Marine Services Industry
Marine Services Industry REPORT HIGHLIGHTS
| Aspects | Details |
|---|---|
| Study Period | 2020-2034 |
| Base Year | 2025 |
| Estimated Year | 2026 |
| Forecast Period | 2026-2034 |
| Historical Period | 2020-2025 |
| Growth Rate | CAGR of > 5.00% from 2020-2034 |
| Segmentation |
|
Table of Contents
- 1. Introduction
- 1.1. Research Scope
- 1.2. Market Segmentation
- 1.3. Research Objective
- 1.4. Definitions and Assumptions
- 2. Executive Summary
- 2.1. Market Snapshot
- 3. Market Dynamics
- 3.1. Market Drivers
- 3.2. Market Restrains
- 3.3. Market Trends
- 3.4. Market Opportunities
- 4. Market Factor Analysis
- 4.1. Porters Five Forces
- 4.1.1. Bargaining Power of Suppliers
- 4.1.2. Bargaining Power of Buyers
- 4.1.3. Threat of New Entrants
- 4.1.4. Threat of Substitutes
- 4.1.5. Competitive Rivalry
- 4.2. PESTEL analysis
- 4.3. BCG Analysis
- 4.3.1. Stars (High Growth, High Market Share)
- 4.3.2. Cash Cows (Low Growth, High Market Share)
- 4.3.3. Question Mark (High Growth, Low Market Share)
- 4.3.4. Dogs (Low Growth, Low Market Share)
- 4.4. Ansoff Matrix Analysis
- 4.5. Supply Chain Analysis
- 4.6. Regulatory Landscape
- 4.7. Current Market Potential and Opportunity Assessment (TAM–SAM–SOM Framework)
- 4.8. TIR Analyst Note
- 4.1. Porters Five Forces
- 5. Market Analysis, Insights and Forecast 2021-2033
- 5.1. Market Analysis, Insights and Forecast - by Service Analysis
- 5.1.1. Container Handling Services
- 5.1.2. Ship repair and maintenance services
- 5.1.3. Supply Chain
- 5.1.4. Mechanical and Electrical Engineering Services
- 5.1.5. Navigation Services
- 5.1.6. Logistics Solutions
- 5.2. Market Analysis, Insights and Forecast - by Region
- 5.2.1. North America
- 5.2.2. Europe
- 5.2.3. Asia Pacific
- 5.2.4. South America
- 5.2.5. Middle East
- 5.2.6. UAE
- 5.1. Market Analysis, Insights and Forecast - by Service Analysis
- 6. Global Marine Services Industry Analysis, Insights and Forecast, 2021-2033
- 6.1. Market Analysis, Insights and Forecast - by Service Analysis
- 6.1.1. Container Handling Services
- 6.1.2. Ship repair and maintenance services
- 6.1.3. Supply Chain
- 6.1.4. Mechanical and Electrical Engineering Services
- 6.1.5. Navigation Services
- 6.1.6. Logistics Solutions
- 6.1. Market Analysis, Insights and Forecast - by Service Analysis
- 7. North America Marine Services Industry Analysis, Insights and Forecast, 2020-2032
- 7.1. Market Analysis, Insights and Forecast - by Service Analysis
- 7.1.1. Container Handling Services
- 7.1.2. Ship repair and maintenance services
- 7.1.3. Supply Chain
- 7.1.4. Mechanical and Electrical Engineering Services
- 7.1.5. Navigation Services
- 7.1.6. Logistics Solutions
- 7.1. Market Analysis, Insights and Forecast - by Service Analysis
- 8. Europe Marine Services Industry Analysis, Insights and Forecast, 2020-2032
- 8.1. Market Analysis, Insights and Forecast - by Service Analysis
- 8.1.1. Container Handling Services
- 8.1.2. Ship repair and maintenance services
- 8.1.3. Supply Chain
- 8.1.4. Mechanical and Electrical Engineering Services
- 8.1.5. Navigation Services
- 8.1.6. Logistics Solutions
- 8.1. Market Analysis, Insights and Forecast - by Service Analysis
- 9. Asia Pacific Marine Services Industry Analysis, Insights and Forecast, 2020-2032
- 9.1. Market Analysis, Insights and Forecast - by Service Analysis
- 9.1.1. Container Handling Services
- 9.1.2. Ship repair and maintenance services
- 9.1.3. Supply Chain
- 9.1.4. Mechanical and Electrical Engineering Services
- 9.1.5. Navigation Services
- 9.1.6. Logistics Solutions
- 9.1. Market Analysis, Insights and Forecast - by Service Analysis
- 10. South America Marine Services Industry Analysis, Insights and Forecast, 2020-2032
- 10.1. Market Analysis, Insights and Forecast - by Service Analysis
- 10.1.1. Container Handling Services
- 10.1.2. Ship repair and maintenance services
- 10.1.3. Supply Chain
- 10.1.4. Mechanical and Electrical Engineering Services
- 10.1.5. Navigation Services
- 10.1.6. Logistics Solutions
- 10.1. Market Analysis, Insights and Forecast - by Service Analysis
- 11. Middle East Marine Services Industry Analysis, Insights and Forecast, 2020-2032
- 11.1. Market Analysis, Insights and Forecast - by Service Analysis
- 11.1.1. Container Handling Services
- 11.1.2. Ship repair and maintenance services
- 11.1.3. Supply Chain
- 11.1.4. Mechanical and Electrical Engineering Services
- 11.1.5. Navigation Services
- 11.1.6. Logistics Solutions
- 11.1. Market Analysis, Insights and Forecast - by Service Analysis
- 12. UAE Marine Services Industry Analysis, Insights and Forecast, 2020-2032
- 12.1. Market Analysis, Insights and Forecast - by Service Analysis
- 12.1.1. Container Handling Services
- 12.1.2. Ship repair and maintenance services
- 12.1.3. Supply Chain
- 12.1.4. Mechanical and Electrical Engineering Services
- 12.1.5. Navigation Services
- 12.1.6. Logistics Solutions
- 12.1. Market Analysis, Insights and Forecast - by Service Analysis
- 13. Competitive Analysis
- 13.1. Company Profiles
- 13.1.1 International Container Terminal Services
- 13.1.1.1. Company Overview
- 13.1.1.2. Products
- 13.1.1.3. Company Financials
- 13.1.1.4. SWOT Analysis
- 13.1.2 Shanghai International Port
- 13.1.2.1. Company Overview
- 13.1.2.2. Products
- 13.1.2.3. Company Financials
- 13.1.2.4. SWOT Analysis
- 13.1.3 CarboShield Inc
- 13.1.3.1. Company Overview
- 13.1.3.2. Products
- 13.1.3.3. Company Financials
- 13.1.3.4. SWOT Analysis
- 13.1.4 Shipping Solutions and Services Ltd
- 13.1.4.1. Company Overview
- 13.1.4.2. Products
- 13.1.4.3. Company Financials
- 13.1.4.4. SWOT Analysis
- 13.1.5 Hamburger Hafen Und Logistik AG
- 13.1.5.1. Company Overview
- 13.1.5.2. Products
- 13.1.5.3. Company Financials
- 13.1.5.4. SWOT Analysis
- 13.1.6 TomWorks LLC
- 13.1.6.1. Company Overview
- 13.1.6.2. Products
- 13.1.6.3. Company Financials
- 13.1.6.4. SWOT Analysis
- 13.1.7 Montreal Port Authority**List Not Exhaustive
- 13.1.7.1. Company Overview
- 13.1.7.2. Products
- 13.1.7.3. Company Financials
- 13.1.7.4. SWOT Analysis
- 13.1.8 DP World Limited
- 13.1.8.1. Company Overview
- 13.1.8.2. Products
- 13.1.8.3. Company Financials
- 13.1.8.4. SWOT Analysis
- 13.1.9 Tianjin Port Development Holdings Ltd
- 13.1.9.1. Company Overview
- 13.1.9.2. Products
- 13.1.9.3. Company Financials
- 13.1.9.4. SWOT Analysis
- 13.1.10 AP Moller Maersk
- 13.1.10.1. Company Overview
- 13.1.10.2. Products
- 13.1.10.3. Company Financials
- 13.1.10.4. SWOT Analysis
- 13.1.1 International Container Terminal Services
- 13.2. Market Entropy
- 13.2.1 Company's Key Areas Served
- 13.2.2 Recent Developments
- 13.3. Company Market Share Analysis 2025
- 13.3.1 Top 5 Companies Market Share Analysis
- 13.3.2 Top 3 Companies Market Share Analysis
- 13.4. List of Potential Customers
- 14. Research Methodology
List of Figures
- Figure 1: Global Marine Services Industry Revenue Breakdown (Million, %) by Region 2025 & 2033
- Figure 2: North America Marine Services Industry Revenue (Million), by Service Analysis 2025 & 2033
- Figure 3: North America Marine Services Industry Revenue Share (%), by Service Analysis 2025 & 2033
- Figure 4: North America Marine Services Industry Revenue (Million), by Country 2025 & 2033
- Figure 5: North America Marine Services Industry Revenue Share (%), by Country 2025 & 2033
- Figure 6: Europe Marine Services Industry Revenue (Million), by Service Analysis 2025 & 2033
- Figure 7: Europe Marine Services Industry Revenue Share (%), by Service Analysis 2025 & 2033
- Figure 8: Europe Marine Services Industry Revenue (Million), by Country 2025 & 2033
- Figure 9: Europe Marine Services Industry Revenue Share (%), by Country 2025 & 2033
- Figure 10: Asia Pacific Marine Services Industry Revenue (Million), by Service Analysis 2025 & 2033
- Figure 11: Asia Pacific Marine Services Industry Revenue Share (%), by Service Analysis 2025 & 2033
- Figure 12: Asia Pacific Marine Services Industry Revenue (Million), by Country 2025 & 2033
- Figure 13: Asia Pacific Marine Services Industry Revenue Share (%), by Country 2025 & 2033
- Figure 14: South America Marine Services Industry Revenue (Million), by Service Analysis 2025 & 2033
- Figure 15: South America Marine Services Industry Revenue Share (%), by Service Analysis 2025 & 2033
- Figure 16: South America Marine Services Industry Revenue (Million), by Country 2025 & 2033
- Figure 17: South America Marine Services Industry Revenue Share (%), by Country 2025 & 2033
- Figure 18: Middle East Marine Services Industry Revenue (Million), by Service Analysis 2025 & 2033
- Figure 19: Middle East Marine Services Industry Revenue Share (%), by Service Analysis 2025 & 2033
- Figure 20: Middle East Marine Services Industry Revenue (Million), by Country 2025 & 2033
- Figure 21: Middle East Marine Services Industry Revenue Share (%), by Country 2025 & 2033
- Figure 22: UAE Marine Services Industry Revenue (Million), by Service Analysis 2025 & 2033
- Figure 23: UAE Marine Services Industry Revenue Share (%), by Service Analysis 2025 & 2033
- Figure 24: UAE Marine Services Industry Revenue (Million), by Country 2025 & 2033
- Figure 25: UAE Marine Services Industry Revenue Share (%), by Country 2025 & 2033
List of Tables
- Table 1: Global Marine Services Industry Revenue Million Forecast, by Service Analysis 2020 & 2033
- Table 2: Global Marine Services Industry Revenue Million Forecast, by Region 2020 & 2033
- Table 3: Global Marine Services Industry Revenue Million Forecast, by Service Analysis 2020 & 2033
- Table 4: Global Marine Services Industry Revenue Million Forecast, by Country 2020 & 2033
- Table 5: US Marine Services Industry Revenue (Million) Forecast, by Application 2020 & 2033
- Table 6: Canada Marine Services Industry Revenue (Million) Forecast, by Application 2020 & 2033
- Table 7: Mexico Marine Services Industry Revenue (Million) Forecast, by Application 2020 & 2033
- Table 8: Global Marine Services Industry Revenue Million Forecast, by Service Analysis 2020 & 2033
- Table 9: Global Marine Services Industry Revenue Million Forecast, by Country 2020 & 2033
- Table 10: Germany Marine Services Industry Revenue (Million) Forecast, by Application 2020 & 2033
- Table 11: UK Marine Services Industry Revenue (Million) Forecast, by Application 2020 & 2033
- Table 12: France Marine Services Industry Revenue (Million) Forecast, by Application 2020 & 2033
- Table 13: Russia Marine Services Industry Revenue (Million) Forecast, by Application 2020 & 2033
- Table 14: Spain Marine Services Industry Revenue (Million) Forecast, by Application 2020 & 2033
- Table 15: Rest of Europe Marine Services Industry Revenue (Million) Forecast, by Application 2020 & 2033
- Table 16: Global Marine Services Industry Revenue Million Forecast, by Service Analysis 2020 & 2033
- Table 17: Global Marine Services Industry Revenue Million Forecast, by Country 2020 & 2033
- Table 18: India Marine Services Industry Revenue (Million) Forecast, by Application 2020 & 2033
- Table 19: China Marine Services Industry Revenue (Million) Forecast, by Application 2020 & 2033
- Table 20: Japan Marine Services Industry Revenue (Million) Forecast, by Application 2020 & 2033
- Table 21: Australia Marine Services Industry Revenue (Million) Forecast, by Application 2020 & 2033
- Table 22: Singapore Marine Services Industry Revenue (Million) Forecast, by Application 2020 & 2033
- Table 23: Malaysia Marine Services Industry Revenue (Million) Forecast, by Application 2020 & 2033
- Table 24: South Korea Marine Services Industry Revenue (Million) Forecast, by Application 2020 & 2033
- Table 25: Rest of Asia Pacific Marine Services Industry Revenue (Million) Forecast, by Application 2020 & 2033
- Table 26: Global Marine Services Industry Revenue Million Forecast, by Service Analysis 2020 & 2033
- Table 27: Global Marine Services Industry Revenue Million Forecast, by Country 2020 & 2033
- Table 28: Brazil Marine Services Industry Revenue (Million) Forecast, by Application 2020 & 2033
- Table 29: Argentina Marine Services Industry Revenue (Million) Forecast, by Application 2020 & 2033
- Table 30: Rest Of South America Marine Services Industry Revenue (Million) Forecast, by Application 2020 & 2033
- Table 31: Global Marine Services Industry Revenue Million Forecast, by Service Analysis 2020 & 2033
- Table 32: Global Marine Services Industry Revenue Million Forecast, by Country 2020 & 2033
- Table 33: Global Marine Services Industry Revenue Million Forecast, by Service Analysis 2020 & 2033
- Table 34: Global Marine Services Industry Revenue Million Forecast, by Country 2020 & 2033
- Table 35: Saudi Arabia Marine Services Industry Revenue (Million) Forecast, by Application 2020 & 2033
- Table 36: South Africa Marine Services Industry Revenue (Million) Forecast, by Application 2020 & 2033
- Table 37: Others Marine Services Industry Revenue (Million) Forecast, by Application 2020 & 2033
Frequently Asked Questions
1. What is the projected Compound Annual Growth Rate (CAGR) of the Marine Services Industry?
The projected CAGR is approximately > 5.00%.
2. Which companies are prominent players in the Marine Services Industry?
Key companies in the market include International Container Terminal Services, Shanghai International Port, CarboShield Inc, Shipping Solutions and Services Ltd, Hamburger Hafen Und Logistik AG, TomWorks LLC, Montreal Port Authority**List Not Exhaustive, DP World Limited, Tianjin Port Development Holdings Ltd, AP Moller Maersk.
3. What are the main segments of the Marine Services Industry?
The market segments include Service Analysis.
4. Can you provide details about the market size?
The market size is estimated to be USD XX Million as of 2022.
5. What are some drivers contributing to market growth?
The rise in online shopping and consumer demand for fast delivery; Rise in cross-border trade activities.
6. What are the notable trends driving market growth?
Increasing Maritime Trade.
7. Are there any restraints impacting market growth?
Poor infrastructure and higher logistics costs.
8. Can you provide examples of recent developments in the market?
On 19 June 2022, DP World and the Saudi Ports Authority announce a major new partnership for the Jeddah logistics park. This is a 30-year agreement with an investment value of more than SAR 500 million (USD 133.33 million) to build a state-of-the-art, port-centric Logistics Park at the Jeddah Islamic Port. The agreement aims to establish a logistics park that spans over 415,000 square meters, with an in-land container depot capacity of approximately 250,000 TEU and a warehousing storage space of 100,000 square meters. Future expansions could increase the storage space to 200,000 square meters.
9. What pricing options are available for accessing the report?
Pricing options include single-user, multi-user, and enterprise licenses priced at USD 4750, USD 5250, and USD 8750 respectively.
10. Is the market size provided in terms of value or volume?
The market size is provided in terms of value, measured in Million.
11. Are there any specific market keywords associated with the report?
Yes, the market keyword associated with the report is "Marine Services Industry," which aids in identifying and referencing the specific market segment covered.
12. How do I determine which pricing option suits my needs best?
The pricing options vary based on user requirements and access needs. Individual users may opt for single-user licenses, while businesses requiring broader access may choose multi-user or enterprise licenses for cost-effective access to the report.
13. Are there any additional resources or data provided in the Marine Services Industry report?
While the report offers comprehensive insights, it's advisable to review the specific contents or supplementary materials provided to ascertain if additional resources or data are available.
14. How can I stay updated on further developments or reports in the Marine Services Industry?
To stay informed about further developments, trends, and reports in the Marine Services Industry, consider subscribing to industry newsletters, following relevant companies and organizations, or regularly checking reputable industry news sources and publications.
Methodology
Step 1 - Identification of Relevant Samples Size from Population Database


Step 2 - Approaches for Defining Global Market Size (Value, Volume* & Price*)

Note*: In applicable scenarios
Step 3 - Data Sources
Primary Research
- Web Analytics
- Survey Reports
- Research Institute
- Latest Research Reports
- Opinion Leaders
Secondary Research
- Annual Reports
- White Paper
- Latest Press Release
- Industry Association
- Paid Database
- Investor Presentations

Step 4 - Data Triangulation
Involves using different sources of information in order to increase the validity of a study
These sources are likely to be stakeholders in a program - participants, other researchers, program staff, other community members, and so on.
Then we put all data in single framework & apply various statistical tools to find out the dynamic on the market.
During the analysis stage, feedback from the stakeholder groups would be compared to determine areas of agreement as well as areas of divergence