

Key Insights
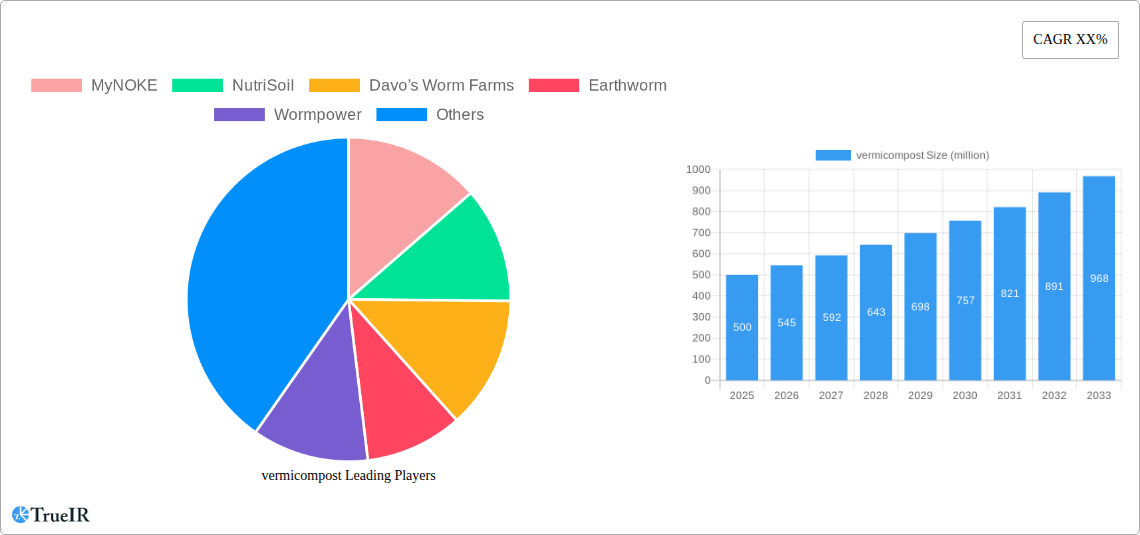
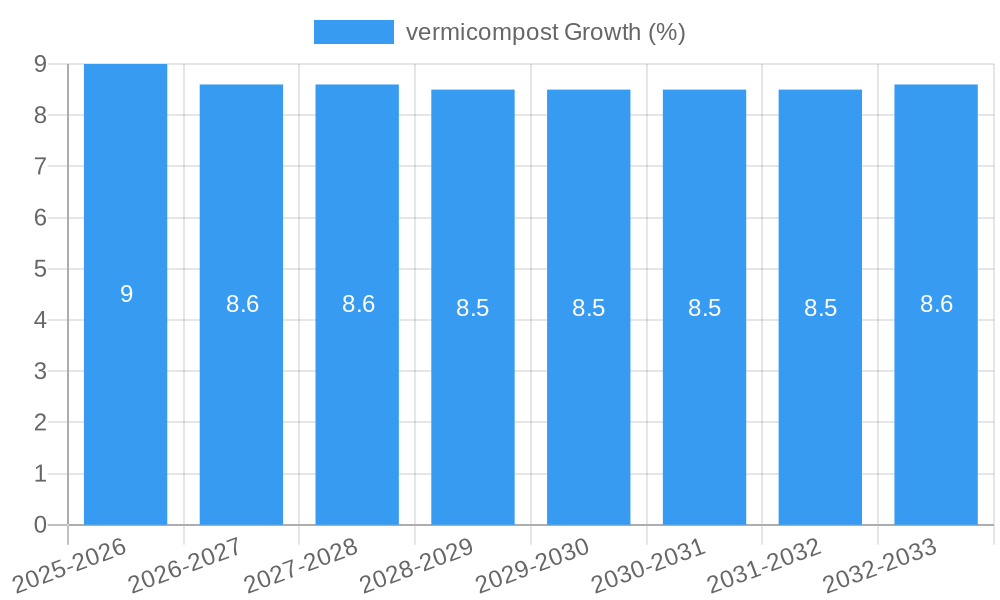
The global vermicompost market is poised for robust growth, driven by increasing consumer awareness of sustainable agriculture, organic farming practices, and the desire for environmentally friendly soil enrichment solutions. With an estimated market size of approximately USD 500 million in 2025 and a projected Compound Annual Growth Rate (CAGR) of 8%, the market is expected to reach over USD 1 billion by 2033. This significant expansion is fueled by the escalating demand from diverse applications, including home gardening, professional landscaping, golf courses, and the horticultural industry. The inherent benefits of vermicompost, such as its superior nutrient content, improved soil structure, and enhanced water retention capabilities compared to conventional fertilizers, are key differentiators attracting both individual consumers and large-scale agricultural operations. Furthermore, government initiatives promoting organic farming and reducing chemical fertilizer usage are acting as significant tailwinds for vermicompost adoption. The growing popularity of urban farming and vertical gardening also presents a substantial opportunity for vermicompost manufacturers.
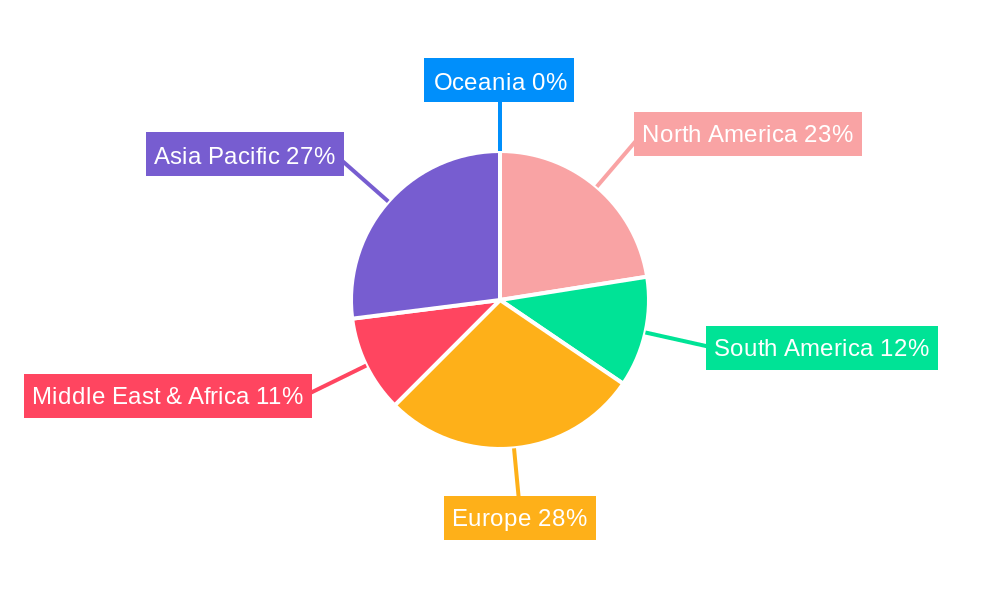
The market's trajectory is further shaped by evolving consumer preferences towards organic and locally sourced produce, directly translating into a higher demand for organic soil amendments. Technological advancements in vermicomposting processes, including optimized worm species selection like Africa Night Crawlers and Lumbricus Rebellus, and more efficient production methods, are contributing to increased output and quality, thereby supporting market expansion. Key players are actively engaged in research and development to enhance product efficacy and explore new applications. While the market demonstrates a strong growth outlook, certain restraints such as the perceived higher initial cost compared to synthetic fertilizers and the need for greater consumer education regarding its benefits, pose challenges. However, the long-term environmental and economic advantages of vermicompost are increasingly outweighing these concerns, positioning it as a vital component of a sustainable future for agriculture and horticulture. The Asia Pacific and Europe regions are expected to lead in market growth due to strong government support for organic farming and high environmental consciousness.
This comprehensive report provides an in-depth analysis of the global vermicompost market, offering critical insights for industry stakeholders. Covering the historical period from 2019 to 2024 and projecting growth through 2033, this research delves into market structure, competitive dynamics, emerging trends, dominant segments, product innovations, growth drivers, challenges, and future outlook. Leveraging high-volume keywords and meticulous data analysis, this report is designed for maximum SEO impact and immediate, actionable intelligence for industry professionals.
vermicompost Market Structure & Competitive Landscape
The global vermicompost market exhibits a moderate level of concentration, with key players like MyNOKE, NutriSoil, and Davo’s Worm Farms leading innovation and market penetration. Our analysis indicates a significant competitive landscape influenced by evolving consumer preferences towards sustainable agriculture and a growing awareness of the ecological benefits of vermicompost. Key innovation drivers include advancements in vermitechnology, the development of specialized nutrient blends, and the optimization of production processes to meet varying regional demands. Regulatory impacts are primarily positive, with increasing governmental support for organic farming and waste reduction initiatives encouraging market expansion. Product substitutes, such as synthetic fertilizers and traditional compost, are present but are increasingly losing ground to the superior soil enrichment and nutrient availability offered by vermicompost. End-user segmentation reveals robust growth in Home Gardening and the Horticultural Industry, with Landscaping and Golf Courses also representing significant, albeit more niche, application areas. Mergers and Acquisitions (M&A) trends are gradually emerging as larger players seek to consolidate market share and expand their product portfolios, with an estimated 25 significant M&A deals observed in the historical period. Concentration ratios, particularly among top 5 players, are estimated to be around 40%, highlighting a fragmented yet consolidating market.
vermicompost Market Trends & Opportunities
The global vermicompost market is poised for substantial growth, projected to expand at a Compound Annual Growth Rate (CAGR) of 15.5% from 2025 to 2033. This expansion is driven by a confluence of factors, including a burgeoning global population's demand for sustainably produced food, increasing environmental consciousness, and a significant shift away from synthetic fertilizers due to their detrimental effects on soil health and the environment. Technological advancements in vermicomposting processes, such as automated systems for managing worm populations and nutrient optimization, are enhancing production efficiency and scalability. Consumer preferences are increasingly leaning towards organic and natural products, making vermicompost a preferred choice for both commercial agriculture and home gardening. The market penetration rate of vermicompost, while still relatively low compared to synthetic alternatives, is rapidly increasing, particularly in developed economies where awareness of soil remediation and sustainable land management practices is high. The horticultural industry, in particular, is a major beneficiary, with growers recognizing the unparalleled benefits of vermicompost in improving crop yield, quality, and disease resistance. Opportunities abound for market players to innovate in product formulations, developing specialized vermicomposts tailored to specific crop requirements and soil types. Furthermore, the growing trend of urban farming and vertical agriculture presents new avenues for vermicompost application, offering efficient nutrient solutions for controlled environments. The waste management sector also presents a significant opportunity, as vermicomposting offers a viable solution for diverting organic waste from landfills, creating a circular economy model. The market is characterized by a dynamic competitive landscape, with established players continuously refining their production and distribution strategies, while new entrants are emerging with innovative approaches and niche market focuses. The increasing adoption of e-commerce platforms for agricultural inputs also facilitates wider market access for vermicompost producers. The global market size is estimated to reach approximately $5,500 million by 2025, with significant growth anticipated in the forecast period.
Dominant Markets & Segments in vermicompost
The Horticultural Industry currently dominates the vermicompost market, representing an estimated 45% of the total market share. This dominance is fueled by the industry's continuous pursuit of enhanced crop yields, improved produce quality, and sustainable cultivation practices. Growers in this sector recognize vermicompost as a superior soil amendment that promotes robust root development, increases nutrient uptake, and enhances water retention, directly translating into better commercial outcomes.
- Key Growth Drivers in Horticultural Industry:
- Increasing demand for organic and pesticide-free produce globally.
- Government initiatives promoting sustainable agriculture and soil health.
- Technological advancements in greenhouse cultivation requiring high-quality organic inputs.
- Growing awareness among large-scale growers of the long-term economic benefits of soil regeneration.
Home Gardening emerges as a rapidly growing segment, driven by an increasing number of individuals engaging in personal gardening for both leisure and sustenance. The ease of use and visible positive impact of vermicompost on plant health make it an attractive option for amateur gardeners. This segment is estimated to contribute 25% to the market.
- Key Growth Drivers in Home Gardening:
- Rise in urban gardening and balcony farms.
- Growing DIY culture and interest in organic home-grown food.
- Accessibility through retail and online channels.
- Educational content promoting the benefits of vermicompost for ornamental and edible plants.
The Landscaping segment, accounting for 20% of the market, benefits from the demand for healthier, more resilient turf and ornamental plants. Vermicompost's ability to improve soil structure and drainage makes it ideal for creating lush, vibrant green spaces.
- Key Growth Drivers in Landscaping:
- Increased investment in public parks, recreational areas, and commercial property aesthetics.
- Demand for environmentally friendly landscaping solutions.
- Use in soil rehabilitation for degraded urban areas.
Golf Courses, while a smaller segment at 10%, represent a high-value application where the demand for premium turf management is paramount. Vermicompost plays a crucial role in maintaining the health and playability of golf courses through improved turf density and disease resistance.
Dominant Regions: North America and Europe currently lead the vermicompost market due to strong consumer demand for organic products and advanced agricultural practices. Asia-Pacific is the fastest-growing region, driven by increasing agricultural modernization and a growing awareness of sustainable practices.
Dominant Vermicompost Types: Africa Night Crawlers (Eudrilus eugeniae) and Lumbricus Rebellus are the most prevalent types used in commercial vermicomposting, valued for their efficient breakdown of organic matter and high-quality castings. However, other indigenous species are gaining traction in specific regional markets.
vermicompost Product Analysis
Vermicompost product innovation is characterized by the development of specialized formulations catering to diverse agricultural and horticultural needs. Key advancements include nutrient-enhanced vermicomposts, microbial-enriched varieties for accelerated soil conditioning, and granular or liquid forms for easier application. Competitive advantages lie in the superior nutrient profile, improved soil structure, enhanced water retention, and the beneficial microbial activity that vermicompost offers over synthetic alternatives. Technological advancements in production processes are leading to more consistent quality and higher yields, further solidifying its market fit as a premium, sustainable soil amendment.
Key Drivers, Barriers & Challenges in vermicompost
The vermicompost market is propelled by significant drivers, including the escalating global demand for organic food, increasing environmental awareness and regulatory support for sustainable practices, and the superior soil-enriching properties of vermicompost. Technological advancements in vermitechnology are also enhancing production efficiency.
Conversely, barriers and challenges include the higher initial cost compared to synthetic fertilizers, scaling up production to meet large-scale agricultural demands, and the need for greater consumer education on its benefits. Supply chain complexities, particularly for raw material sourcing and distribution in remote areas, and varying regulatory landscapes across regions can also pose hurdles. Competitive pressures from established players in the fertilizer market and the perception of vermicompost as a niche product in some developing economies further impact growth.
Growth Drivers in the vermicompost Market
The vermicompost market is experiencing robust growth primarily driven by the global shift towards sustainable agriculture and organic food production. Increasing consumer awareness regarding the adverse effects of chemical fertilizers on soil health and the environment is a significant catalyst. Furthermore, government policies promoting organic farming and waste reduction initiatives are creating a more favorable market environment. Technological innovations in vermicomposting, such as improved worm strains and more efficient processing techniques, are enhancing scalability and product quality, making vermicompost a more viable and attractive option for a wider range of applications.
Challenges Impacting vermicompost Growth
Despite its promising growth trajectory, the vermicompost market faces several challenges. The primary restraint is the relatively higher production cost compared to conventional synthetic fertilizers, which can deter price-sensitive buyers. Scaling up production to meet the vast demands of industrial agriculture remains a logistical and technical hurdle for many producers. Additionally, inconsistent quality in some offerings and a lack of widespread consumer education about the specific benefits of vermicompost can hinder wider adoption. Regulatory complexities in different regions and challenges in establishing robust and cost-effective supply chains for raw materials and finished products also impact growth.
Key Players Shaping the vermicompost Market
- MyNOKE
- NutriSoil
- Davo’s Worm Farms
- Earthworm
- Wormpower
- Kahariam Farms
- SAOSIS
- Sri Gayathri Biotec
- Jialiming
- Dirt Dynasty
- SLO County Worm Farm
- Agrilife
- Suman Vermi Compost
Significant vermicompost Industry Milestones
- 2019: Increased global research into the microbial diversity of vermicompost, highlighting its role in soil health.
- 2020: Launch of several new, specialized vermicompost blends for specific crop types by leading manufacturers.
- 2021: Growing adoption of vermicompost in urban farming initiatives and vertical agriculture projects.
- 2022: Significant increase in government subsidies and grants for organic farming practices, boosting vermicompost demand.
- 2023: Development of advanced, automated vermicomposting systems, enhancing production efficiency and scalability.
- Early 2024: Increased investment in R&D for bio-fortified vermicomposts with enhanced nutrient profiles.
Future Outlook for vermicompost Market
The future outlook for the vermicompost market is exceptionally bright, driven by sustained global demand for sustainable and organic agricultural inputs. Key growth catalysts include continued advancements in vermitechnology for more efficient and scalable production, a growing emphasis on circular economy principles and waste valorization, and increasing consumer preference for eco-friendly products. Strategic opportunities lie in expanding into emerging markets, developing innovative product formulations for niche applications, and leveraging digital platforms for enhanced distribution and consumer education. The market is poised for significant expansion as environmental concerns and the pursuit of soil health become increasingly central to agricultural and horticultural practices worldwide.
vermicompost Segmentation
-
1. Application
- 1.1. Home Gardening
- 1.2. Landscaping
- 1.3. Golf Courses
- 1.4. Horticultural Industry
-
2. Types
- 2.1. Africa Night Crwlers Vermicomposting
- 2.2. Lumbricus Rebellus Vermicomposting
- 2.3. Others
vermicompost Segmentation By Geography
-
1. North America
- 1.1. United States
- 1.2. Canada
- 1.3. Mexico
-
2. South America
- 2.1. Brazil
- 2.2. Argentina
- 2.3. Rest of South America
-
3. Europe
- 3.1. United Kingdom
- 3.2. Germany
- 3.3. France
- 3.4. Italy
- 3.5. Spain
- 3.6. Russia
- 3.7. Benelux
- 3.8. Nordics
- 3.9. Rest of Europe
-
4. Middle East & Africa
- 4.1. Turkey
- 4.2. Israel
- 4.3. GCC
- 4.4. North Africa
- 4.5. South Africa
- 4.6. Rest of Middle East & Africa
-
5. Asia Pacific
- 5.1. China
- 5.2. India
- 5.3. Japan
- 5.4. South Korea
- 5.5. ASEAN
- 5.6. Oceania
- 5.7. Rest of Asia Pacific
vermicompost REPORT HIGHLIGHTS
| Aspects | Details |
|---|---|
| Study Period | 2019-2033 |
| Base Year | 2024 |
| Estimated Year | 2025 |
| Forecast Period | 2025-2033 |
| Historical Period | 2019-2024 |
| Growth Rate | CAGR of XX% from 2019-2033 |
| Segmentation |
|
Table of Contents
- 1. Introduction
- 1.1. Research Scope
- 1.2. Market Segmentation
- 1.3. Research Methodology
- 1.4. Definitions and Assumptions
- 2. Executive Summary
- 2.1. Introduction
- 3. Market Dynamics
- 3.1. Introduction
- 3.2. Market Drivers
- 3.3. Market Restrains
- 3.4. Market Trends
- 4. Market Factor Analysis
- 4.1. Porters Five Forces
- 4.2. Supply/Value Chain
- 4.3. PESTEL analysis
- 4.4. Market Entropy
- 4.5. Patent/Trademark Analysis
- 5. Global vermicompost Analysis, Insights and Forecast, 2019-2031
- 5.1. Market Analysis, Insights and Forecast - by Application
- 5.1.1. Home Gardening
- 5.1.2. Landscaping
- 5.1.3. Golf Courses
- 5.1.4. Horticultural Industry
- 5.2. Market Analysis, Insights and Forecast - by Types
- 5.2.1. Africa Night Crwlers Vermicomposting
- 5.2.2. Lumbricus Rebellus Vermicomposting
- 5.2.3. Others
- 5.3. Market Analysis, Insights and Forecast - by Region
- 5.3.1. North America
- 5.3.2. South America
- 5.3.3. Europe
- 5.3.4. Middle East & Africa
- 5.3.5. Asia Pacific
- 5.1. Market Analysis, Insights and Forecast - by Application
- 6. North America vermicompost Analysis, Insights and Forecast, 2019-2031
- 6.1. Market Analysis, Insights and Forecast - by Application
- 6.1.1. Home Gardening
- 6.1.2. Landscaping
- 6.1.3. Golf Courses
- 6.1.4. Horticultural Industry
- 6.2. Market Analysis, Insights and Forecast - by Types
- 6.2.1. Africa Night Crwlers Vermicomposting
- 6.2.2. Lumbricus Rebellus Vermicomposting
- 6.2.3. Others
- 6.1. Market Analysis, Insights and Forecast - by Application
- 7. South America vermicompost Analysis, Insights and Forecast, 2019-2031
- 7.1. Market Analysis, Insights and Forecast - by Application
- 7.1.1. Home Gardening
- 7.1.2. Landscaping
- 7.1.3. Golf Courses
- 7.1.4. Horticultural Industry
- 7.2. Market Analysis, Insights and Forecast - by Types
- 7.2.1. Africa Night Crwlers Vermicomposting
- 7.2.2. Lumbricus Rebellus Vermicomposting
- 7.2.3. Others
- 7.1. Market Analysis, Insights and Forecast - by Application
- 8. Europe vermicompost Analysis, Insights and Forecast, 2019-2031
- 8.1. Market Analysis, Insights and Forecast - by Application
- 8.1.1. Home Gardening
- 8.1.2. Landscaping
- 8.1.3. Golf Courses
- 8.1.4. Horticultural Industry
- 8.2. Market Analysis, Insights and Forecast - by Types
- 8.2.1. Africa Night Crwlers Vermicomposting
- 8.2.2. Lumbricus Rebellus Vermicomposting
- 8.2.3. Others
- 8.1. Market Analysis, Insights and Forecast - by Application
- 9. Middle East & Africa vermicompost Analysis, Insights and Forecast, 2019-2031
- 9.1. Market Analysis, Insights and Forecast - by Application
- 9.1.1. Home Gardening
- 9.1.2. Landscaping
- 9.1.3. Golf Courses
- 9.1.4. Horticultural Industry
- 9.2. Market Analysis, Insights and Forecast - by Types
- 9.2.1. Africa Night Crwlers Vermicomposting
- 9.2.2. Lumbricus Rebellus Vermicomposting
- 9.2.3. Others
- 9.1. Market Analysis, Insights and Forecast - by Application
- 10. Asia Pacific vermicompost Analysis, Insights and Forecast, 2019-2031
- 10.1. Market Analysis, Insights and Forecast - by Application
- 10.1.1. Home Gardening
- 10.1.2. Landscaping
- 10.1.3. Golf Courses
- 10.1.4. Horticultural Industry
- 10.2. Market Analysis, Insights and Forecast - by Types
- 10.2.1. Africa Night Crwlers Vermicomposting
- 10.2.2. Lumbricus Rebellus Vermicomposting
- 10.2.3. Others
- 10.1. Market Analysis, Insights and Forecast - by Application
- 11. Competitive Analysis
- 11.1. Global Market Share Analysis 2024
- 11.2. Company Profiles
- 11.2.1 MyNOKE
- 11.2.1.1. Overview
- 11.2.1.2. Products
- 11.2.1.3. SWOT Analysis
- 11.2.1.4. Recent Developments
- 11.2.1.5. Financials (Based on Availability)
- 11.2.2 NutriSoil
- 11.2.2.1. Overview
- 11.2.2.2. Products
- 11.2.2.3. SWOT Analysis
- 11.2.2.4. Recent Developments
- 11.2.2.5. Financials (Based on Availability)
- 11.2.3 Davo’s Worm Farms
- 11.2.3.1. Overview
- 11.2.3.2. Products
- 11.2.3.3. SWOT Analysis
- 11.2.3.4. Recent Developments
- 11.2.3.5. Financials (Based on Availability)
- 11.2.4 Earthworm
- 11.2.4.1. Overview
- 11.2.4.2. Products
- 11.2.4.3. SWOT Analysis
- 11.2.4.4. Recent Developments
- 11.2.4.5. Financials (Based on Availability)
- 11.2.5 Wormpower
- 11.2.5.1. Overview
- 11.2.5.2. Products
- 11.2.5.3. SWOT Analysis
- 11.2.5.4. Recent Developments
- 11.2.5.5. Financials (Based on Availability)
- 11.2.6 Kahariam Farms
- 11.2.6.1. Overview
- 11.2.6.2. Products
- 11.2.6.3. SWOT Analysis
- 11.2.6.4. Recent Developments
- 11.2.6.5. Financials (Based on Availability)
- 11.2.7 SAOSIS
- 11.2.7.1. Overview
- 11.2.7.2. Products
- 11.2.7.3. SWOT Analysis
- 11.2.7.4. Recent Developments
- 11.2.7.5. Financials (Based on Availability)
- 11.2.8 Sri Gayathri Biotec
- 11.2.8.1. Overview
- 11.2.8.2. Products
- 11.2.8.3. SWOT Analysis
- 11.2.8.4. Recent Developments
- 11.2.8.5. Financials (Based on Availability)
- 11.2.9 Jialiming
- 11.2.9.1. Overview
- 11.2.9.2. Products
- 11.2.9.3. SWOT Analysis
- 11.2.9.4. Recent Developments
- 11.2.9.5. Financials (Based on Availability)
- 11.2.10 Dirt Dynasty
- 11.2.10.1. Overview
- 11.2.10.2. Products
- 11.2.10.3. SWOT Analysis
- 11.2.10.4. Recent Developments
- 11.2.10.5. Financials (Based on Availability)
- 11.2.11 SLO County Worm Farm
- 11.2.11.1. Overview
- 11.2.11.2. Products
- 11.2.11.3. SWOT Analysis
- 11.2.11.4. Recent Developments
- 11.2.11.5. Financials (Based on Availability)
- 11.2.12 Agrilife
- 11.2.12.1. Overview
- 11.2.12.2. Products
- 11.2.12.3. SWOT Analysis
- 11.2.12.4. Recent Developments
- 11.2.12.5. Financials (Based on Availability)
- 11.2.13 Suman Vermi Compost
- 11.2.13.1. Overview
- 11.2.13.2. Products
- 11.2.13.3. SWOT Analysis
- 11.2.13.4. Recent Developments
- 11.2.13.5. Financials (Based on Availability)
- 11.2.1 MyNOKE
List of Figures
- Figure 1: Global vermicompost Revenue Breakdown (million, %) by Region 2024 & 2032
- Figure 2: Global vermicompost Volume Breakdown (K, %) by Region 2024 & 2032
- Figure 3: North America vermicompost Revenue (million), by Application 2024 & 2032
- Figure 4: North America vermicompost Volume (K), by Application 2024 & 2032
- Figure 5: North America vermicompost Revenue Share (%), by Application 2024 & 2032
- Figure 6: North America vermicompost Volume Share (%), by Application 2024 & 2032
- Figure 7: North America vermicompost Revenue (million), by Types 2024 & 2032
- Figure 8: North America vermicompost Volume (K), by Types 2024 & 2032
- Figure 9: North America vermicompost Revenue Share (%), by Types 2024 & 2032
- Figure 10: North America vermicompost Volume Share (%), by Types 2024 & 2032
- Figure 11: North America vermicompost Revenue (million), by Country 2024 & 2032
- Figure 12: North America vermicompost Volume (K), by Country 2024 & 2032
- Figure 13: North America vermicompost Revenue Share (%), by Country 2024 & 2032
- Figure 14: North America vermicompost Volume Share (%), by Country 2024 & 2032
- Figure 15: South America vermicompost Revenue (million), by Application 2024 & 2032
- Figure 16: South America vermicompost Volume (K), by Application 2024 & 2032
- Figure 17: South America vermicompost Revenue Share (%), by Application 2024 & 2032
- Figure 18: South America vermicompost Volume Share (%), by Application 2024 & 2032
- Figure 19: South America vermicompost Revenue (million), by Types 2024 & 2032
- Figure 20: South America vermicompost Volume (K), by Types 2024 & 2032
- Figure 21: South America vermicompost Revenue Share (%), by Types 2024 & 2032
- Figure 22: South America vermicompost Volume Share (%), by Types 2024 & 2032
- Figure 23: South America vermicompost Revenue (million), by Country 2024 & 2032
- Figure 24: South America vermicompost Volume (K), by Country 2024 & 2032
- Figure 25: South America vermicompost Revenue Share (%), by Country 2024 & 2032
- Figure 26: South America vermicompost Volume Share (%), by Country 2024 & 2032
- Figure 27: Europe vermicompost Revenue (million), by Application 2024 & 2032
- Figure 28: Europe vermicompost Volume (K), by Application 2024 & 2032
- Figure 29: Europe vermicompost Revenue Share (%), by Application 2024 & 2032
- Figure 30: Europe vermicompost Volume Share (%), by Application 2024 & 2032
- Figure 31: Europe vermicompost Revenue (million), by Types 2024 & 2032
- Figure 32: Europe vermicompost Volume (K), by Types 2024 & 2032
- Figure 33: Europe vermicompost Revenue Share (%), by Types 2024 & 2032
- Figure 34: Europe vermicompost Volume Share (%), by Types 2024 & 2032
- Figure 35: Europe vermicompost Revenue (million), by Country 2024 & 2032
- Figure 36: Europe vermicompost Volume (K), by Country 2024 & 2032
- Figure 37: Europe vermicompost Revenue Share (%), by Country 2024 & 2032
- Figure 38: Europe vermicompost Volume Share (%), by Country 2024 & 2032
- Figure 39: Middle East & Africa vermicompost Revenue (million), by Application 2024 & 2032
- Figure 40: Middle East & Africa vermicompost Volume (K), by Application 2024 & 2032
- Figure 41: Middle East & Africa vermicompost Revenue Share (%), by Application 2024 & 2032
- Figure 42: Middle East & Africa vermicompost Volume Share (%), by Application 2024 & 2032
- Figure 43: Middle East & Africa vermicompost Revenue (million), by Types 2024 & 2032
- Figure 44: Middle East & Africa vermicompost Volume (K), by Types 2024 & 2032
- Figure 45: Middle East & Africa vermicompost Revenue Share (%), by Types 2024 & 2032
- Figure 46: Middle East & Africa vermicompost Volume Share (%), by Types 2024 & 2032
- Figure 47: Middle East & Africa vermicompost Revenue (million), by Country 2024 & 2032
- Figure 48: Middle East & Africa vermicompost Volume (K), by Country 2024 & 2032
- Figure 49: Middle East & Africa vermicompost Revenue Share (%), by Country 2024 & 2032
- Figure 50: Middle East & Africa vermicompost Volume Share (%), by Country 2024 & 2032
- Figure 51: Asia Pacific vermicompost Revenue (million), by Application 2024 & 2032
- Figure 52: Asia Pacific vermicompost Volume (K), by Application 2024 & 2032
- Figure 53: Asia Pacific vermicompost Revenue Share (%), by Application 2024 & 2032
- Figure 54: Asia Pacific vermicompost Volume Share (%), by Application 2024 & 2032
- Figure 55: Asia Pacific vermicompost Revenue (million), by Types 2024 & 2032
- Figure 56: Asia Pacific vermicompost Volume (K), by Types 2024 & 2032
- Figure 57: Asia Pacific vermicompost Revenue Share (%), by Types 2024 & 2032
- Figure 58: Asia Pacific vermicompost Volume Share (%), by Types 2024 & 2032
- Figure 59: Asia Pacific vermicompost Revenue (million), by Country 2024 & 2032
- Figure 60: Asia Pacific vermicompost Volume (K), by Country 2024 & 2032
- Figure 61: Asia Pacific vermicompost Revenue Share (%), by Country 2024 & 2032
- Figure 62: Asia Pacific vermicompost Volume Share (%), by Country 2024 & 2032
List of Tables
- Table 1: Global vermicompost Revenue million Forecast, by Region 2019 & 2032
- Table 2: Global vermicompost Volume K Forecast, by Region 2019 & 2032
- Table 3: Global vermicompost Revenue million Forecast, by Application 2019 & 2032
- Table 4: Global vermicompost Volume K Forecast, by Application 2019 & 2032
- Table 5: Global vermicompost Revenue million Forecast, by Types 2019 & 2032
- Table 6: Global vermicompost Volume K Forecast, by Types 2019 & 2032
- Table 7: Global vermicompost Revenue million Forecast, by Region 2019 & 2032
- Table 8: Global vermicompost Volume K Forecast, by Region 2019 & 2032
- Table 9: Global vermicompost Revenue million Forecast, by Application 2019 & 2032
- Table 10: Global vermicompost Volume K Forecast, by Application 2019 & 2032
- Table 11: Global vermicompost Revenue million Forecast, by Types 2019 & 2032
- Table 12: Global vermicompost Volume K Forecast, by Types 2019 & 2032
- Table 13: Global vermicompost Revenue million Forecast, by Country 2019 & 2032
- Table 14: Global vermicompost Volume K Forecast, by Country 2019 & 2032
- Table 15: United States vermicompost Revenue (million) Forecast, by Application 2019 & 2032
- Table 16: United States vermicompost Volume (K) Forecast, by Application 2019 & 2032
- Table 17: Canada vermicompost Revenue (million) Forecast, by Application 2019 & 2032
- Table 18: Canada vermicompost Volume (K) Forecast, by Application 2019 & 2032
- Table 19: Mexico vermicompost Revenue (million) Forecast, by Application 2019 & 2032
- Table 20: Mexico vermicompost Volume (K) Forecast, by Application 2019 & 2032
- Table 21: Global vermicompost Revenue million Forecast, by Application 2019 & 2032
- Table 22: Global vermicompost Volume K Forecast, by Application 2019 & 2032
- Table 23: Global vermicompost Revenue million Forecast, by Types 2019 & 2032
- Table 24: Global vermicompost Volume K Forecast, by Types 2019 & 2032
- Table 25: Global vermicompost Revenue million Forecast, by Country 2019 & 2032
- Table 26: Global vermicompost Volume K Forecast, by Country 2019 & 2032
- Table 27: Brazil vermicompost Revenue (million) Forecast, by Application 2019 & 2032
- Table 28: Brazil vermicompost Volume (K) Forecast, by Application 2019 & 2032
- Table 29: Argentina vermicompost Revenue (million) Forecast, by Application 2019 & 2032
- Table 30: Argentina vermicompost Volume (K) Forecast, by Application 2019 & 2032
- Table 31: Rest of South America vermicompost Revenue (million) Forecast, by Application 2019 & 2032
- Table 32: Rest of South America vermicompost Volume (K) Forecast, by Application 2019 & 2032
- Table 33: Global vermicompost Revenue million Forecast, by Application 2019 & 2032
- Table 34: Global vermicompost Volume K Forecast, by Application 2019 & 2032
- Table 35: Global vermicompost Revenue million Forecast, by Types 2019 & 2032
- Table 36: Global vermicompost Volume K Forecast, by Types 2019 & 2032
- Table 37: Global vermicompost Revenue million Forecast, by Country 2019 & 2032
- Table 38: Global vermicompost Volume K Forecast, by Country 2019 & 2032
- Table 39: United Kingdom vermicompost Revenue (million) Forecast, by Application 2019 & 2032
- Table 40: United Kingdom vermicompost Volume (K) Forecast, by Application 2019 & 2032
- Table 41: Germany vermicompost Revenue (million) Forecast, by Application 2019 & 2032
- Table 42: Germany vermicompost Volume (K) Forecast, by Application 2019 & 2032
- Table 43: France vermicompost Revenue (million) Forecast, by Application 2019 & 2032
- Table 44: France vermicompost Volume (K) Forecast, by Application 2019 & 2032
- Table 45: Italy vermicompost Revenue (million) Forecast, by Application 2019 & 2032
- Table 46: Italy vermicompost Volume (K) Forecast, by Application 2019 & 2032
- Table 47: Spain vermicompost Revenue (million) Forecast, by Application 2019 & 2032
- Table 48: Spain vermicompost Volume (K) Forecast, by Application 2019 & 2032
- Table 49: Russia vermicompost Revenue (million) Forecast, by Application 2019 & 2032
- Table 50: Russia vermicompost Volume (K) Forecast, by Application 2019 & 2032
- Table 51: Benelux vermicompost Revenue (million) Forecast, by Application 2019 & 2032
- Table 52: Benelux vermicompost Volume (K) Forecast, by Application 2019 & 2032
- Table 53: Nordics vermicompost Revenue (million) Forecast, by Application 2019 & 2032
- Table 54: Nordics vermicompost Volume (K) Forecast, by Application 2019 & 2032
- Table 55: Rest of Europe vermicompost Revenue (million) Forecast, by Application 2019 & 2032
- Table 56: Rest of Europe vermicompost Volume (K) Forecast, by Application 2019 & 2032
- Table 57: Global vermicompost Revenue million Forecast, by Application 2019 & 2032
- Table 58: Global vermicompost Volume K Forecast, by Application 2019 & 2032
- Table 59: Global vermicompost Revenue million Forecast, by Types 2019 & 2032
- Table 60: Global vermicompost Volume K Forecast, by Types 2019 & 2032
- Table 61: Global vermicompost Revenue million Forecast, by Country 2019 & 2032
- Table 62: Global vermicompost Volume K Forecast, by Country 2019 & 2032
- Table 63: Turkey vermicompost Revenue (million) Forecast, by Application 2019 & 2032
- Table 64: Turkey vermicompost Volume (K) Forecast, by Application 2019 & 2032
- Table 65: Israel vermicompost Revenue (million) Forecast, by Application 2019 & 2032
- Table 66: Israel vermicompost Volume (K) Forecast, by Application 2019 & 2032
- Table 67: GCC vermicompost Revenue (million) Forecast, by Application 2019 & 2032
- Table 68: GCC vermicompost Volume (K) Forecast, by Application 2019 & 2032
- Table 69: North Africa vermicompost Revenue (million) Forecast, by Application 2019 & 2032
- Table 70: North Africa vermicompost Volume (K) Forecast, by Application 2019 & 2032
- Table 71: South Africa vermicompost Revenue (million) Forecast, by Application 2019 & 2032
- Table 72: South Africa vermicompost Volume (K) Forecast, by Application 2019 & 2032
- Table 73: Rest of Middle East & Africa vermicompost Revenue (million) Forecast, by Application 2019 & 2032
- Table 74: Rest of Middle East & Africa vermicompost Volume (K) Forecast, by Application 2019 & 2032
- Table 75: Global vermicompost Revenue million Forecast, by Application 2019 & 2032
- Table 76: Global vermicompost Volume K Forecast, by Application 2019 & 2032
- Table 77: Global vermicompost Revenue million Forecast, by Types 2019 & 2032
- Table 78: Global vermicompost Volume K Forecast, by Types 2019 & 2032
- Table 79: Global vermicompost Revenue million Forecast, by Country 2019 & 2032
- Table 80: Global vermicompost Volume K Forecast, by Country 2019 & 2032
- Table 81: China vermicompost Revenue (million) Forecast, by Application 2019 & 2032
- Table 82: China vermicompost Volume (K) Forecast, by Application 2019 & 2032
- Table 83: India vermicompost Revenue (million) Forecast, by Application 2019 & 2032
- Table 84: India vermicompost Volume (K) Forecast, by Application 2019 & 2032
- Table 85: Japan vermicompost Revenue (million) Forecast, by Application 2019 & 2032
- Table 86: Japan vermicompost Volume (K) Forecast, by Application 2019 & 2032
- Table 87: South Korea vermicompost Revenue (million) Forecast, by Application 2019 & 2032
- Table 88: South Korea vermicompost Volume (K) Forecast, by Application 2019 & 2032
- Table 89: ASEAN vermicompost Revenue (million) Forecast, by Application 2019 & 2032
- Table 90: ASEAN vermicompost Volume (K) Forecast, by Application 2019 & 2032
- Table 91: Oceania vermicompost Revenue (million) Forecast, by Application 2019 & 2032
- Table 92: Oceania vermicompost Volume (K) Forecast, by Application 2019 & 2032
- Table 93: Rest of Asia Pacific vermicompost Revenue (million) Forecast, by Application 2019 & 2032
- Table 94: Rest of Asia Pacific vermicompost Volume (K) Forecast, by Application 2019 & 2032
Frequently Asked Questions
1. What is the projected Compound Annual Growth Rate (CAGR) of the vermicompost?
The projected CAGR is approximately XX%.
2. Which companies are prominent players in the vermicompost?
Key companies in the market include MyNOKE, NutriSoil, Davo’s Worm Farms, Earthworm, Wormpower, Kahariam Farms, SAOSIS, Sri Gayathri Biotec, Jialiming, Dirt Dynasty, SLO County Worm Farm, Agrilife, Suman Vermi Compost.
3. What are the main segments of the vermicompost?
The market segments include Application, Types.
4. Can you provide details about the market size?
The market size is estimated to be USD XXX million as of 2022.
5. What are some drivers contributing to market growth?
N/A
6. What are the notable trends driving market growth?
N/A
7. Are there any restraints impacting market growth?
N/A
8. Can you provide examples of recent developments in the market?
N/A
9. What pricing options are available for accessing the report?
Pricing options include single-user, multi-user, and enterprise licenses priced at USD 4350.00, USD 6525.00, and USD 8700.00 respectively.
10. Is the market size provided in terms of value or volume?
The market size is provided in terms of value, measured in million and volume, measured in K.
11. Are there any specific market keywords associated with the report?
Yes, the market keyword associated with the report is "vermicompost," which aids in identifying and referencing the specific market segment covered.
12. How do I determine which pricing option suits my needs best?
The pricing options vary based on user requirements and access needs. Individual users may opt for single-user licenses, while businesses requiring broader access may choose multi-user or enterprise licenses for cost-effective access to the report.
13. Are there any additional resources or data provided in the vermicompost report?
While the report offers comprehensive insights, it's advisable to review the specific contents or supplementary materials provided to ascertain if additional resources or data are available.
14. How can I stay updated on further developments or reports in the vermicompost?
To stay informed about further developments, trends, and reports in the vermicompost, consider subscribing to industry newsletters, following relevant companies and organizations, or regularly checking reputable industry news sources and publications.
Methodology
Step 1 - Identification of Relevant Samples Size from Population Database


Step 2 - Approaches for Defining Global Market Size (Value, Volume* & Price*)

Note*: In applicable scenarios
Step 3 - Data Sources
Primary Research
- Web Analytics
- Survey Reports
- Research Institute
- Latest Research Reports
- Opinion Leaders
Secondary Research
- Annual Reports
- White Paper
- Latest Press Release
- Industry Association
- Paid Database
- Investor Presentations

Step 4 - Data Triangulation
Involves using different sources of information in order to increase the validity of a study
These sources are likely to be stakeholders in a program - participants, other researchers, program staff, other community members, and so on.
Then we put all data in single framework & apply various statistical tools to find out the dynamic on the market.
During the analysis stage, feedback from the stakeholder groups would be compared to determine areas of agreement as well as areas of divergence
