

Key Insights
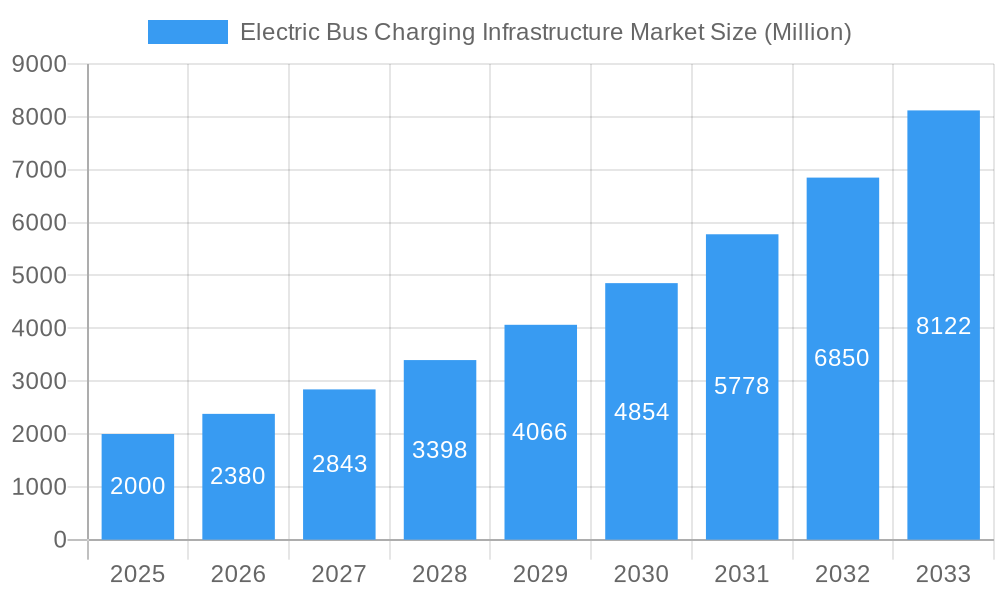
The Electric Bus Charging Infrastructure market is experiencing robust growth, projected to reach a substantial size with a Compound Annual Growth Rate (CAGR) of 19% from 2025 to 2033. This expansion is driven by several key factors. The increasing adoption of electric buses globally, spurred by stringent emission regulations and a growing focus on sustainable transportation, is a primary driver. Governments worldwide are actively incentivizing the transition to electric fleets through subsidies, tax breaks, and infrastructure development programs. Furthermore, advancements in battery technology, leading to longer ranges and faster charging times, are significantly enhancing the viability and attractiveness of electric buses. The market is segmented by charging type, encompassing plug-in and overhead charging solutions, each catering to specific operational needs and bus designs. Competition is fierce, with a mix of established players like ABB, Siemens, and ChargePoint, alongside specialized electric vehicle solutions providers and bus manufacturers themselves integrating charging infrastructure into their offerings. Geographic growth is expected to be diverse, with North America and Europe leading initially due to established EV infrastructure and supportive policies, but the Asia-Pacific region is anticipated to show significant acceleration in the later forecast period due to rapid urbanization and substantial government investments in public transportation modernization.
Electric Bus Charging Infrastructure Market Market Size (In Billion)
The market’s growth trajectory, however, is not without challenges. High initial investment costs associated with installing charging infrastructure remain a significant restraint, particularly in developing economies. The need for robust grid infrastructure to support the increased electricity demand from charging numerous buses concurrently also poses a considerable hurdle. Furthermore, the interoperability of charging systems across different manufacturers and regions requires standardization efforts to ensure seamless operation and prevent fragmentation of the market. Despite these challenges, the long-term outlook remains positive, fueled by the unrelenting push towards decarbonization and the growing global demand for efficient and environmentally friendly public transportation solutions. The market is poised for substantial growth, driven by technological advancements, supportive policies, and the increasing awareness of the environmental and economic benefits of electric buses.
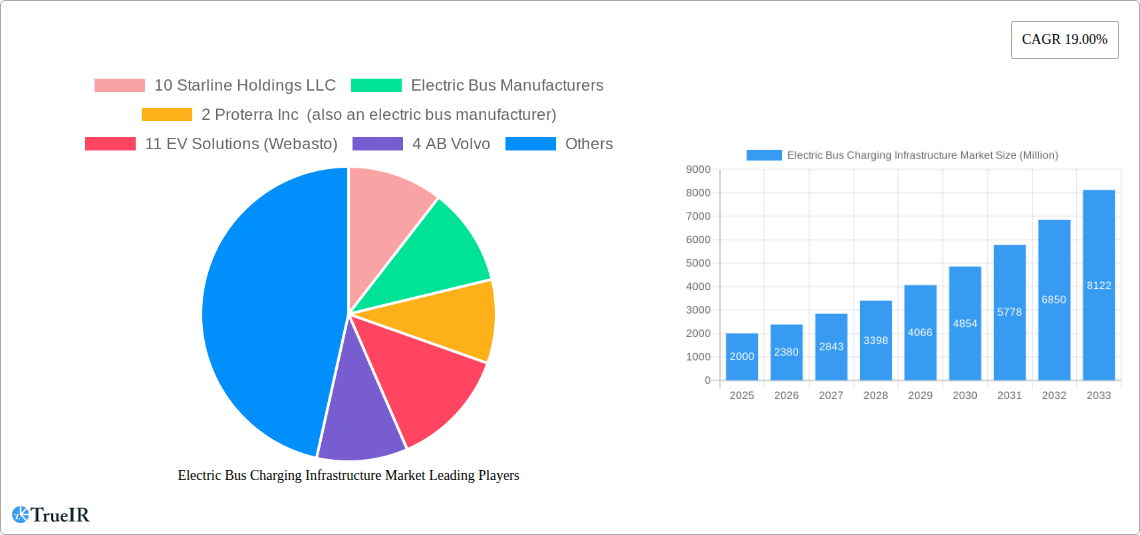
Electric Bus Charging Infrastructure Market Company Market Share
Electric Bus Charging Infrastructure Market: A Comprehensive Report (2019-2033)
This dynamic report provides an in-depth analysis of the Electric Bus Charging Infrastructure Market, offering invaluable insights for stakeholders across the value chain. The study covers the period from 2019 to 2033, with 2025 serving as the base and estimated year. We project robust growth, driven by technological advancements, supportive government policies, and the increasing adoption of electric buses globally. This report is essential for investors, manufacturers, charging infrastructure providers, and policymakers seeking to navigate this rapidly evolving market.
Electric Bus Charging Infrastructure Market Market Structure & Competitive Landscape
The electric bus charging infrastructure market exhibits a moderately concentrated structure, with a few major players dominating alongside numerous smaller, regional companies. The Herfindahl-Hirschman Index (HHI) is estimated at xx, indicating a moderately competitive landscape. Key innovation drivers include advancements in charging technologies (e.g., wireless charging, high-power fast charging), improved battery technologies in electric buses, and the development of smart charging solutions for optimal grid management. Regulatory impacts are significant, with government incentives, emission regulations, and grid integration standards shaping market dynamics. Product substitutes are limited, with the primary alternative being diesel or gasoline-powered buses. End-user segmentation includes public transit agencies, school districts, and private fleet operators. The market has witnessed several mergers and acquisitions (M&A) in recent years. The estimated volume of M&A deals in the past five years is around xx, reflecting the consolidation trend within the industry.
- High Concentration: The top 5 players control an estimated xx% market share.
- Innovation Drivers: Wireless charging, high-power fast charging, and smart grid integration.
- Regulatory Influence: Government incentives, emission standards, and grid integration mandates.
- Limited Substitutes: Primarily diesel and gasoline-powered buses.
- End-User Segmentation: Public transit, schools, and private fleets.
- M&A Activity: Approximately xx deals in the last five years, indicating consolidation.
Electric Bus Charging Infrastructure Market Market Trends & Opportunities
The global electric bus charging infrastructure market is experiencing significant growth, with a projected Compound Annual Growth Rate (CAGR) of xx% during the forecast period (2025-2033). This expansion is fueled by several factors. The increasing adoption of electric buses, driven by environmental concerns and government regulations aimed at reducing carbon emissions, is a major market driver. Technological advancements, including the development of faster and more efficient charging technologies, are also playing a crucial role. Consumer preferences are shifting towards eco-friendly transportation solutions, further boosting demand. The market is highly competitive, with established players and new entrants vying for market share. Market penetration rates for electric bus charging infrastructure are steadily increasing, particularly in regions with supportive government policies and robust public transportation networks. Several niche markets, such as wireless charging and depot charging, are also emerging as significant opportunities. The overall market size is estimated at USD xx Million in 2025 and is projected to reach USD xx Million by 2033.
Dominant Markets & Segments in Electric Bus Charging Infrastructure Market
The electric bus charging infrastructure market is experiencing robust growth, propelled by aggressive decarbonization targets, supportive government policies, and the expanding adoption of electric buses globally. Geographically, China continues to lead the market, driven by its comprehensive national strategy for electric vehicle (EV) deployment and substantial investments in public transportation electrification. Europe follows closely, with the European Union's ambitious climate goals and the increasing implementation of low-emission zones creating a fertile ground for electric bus adoption. North America is also a significant and rapidly growing market, spurred by federal and state-level incentives, as well as a rising awareness of the environmental and economic benefits of electric public transport.
Key Market Segments:
- Charging Type:
- Plug-in Charging: This segment currently dominates the market due to its widespread availability, established technology, and cost-effectiveness. It is ideal for overnight charging in depots and serves a large portion of the existing electric bus fleet.
- Overhead Charging (Pantograph Systems): Gaining significant traction, especially in high-utilization routes and busy urban centers. These systems offer rapid charging capabilities, enabling buses to recharge quickly during layovers, thus maximizing operational efficiency. This segment is poised for substantial growth as cities seek to deploy larger fleets and optimize service routes.
- Inductive (Wireless) Charging: While still in its nascent stages, inductive charging presents a compelling future solution, offering enhanced convenience and reduced wear on connectors. Advancements in this area are expected to drive future market expansion.
- Charging Infrastructure:
- Depot Charging: The largest segment, focused on providing charging solutions at bus depots where vehicles are stored overnight.
- Opportunity Charging: Installed at strategic points along bus routes or at termini, enabling rapid top-ups during operational hours. This segment is growing in importance to support longer routes and higher service frequencies.
- Power Output:
- AC Charging: Lower power output, typically used for overnight depot charging.
- DC Fast Charging: Higher power output, essential for opportunity charging and reducing charging times.
Electric Bus Charging Infrastructure Market Product Analysis
The electric bus charging infrastructure market is characterized by a dynamic landscape of innovative solutions designed to meet the diverse operational needs of transit agencies. Key product developments revolve around enhancing charging speed, improving energy efficiency, and ensuring seamless integration with existing electrical grids. Advanced features such as high-power DC fast charging are becoming standard for opportunity charging, minimizing downtime and maximizing bus availability. Smart charging management systems are crucial for optimizing charging schedules, managing electricity costs by leveraging off-peak rates, and mitigating grid impact through load balancing and demand response capabilities. The emergence of plug-and-charge technologies and wireless inductive charging solutions are set to further streamline operations and improve user experience. Competitive advantage in this sector is increasingly determined by the ability to offer scalable, reliable, and interoperable charging solutions that adhere to international safety and communication standards. Manufacturers are also focusing on developing bidirectional charging (V2G - Vehicle-to-Grid) capabilities, which can provide ancillary grid services and create new revenue streams for transit agencies.
Key Drivers, Barriers & Challenges in Electric Bus Charging Infrastructure Market
Key Drivers:
- Government regulations and incentives promoting electric bus adoption.
- Growing environmental concerns and demand for sustainable transportation.
- Technological advancements leading to improved charging efficiency and speed.
Key Challenges:
- High initial investment costs for infrastructure development.
- Grid capacity limitations in certain regions.
- Interoperability issues and standardization challenges.
- Competition from other transportation modes and fuels. Competition among charging infrastructure providers is fierce, potentially leading to price wars and impacting profitability.
Growth Drivers in the Electric Bus Charging Infrastructure Market Market
The trajectory of the electric bus charging infrastructure market is predominantly shaped by a confluence of powerful growth drivers. Foremost among these are the escalating global commitments to combat climate change and reduce greenhouse gas emissions, compelling governments worldwide to implement stringent emission regulations and phase out fossil-fuel-powered vehicles. Supportive government policies, including generous subsidies, tax credits, and preferential procurement programs for electric buses and charging infrastructure, significantly lower the upfront cost and accelerate adoption. Technological advancements in battery energy density, charging speed, and grid integration are continuously improving the performance and feasibility of electric bus operations. The growing operational efficiency and reduced total cost of ownership (TCO) compared to diesel buses, driven by lower fuel and maintenance costs, are making electric buses an increasingly attractive economic proposition for transit authorities. Furthermore, the increasing public awareness and demand for sustainable urban mobility are creating a favorable environment for the widespread deployment of electric public transportation systems.
Challenges Impacting Electric Bus Charging Infrastructure Market Growth
Significant challenges include the substantial upfront costs associated with establishing charging infrastructure, limited grid capacity in certain areas, and the absence of universally accepted technical standards. The high cost of batteries and the fluctuating prices of raw materials also contribute to these challenges. Further, overcoming range anxiety and ensuring the reliability and durability of electric buses and charging infrastructure remains critical for mass adoption.
Key Players Shaping the Electric Bus Charging Infrastructure Market Market
The electric bus charging infrastructure market is a competitive arena featuring established players and innovative newcomers. The following companies are at the forefront, driving technological advancements and market expansion:
- 1 ABB Ltd (ABB Ltd)
- 2 Proterra Inc
- 3 ChargePoint Inc
- 4 Siemens AG (Siemens AG)
- 5 Schneider Electric SE (Schneider Electric SE)
- 6 ALSTOM
- 7 NFI Group Inc
- 8 Heliox Energy
- 9 Vital EV Solutions
- 10 Starline Holdings LLC
- 11 EV Solutions (Webasto)
- 1 BYD Auto Co Ltd
- 2 Mercedes-Benz AG (Mercedes-Benz AG)
- 3 Traton SE
- 4 AB Volvo
- 5 Zhengzhou Yutong Bus Co Ltd
- 6 IVECO S p A
- 7 SemaConnect Inc
Significant Electric Bus Charging Infrastructure Market Industry Milestones
- November 2022: ABB E-Mobility secured USD 214 Million in pre-IPO funding, significantly bolstering its financial capacity for expansion, strategic acquisitions, and further research and development in advanced charging technologies.
- September 2022: ABB E-Mobility inaugurated a new, state-of-the-art manufacturing facility in South Carolina, USA. This expansion created over 100 jobs and boosted the company's domestic production capacity by an impressive 10,000 chargers annually, addressing the growing demand in the North American market.
- August 2022: Siemens and the MAHLE Group announced a strategic partnership aimed at developing and advancing cutting-edge wireless charging systems for electric vehicles. This collaboration seeks to establish new industry standards and accelerate innovation in the field of inductive charging technology for automotive applications.
- Recent Developments: Several key players have announced major contracts for supplying charging infrastructure to large metropolitan transit agencies, underscoring the increasing scale of electric bus deployments and the growing confidence in the reliability and efficiency of their solutions.
- Ongoing Trends: Increased investment in smart grid integration and V2G (Vehicle-to-Grid) pilot projects, demonstrating the potential for electric bus fleets to contribute to grid stability and energy management.
Future Outlook for Electric Bus Charging Infrastructure Market Market
The electric bus charging infrastructure market is poised for sustained growth, driven by a confluence of factors including stringent emission regulations, increasing environmental awareness, and ongoing technological improvements. Strategic partnerships and investments in research and development are expected to further propel innovation, expanding market reach and adoption. The market's potential is significant, particularly in emerging economies where public transportation is rapidly expanding. This growth will create lucrative opportunities for companies involved in manufacturing, installation, and maintenance of charging infrastructure, as well as for businesses developing and implementing smart charging technologies.
Electric Bus Charging Infrastructure Market Segmentation
-
1. Charging Type
- 1.1. Plug-in Charging
- 1.2. Overhead Charging
Electric Bus Charging Infrastructure Market Segmentation By Geography
-
1. North America
- 1.1. United States
- 1.2. Canada
- 1.3. Rest of North America
-
2. Europe
- 2.1. Germany
- 2.2. United Kingdom
- 2.3. France
- 2.4. Italy
- 2.5. Spain
- 2.6. Rest of Europe
-
3. Asia Pacific
- 3.1. China
- 3.2. India
- 3.3. Japan
- 3.4. South Korea
- 3.5. Rest of Asia Pacific
-
4. Rest of the World
- 4.1. South America
- 4.2. Middle East and Africa

Electric Bus Charging Infrastructure Market Regional Market Share
Geographic Coverage of Electric Bus Charging Infrastructure Market
Electric Bus Charging Infrastructure Market REPORT HIGHLIGHTS
| Aspects | Details |
|---|---|
| Study Period | 2020-2034 |
| Base Year | 2025 |
| Estimated Year | 2026 |
| Forecast Period | 2026-2034 |
| Historical Period | 2020-2025 |
| Growth Rate | CAGR of 19.00% from 2020-2034 |
| Segmentation |
|
Table of Contents
- 1. Introduction
- 1.1. Research Scope
- 1.2. Market Segmentation
- 1.3. Research Objective
- 1.4. Definitions and Assumptions
- 2. Executive Summary
- 2.1. Market Snapshot
- 3. Market Dynamics
- 3.1. Market Drivers
- 3.2. Market Restrains
- 3.3. Market Trends
- 3.4. Market Opportunities
- 4. Market Factor Analysis
- 4.1. Porters Five Forces
- 4.1.1. Bargaining Power of Suppliers
- 4.1.2. Bargaining Power of Buyers
- 4.1.3. Threat of New Entrants
- 4.1.4. Threat of Substitutes
- 4.1.5. Competitive Rivalry
- 4.2. PESTEL analysis
- 4.3. BCG Analysis
- 4.3.1. Stars (High Growth, High Market Share)
- 4.3.2. Cash Cows (Low Growth, High Market Share)
- 4.3.3. Question Mark (High Growth, Low Market Share)
- 4.3.4. Dogs (Low Growth, Low Market Share)
- 4.4. Ansoff Matrix Analysis
- 4.5. Supply Chain Analysis
- 4.6. Regulatory Landscape
- 4.7. Current Market Potential and Opportunity Assessment (TAM–SAM–SOM Framework)
- 4.8. TIR Analyst Note
- 4.1. Porters Five Forces
- 5. Market Analysis, Insights and Forecast 2021-2033
- 5.1. Market Analysis, Insights and Forecast - by Charging Type
- 5.1.1. Plug-in Charging
- 5.1.2. Overhead Charging
- 5.2. Market Analysis, Insights and Forecast - by Region
- 5.2.1. North America
- 5.2.2. Europe
- 5.2.3. Asia Pacific
- 5.2.4. Rest of the World
- 5.1. Market Analysis, Insights and Forecast - by Charging Type
- 6. Global Electric Bus Charging Infrastructure Market Analysis, Insights and Forecast, 2021-2033
- 6.1. Market Analysis, Insights and Forecast - by Charging Type
- 6.1.1. Plug-in Charging
- 6.1.2. Overhead Charging
- 6.1. Market Analysis, Insights and Forecast - by Charging Type
- 7. North America Electric Bus Charging Infrastructure Market Analysis, Insights and Forecast, 2020-2032
- 7.1. Market Analysis, Insights and Forecast - by Charging Type
- 7.1.1. Plug-in Charging
- 7.1.2. Overhead Charging
- 7.1. Market Analysis, Insights and Forecast - by Charging Type
- 8. Europe Electric Bus Charging Infrastructure Market Analysis, Insights and Forecast, 2020-2032
- 8.1. Market Analysis, Insights and Forecast - by Charging Type
- 8.1.1. Plug-in Charging
- 8.1.2. Overhead Charging
- 8.1. Market Analysis, Insights and Forecast - by Charging Type
- 9. Asia Pacific Electric Bus Charging Infrastructure Market Analysis, Insights and Forecast, 2020-2032
- 9.1. Market Analysis, Insights and Forecast - by Charging Type
- 9.1.1. Plug-in Charging
- 9.1.2. Overhead Charging
- 9.1. Market Analysis, Insights and Forecast - by Charging Type
- 10. Rest of the World Electric Bus Charging Infrastructure Market Analysis, Insights and Forecast, 2020-2032
- 10.1. Market Analysis, Insights and Forecast - by Charging Type
- 10.1.1. Plug-in Charging
- 10.1.2. Overhead Charging
- 10.1. Market Analysis, Insights and Forecast - by Charging Type
- 11. Competitive Analysis
- 11.1. Company Profiles
- 11.1.1 10 Starline Holdings LLC
- 11.1.1.1. Company Overview
- 11.1.1.2. Products
- 11.1.1.3. Company Financials
- 11.1.1.4. SWOT Analysis
- 11.1.2 Electric Bus Manufacturers
- 11.1.2.1. Company Overview
- 11.1.2.2. Products
- 11.1.2.3. Company Financials
- 11.1.2.4. SWOT Analysis
- 11.1.3 2 Proterra Inc (also an electric bus manufacturer)
- 11.1.3.1. Company Overview
- 11.1.3.2. Products
- 11.1.3.3. Company Financials
- 11.1.3.4. SWOT Analysis
- 11.1.4 11 EV Solutions (Webasto)
- 11.1.4.1. Company Overview
- 11.1.4.2. Products
- 11.1.4.3. Company Financials
- 11.1.4.4. SWOT Analysis
- 11.1.5 4 AB Volvo
- 11.1.5.1. Company Overview
- 11.1.5.2. Products
- 11.1.5.3. Company Financials
- 11.1.5.4. SWOT Analysis
- 11.1.6 3 ChargePoint Inc
- 11.1.6.1. Company Overview
- 11.1.6.2. Products
- 11.1.6.3. Company Financials
- 11.1.6.4. SWOT Analysis
- 11.1.7 1 BYD Auto Co Ltd
- 11.1.7.1. Company Overview
- 11.1.7.2. Products
- 11.1.7.3. Company Financials
- 11.1.7.4. SWOT Analysis
- 11.1.8 1 ABB Ltd
- 11.1.8.1. Company Overview
- 11.1.8.2. Products
- 11.1.8.3. Company Financials
- 11.1.8.4. SWOT Analysis
- 11.1.9 8 Heliox Energy
- 11.1.9.1. Company Overview
- 11.1.9.2. Products
- 11.1.9.3. Company Financials
- 11.1.9.4. SWOT Analysis
- 11.1.10 6 ALSTOM
- 11.1.10.1. Company Overview
- 11.1.10.2. Products
- 11.1.10.3. Company Financials
- 11.1.10.4. SWOT Analysis
- 11.1.11 5 Zhengzhou Yutong Bus Co Ltd
- 11.1.11.1. Company Overview
- 11.1.11.2. Products
- 11.1.11.3. Company Financials
- 11.1.11.4. SWOT Analysis
- 11.1.12 7 SemaConnect Inc
- 11.1.12.1. Company Overview
- 11.1.12.2. Products
- 11.1.12.3. Company Financials
- 11.1.12.4. SWOT Analysis
- 11.1.13 2 Mercedes-Benz AG
- 11.1.13.1. Company Overview
- 11.1.13.2. Products
- 11.1.13.3. Company Financials
- 11.1.13.4. SWOT Analysis
- 11.1.14 3 Traton SE
- 11.1.14.1. Company Overview
- 11.1.14.2. Products
- 11.1.14.3. Company Financials
- 11.1.14.4. SWOT Analysis
- 11.1.15 4 Siemens AG
- 11.1.15.1. Company Overview
- 11.1.15.2. Products
- 11.1.15.3. Company Financials
- 11.1.15.4. SWOT Analysis
- 11.1.16 7 NFI Group Inc
- 11.1.16.1. Company Overview
- 11.1.16.2. Products
- 11.1.16.3. Company Financials
- 11.1.16.4. SWOT Analysis
- 11.1.17 5 Schneider Electric SE
- 11.1.17.1. Company Overview
- 11.1.17.2. Products
- 11.1.17.3. Company Financials
- 11.1.17.4. SWOT Analysis
- 11.1.18 6 IVECO S p A
- 11.1.18.1. Company Overview
- 11.1.18.2. Products
- 11.1.18.3. Company Financials
- 11.1.18.4. SWOT Analysis
- 11.1.19 9 Vital EV Solutions
- 11.1.19.1. Company Overview
- 11.1.19.2. Products
- 11.1.19.3. Company Financials
- 11.1.19.4. SWOT Analysis
- 11.1.20 Electric Charging Infrastructure Suppliers
- 11.1.20.1. Company Overview
- 11.1.20.2. Products
- 11.1.20.3. Company Financials
- 11.1.20.4. SWOT Analysis
- 11.1.1 10 Starline Holdings LLC
- 11.2. Market Entropy
- 11.2.1 Company's Key Areas Served
- 11.2.2 Recent Developments
- 11.3. Company Market Share Analysis 2025
- 11.3.1 Top 5 Companies Market Share Analysis
- 11.3.2 Top 3 Companies Market Share Analysis
- 11.4. List of Potential Customers
- 12. Research Methodology
List of Figures
- Figure 1: Global Electric Bus Charging Infrastructure Market Revenue Breakdown (Million, %) by Region 2025 & 2033
- Figure 2: North America Electric Bus Charging Infrastructure Market Revenue (Million), by Charging Type 2025 & 2033
- Figure 3: North America Electric Bus Charging Infrastructure Market Revenue Share (%), by Charging Type 2025 & 2033
- Figure 4: North America Electric Bus Charging Infrastructure Market Revenue (Million), by Country 2025 & 2033
- Figure 5: North America Electric Bus Charging Infrastructure Market Revenue Share (%), by Country 2025 & 2033
- Figure 6: Europe Electric Bus Charging Infrastructure Market Revenue (Million), by Charging Type 2025 & 2033
- Figure 7: Europe Electric Bus Charging Infrastructure Market Revenue Share (%), by Charging Type 2025 & 2033
- Figure 8: Europe Electric Bus Charging Infrastructure Market Revenue (Million), by Country 2025 & 2033
- Figure 9: Europe Electric Bus Charging Infrastructure Market Revenue Share (%), by Country 2025 & 2033
- Figure 10: Asia Pacific Electric Bus Charging Infrastructure Market Revenue (Million), by Charging Type 2025 & 2033
- Figure 11: Asia Pacific Electric Bus Charging Infrastructure Market Revenue Share (%), by Charging Type 2025 & 2033
- Figure 12: Asia Pacific Electric Bus Charging Infrastructure Market Revenue (Million), by Country 2025 & 2033
- Figure 13: Asia Pacific Electric Bus Charging Infrastructure Market Revenue Share (%), by Country 2025 & 2033
- Figure 14: Rest of the World Electric Bus Charging Infrastructure Market Revenue (Million), by Charging Type 2025 & 2033
- Figure 15: Rest of the World Electric Bus Charging Infrastructure Market Revenue Share (%), by Charging Type 2025 & 2033
- Figure 16: Rest of the World Electric Bus Charging Infrastructure Market Revenue (Million), by Country 2025 & 2033
- Figure 17: Rest of the World Electric Bus Charging Infrastructure Market Revenue Share (%), by Country 2025 & 2033
List of Tables
- Table 1: Global Electric Bus Charging Infrastructure Market Revenue Million Forecast, by Charging Type 2020 & 2033
- Table 2: Global Electric Bus Charging Infrastructure Market Revenue Million Forecast, by Region 2020 & 2033
- Table 3: Global Electric Bus Charging Infrastructure Market Revenue Million Forecast, by Charging Type 2020 & 2033
- Table 4: Global Electric Bus Charging Infrastructure Market Revenue Million Forecast, by Country 2020 & 2033
- Table 5: United States Electric Bus Charging Infrastructure Market Revenue (Million) Forecast, by Application 2020 & 2033
- Table 6: Canada Electric Bus Charging Infrastructure Market Revenue (Million) Forecast, by Application 2020 & 2033
- Table 7: Rest of North America Electric Bus Charging Infrastructure Market Revenue (Million) Forecast, by Application 2020 & 2033
- Table 8: Global Electric Bus Charging Infrastructure Market Revenue Million Forecast, by Charging Type 2020 & 2033
- Table 9: Global Electric Bus Charging Infrastructure Market Revenue Million Forecast, by Country 2020 & 2033
- Table 10: Germany Electric Bus Charging Infrastructure Market Revenue (Million) Forecast, by Application 2020 & 2033
- Table 11: United Kingdom Electric Bus Charging Infrastructure Market Revenue (Million) Forecast, by Application 2020 & 2033
- Table 12: France Electric Bus Charging Infrastructure Market Revenue (Million) Forecast, by Application 2020 & 2033
- Table 13: Italy Electric Bus Charging Infrastructure Market Revenue (Million) Forecast, by Application 2020 & 2033
- Table 14: Spain Electric Bus Charging Infrastructure Market Revenue (Million) Forecast, by Application 2020 & 2033
- Table 15: Rest of Europe Electric Bus Charging Infrastructure Market Revenue (Million) Forecast, by Application 2020 & 2033
- Table 16: Global Electric Bus Charging Infrastructure Market Revenue Million Forecast, by Charging Type 2020 & 2033
- Table 17: Global Electric Bus Charging Infrastructure Market Revenue Million Forecast, by Country 2020 & 2033
- Table 18: China Electric Bus Charging Infrastructure Market Revenue (Million) Forecast, by Application 2020 & 2033
- Table 19: India Electric Bus Charging Infrastructure Market Revenue (Million) Forecast, by Application 2020 & 2033
- Table 20: Japan Electric Bus Charging Infrastructure Market Revenue (Million) Forecast, by Application 2020 & 2033
- Table 21: South Korea Electric Bus Charging Infrastructure Market Revenue (Million) Forecast, by Application 2020 & 2033
- Table 22: Rest of Asia Pacific Electric Bus Charging Infrastructure Market Revenue (Million) Forecast, by Application 2020 & 2033
- Table 23: Global Electric Bus Charging Infrastructure Market Revenue Million Forecast, by Charging Type 2020 & 2033
- Table 24: Global Electric Bus Charging Infrastructure Market Revenue Million Forecast, by Country 2020 & 2033
- Table 25: South America Electric Bus Charging Infrastructure Market Revenue (Million) Forecast, by Application 2020 & 2033
- Table 26: Middle East and Africa Electric Bus Charging Infrastructure Market Revenue (Million) Forecast, by Application 2020 & 2033
Frequently Asked Questions
1. What is the projected Compound Annual Growth Rate (CAGR) of the Electric Bus Charging Infrastructure Market?
The projected CAGR is approximately 19.00%.
2. Which companies are prominent players in the Electric Bus Charging Infrastructure Market?
Key companies in the market include 10 Starline Holdings LLC, Electric Bus Manufacturers, 2 Proterra Inc (also an electric bus manufacturer), 11 EV Solutions (Webasto), 4 AB Volvo, 3 ChargePoint Inc, 1 BYD Auto Co Ltd, 1 ABB Ltd, 8 Heliox Energy, 6 ALSTOM, 5 Zhengzhou Yutong Bus Co Ltd, 7 SemaConnect Inc, 2 Mercedes-Benz AG, 3 Traton SE, 4 Siemens AG, 7 NFI Group Inc, 5 Schneider Electric SE, 6 IVECO S p A, 9 Vital EV Solutions, Electric Charging Infrastructure Suppliers.
3. What are the main segments of the Electric Bus Charging Infrastructure Market?
The market segments include Charging Type.
4. Can you provide details about the market size?
The market size is estimated to be USD 2 Million as of 2022.
5. What are some drivers contributing to market growth?
Rising Adoption of Electric Buses.
6. What are the notable trends driving market growth?
Governmental Efforts to Increase in the Number of Electric Buses Will Boost Overhead Charging Type.
7. Are there any restraints impacting market growth?
High Upfront Investment.
8. Can you provide examples of recent developments in the market?
November 2022: ABB E-Mobility, the electric vehicle charging solutions subsidiary of ABB Ltd., successfully raised CHF 200 million (USD 214 million) in a pre-IPO private placement led by a group of minority investors. The capital infusion will play a crucial role in supporting the company's growth strategy, which includes pursuing both organic and inorganic opportunities, such as potential mergers and acquisitions. The transaction is expected to be finalized in the fourth quarter of 2022.
9. What pricing options are available for accessing the report?
Pricing options include single-user, multi-user, and enterprise licenses priced at USD 4750, USD 5250, and USD 8750 respectively.
10. Is the market size provided in terms of value or volume?
The market size is provided in terms of value, measured in Million.
11. Are there any specific market keywords associated with the report?
Yes, the market keyword associated with the report is "Electric Bus Charging Infrastructure Market," which aids in identifying and referencing the specific market segment covered.
12. How do I determine which pricing option suits my needs best?
The pricing options vary based on user requirements and access needs. Individual users may opt for single-user licenses, while businesses requiring broader access may choose multi-user or enterprise licenses for cost-effective access to the report.
13. Are there any additional resources or data provided in the Electric Bus Charging Infrastructure Market report?
While the report offers comprehensive insights, it's advisable to review the specific contents or supplementary materials provided to ascertain if additional resources or data are available.
14. How can I stay updated on further developments or reports in the Electric Bus Charging Infrastructure Market?
To stay informed about further developments, trends, and reports in the Electric Bus Charging Infrastructure Market, consider subscribing to industry newsletters, following relevant companies and organizations, or regularly checking reputable industry news sources and publications.
Methodology
Step 1 - Identification of Relevant Samples Size from Population Database


Step 2 - Approaches for Defining Global Market Size (Value, Volume* & Price*)

Note*: In applicable scenarios
Step 3 - Data Sources
Primary Research
- Web Analytics
- Survey Reports
- Research Institute
- Latest Research Reports
- Opinion Leaders
Secondary Research
- Annual Reports
- White Paper
- Latest Press Release
- Industry Association
- Paid Database
- Investor Presentations

Step 4 - Data Triangulation
Involves using different sources of information in order to increase the validity of a study
These sources are likely to be stakeholders in a program - participants, other researchers, program staff, other community members, and so on.
Then we put all data in single framework & apply various statistical tools to find out the dynamic on the market.
During the analysis stage, feedback from the stakeholder groups would be compared to determine areas of agreement as well as areas of divergence