

Key Insights
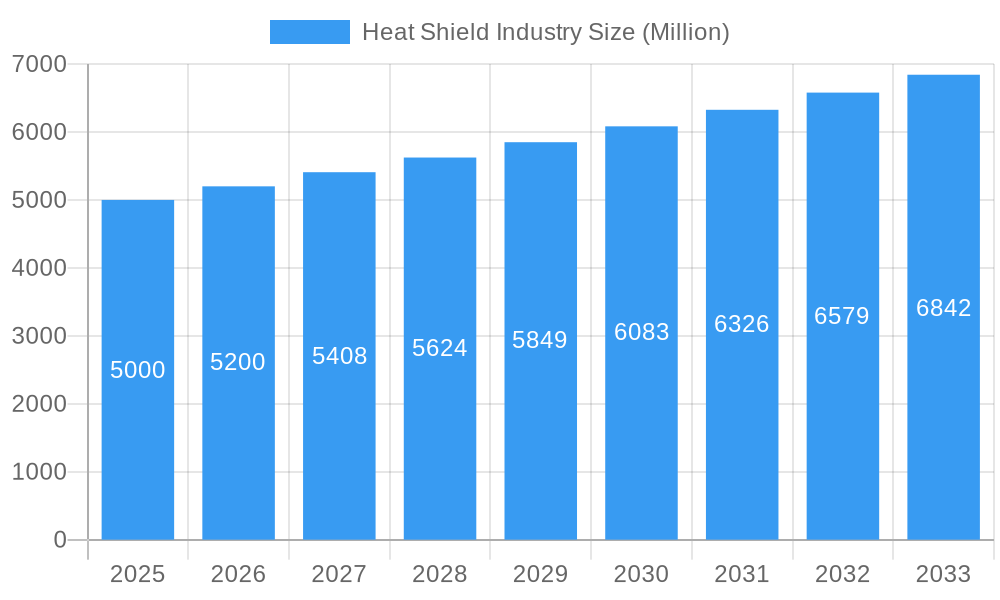
The global heat shield market is projected for significant expansion, driven by escalating automotive safety mandates and the pursuit of enhanced fuel efficiency. With an estimated market size of $5.18 billion in the base year 2025, the market is anticipated to grow at a Compound Annual Growth Rate (CAGR) of 5.5%. This robust growth trajectory is underpinned by several critical factors. Increasingly stringent governmental regulations on vehicle emissions and safety standards are compelling automotive manufacturers to integrate advanced heat shielding technologies. The accelerating adoption of electric vehicles (EVs) further fuels this market, as effective thermal management is crucial for protecting sensitive battery components and ensuring optimal performance. Furthermore, the growing utilization of lightweight materials in automotive production opens avenues for innovative heat shield solutions that deliver both superior heat resistance and weight reduction. The market is segmented by type (engine compartment, exhaust compartment, other), vehicle type (passenger cars, commercial vehicles), and sales channel (OEMs, aftermarket). The automotive sector leads, with passenger cars currently holding a larger share, though commercial vehicles are exhibiting promising growth driven by rising freight transportation demands. Leading market participants, including Lydall Inc, Talbros Automotive Components Ltd, and Autoneum Holding AG, are actively investing in research and development to pioneer advanced materials and manufacturing processes. Geographic expansion is also a key growth driver, with the Asia-Pacific region, particularly China and India, demonstrating substantial demand due to burgeoning automotive production. North America and Europe remain significant markets, with growth rates expected to be steady.
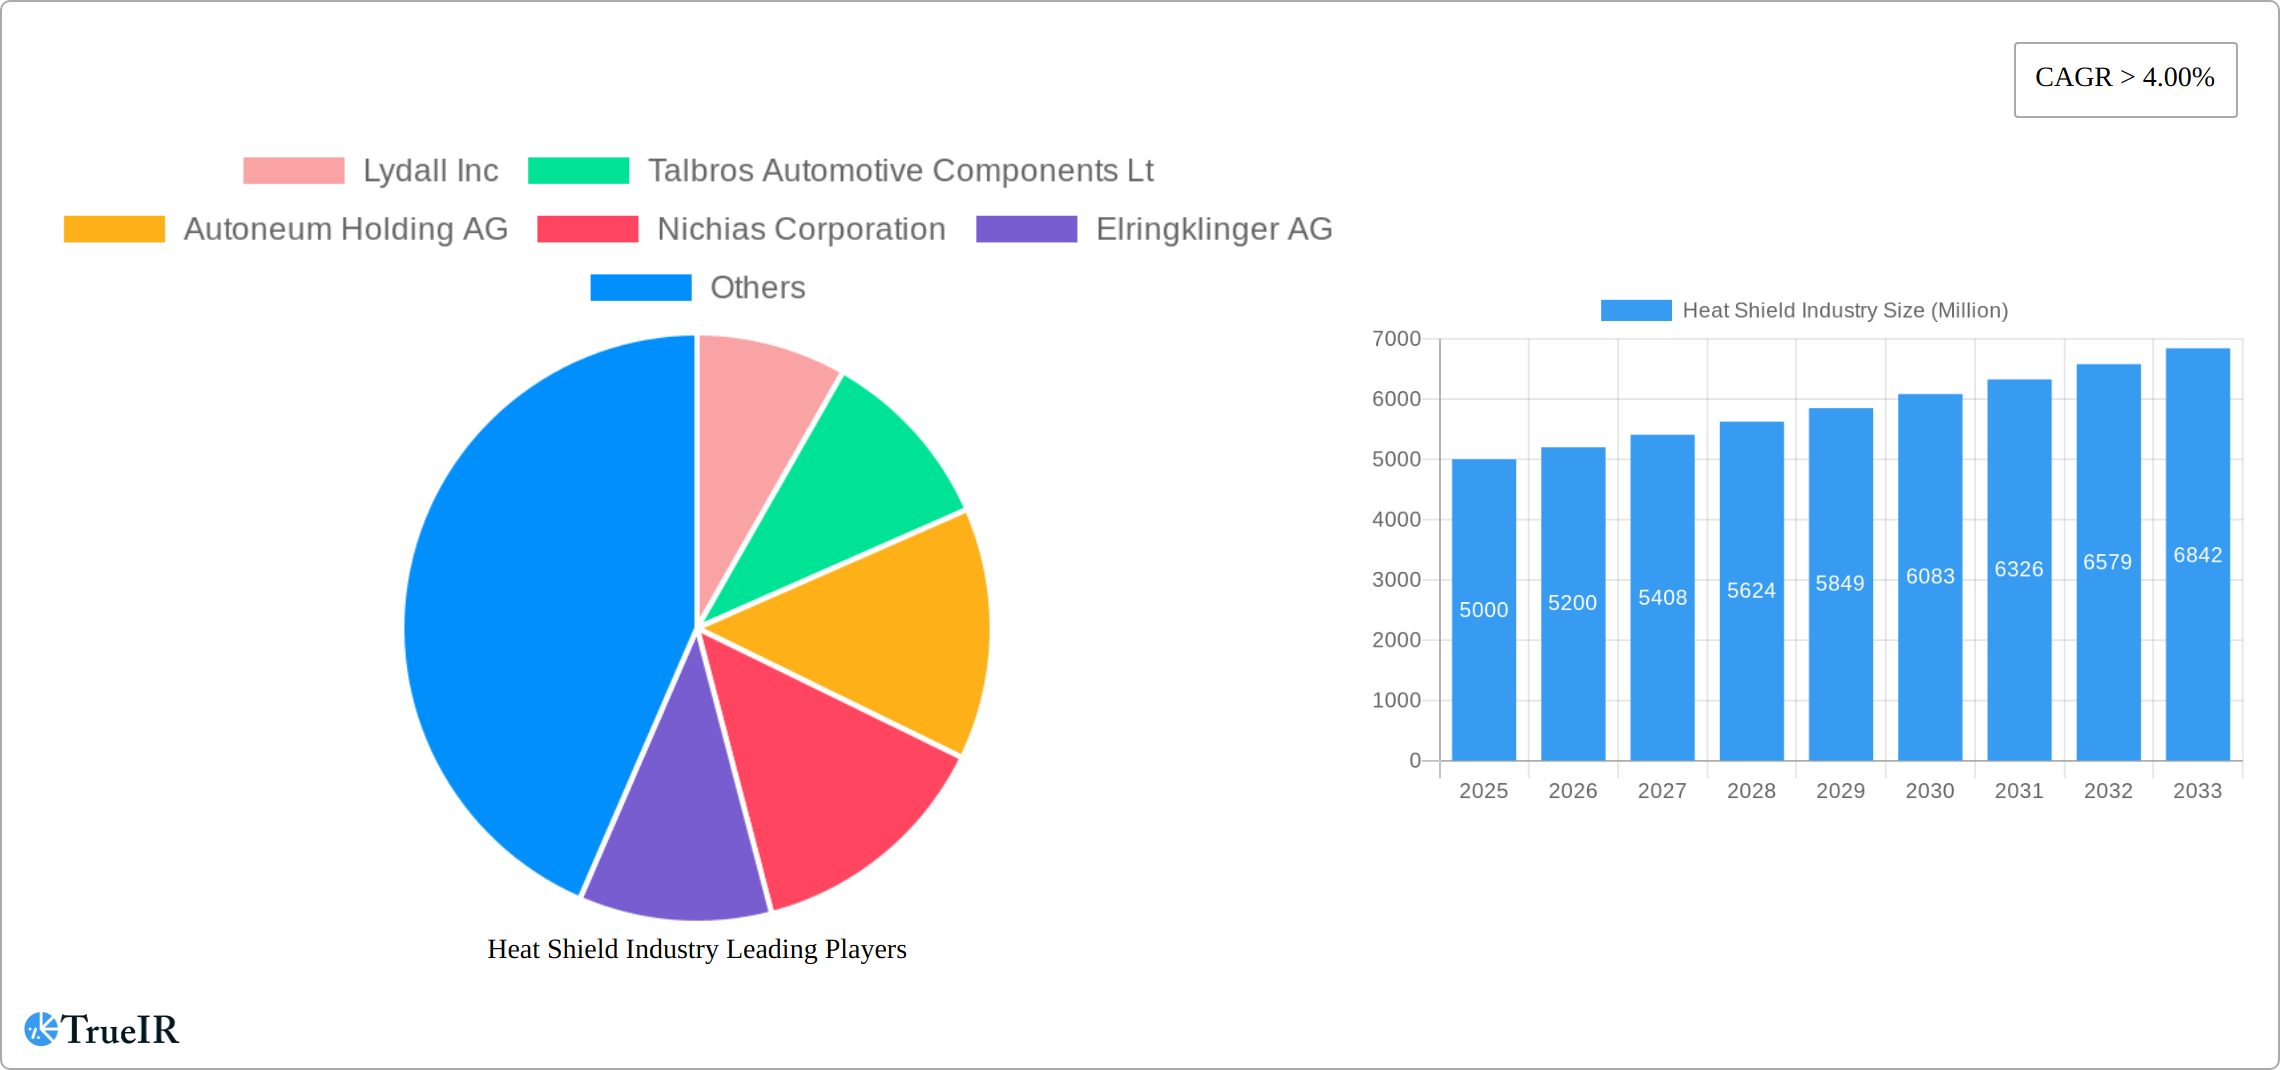
Heat Shield Industry Market Size (In Billion)
The competitive landscape is dynamic, featuring established industry leaders and innovative emerging players. Strategic partnerships, mergers, acquisitions, and technological advancements are central to achieving a competitive advantage. The rising demand for bespoke heat shield solutions, tailored to specific vehicle requirements, is fostering product differentiation. While the growth outlook is positive, potential challenges, such as fluctuating raw material costs and the need to balance cost-effectiveness with performance, may influence market dynamics. The aftermarket segment presents a considerable growth opportunity as vehicle owners increasingly seek to upgrade or replace heat shields for improved performance and longevity. Continuous progress in material science and manufacturing technologies is expected to spur further innovation and market expansion throughout the forecast period.
Heat Shield Industry Company Market Share
Heat Shield Industry Market Report: 2019-2033
This comprehensive report provides a detailed analysis of the global heat shield industry, projecting a market size of USD xx Million by 2033. The study covers the period 2019-2033, with a base year of 2025 and a forecast period of 2025-2033. Key players like Lydall Inc, Talbros Automotive Components Ltd, Autoneum Holding AG, Nichias Corporation, Elringklinger AG, Morgan Advanced Materials, Dana Incorporated, and Federal-Mogul Corporation are analyzed, alongside market segmentation by type, vehicle type, and sales channel. The report offers crucial insights into market trends, growth drivers, challenges, and future opportunities, providing valuable data for strategic decision-making.
Heat Shield Industry Market Structure & Competitive Landscape
The global heat shield market exhibits a moderately concentrated structure, with the top five players holding approximately xx% market share in 2024. Innovation is a key driver, with continuous advancements in materials science and manufacturing techniques leading to lighter, more efficient, and cost-effective heat shields. Stringent emission regulations globally are significantly impacting the industry, pushing for the adoption of more effective thermal management solutions. While alternative materials are emerging, traditional heat shield materials remain dominant due to their performance and cost-effectiveness. End-user segmentation is primarily driven by the automotive industry, with passenger cars currently holding the largest market share, followed by commercial vehicles. M&A activity within the heat shield industry has been moderate over the past five years, with approximately xx deals recorded, primarily focused on expanding product portfolios and geographical reach. The concentration ratio (CR5) is estimated at xx% for 2024, indicating a moderately consolidated market.
- Market Concentration: CR5 approximately xx% in 2024.
- Innovation Drivers: Advancements in materials science, manufacturing processes.
- Regulatory Impacts: Stringent emission regulations driving demand for improved thermal management.
- Product Substitutes: Limited, with traditional materials retaining market dominance.
- End-User Segmentation: Dominated by the automotive sector (passenger cars and commercial vehicles).
- M&A Trends: Moderate activity focused on portfolio expansion and geographic reach.
Heat Shield Industry Market Trends & Opportunities
The global heat shield market is poised for robust expansion, projected to achieve a Compound Annual Growth Rate (CAGR) of [Insert updated CAGR]% during the forecast period (2025-2033). This significant growth trajectory is driven by several key factors. The automotive industry's relentless pursuit of improved fuel efficiency and reduced emissions is a primary catalyst, demanding increasingly sophisticated heat shield technologies. The market penetration of advanced heat shields is expected to climb from [Insert updated 2024 percentage]% in 2024 to [Insert updated 2033 percentage]% by 2033. This upward trend is further fueled by continuous technological advancements, including the development of lighter, more durable, and more efficient materials like ZircoFlex SHIELD, enabling manufacturers to create high-performance heat shields that meet evolving regulatory standards and consumer preferences. The growing consumer demand for vehicles with enhanced fuel economy and reduced environmental impact is a significant market driver, pushing the industry towards innovation and sustainability. The competitive landscape is dynamic, with key players investing substantially in research and development to maintain market share and introduce cutting-edge products. This intense competition fosters innovation and drives the overall market growth. By 2033, the market size is projected to reach USD [Insert updated market size in millions] Million, significantly driven by expanding demand from the automotive and aerospace sectors. The electrification of vehicles presents both challenges and opportunities, demanding new materials and designs optimized for battery thermal management.
Dominant Markets & Segments in Heat Shield Industry
The passenger car segment currently holds the largest share of the heat shield market, closely followed by commercial vehicles. Analyzing by type, engine compartment heat shields dominate, highlighting the critical role of thermal management in this area. OEMs (Original Equipment Manufacturers) constitute the primary sales channel, reflecting the integral nature of heat shields in vehicle manufacturing processes. However, the aftermarket segment is also experiencing growth driven by repair and replacement needs.
- Leading Region/Country: [Insert updated leading region/country with supporting data]
- By Type:
- Engine Compartment: The increasing demand for fuel-efficient and electric vehicles is a major growth driver in this segment. Advanced materials and designs are being developed to optimize thermal management in this critical area.
- Exhaust Compartment: Stringent emission regulations are pushing the development of more effective and durable exhaust heat shields, driving significant growth in this segment.
- Other Types: This segment exhibits moderate growth, driven by niche applications in various industries, including aerospace and industrial equipment.
- By Vehicle Type:
- Passenger Cars: High-volume production and stringent fuel efficiency standards contribute to this segment's significant growth. The trend towards electrification is also impacting material choices and design requirements.
- Commercial Vehicles: The demand for operational efficiency and adherence to regulatory mandates fuel growth in this segment. Focus is on durability and cost-effectiveness.
- By Sales Channel:
- OEMs: This channel maintains its dominance due to the integral role of heat shields in vehicle manufacturing. Close collaboration between OEMs and heat shield suppliers is crucial for innovation and timely product delivery.
- Aftermarket: Growth in this segment is driven by repair and replacement needs, offering opportunities for specialized aftermarket suppliers.
Heat Shield Industry Product Analysis
Recent innovations in heat shield technology focus on reducing weight and improving thermal performance. Materials like ZircoFlex SHIELD demonstrate significant advancements in both areas, offering a competitive advantage. The market is seeing a growing demand for lightweight, high-performance heat shields to meet the stringent requirements of modern vehicles, particularly electric and hybrid vehicles which require effective battery thermal management. The increasing adoption of advanced materials and manufacturing processes is driving product differentiation and enhancing the competitive landscape.
Key Drivers, Barriers & Challenges in Heat Shield Industry
Key Drivers: The ever-increasing demand for fuel-efficient and electric vehicles, coupled with stricter emission regulations worldwide, serves as the primary impetus for market growth. Significant technological advancements in materials science and manufacturing processes are continuously improving heat shield performance and efficiency. Government incentives and policies aimed at promoting eco-friendly vehicles are further bolstering industry expansion. The need for efficient thermal management in electric vehicle batteries is creating a new and rapidly growing market segment.
Challenges: The industry faces several challenges, including supply chain disruptions impacting raw material sourcing, leading to price volatility. Intense competition among both established and emerging players necessitates continuous innovation to maintain a competitive edge. Meeting increasingly stringent regulatory requirements adds complexity and cost pressures. These factors, if not effectively managed, could potentially reduce overall growth by approximately [Insert updated percentage]% in the short term. The need to balance cost-effectiveness with performance is also a significant ongoing challenge.
Growth Drivers in the Heat Shield Industry Market
Technological advancements (lighter, more efficient materials), stricter emission regulations globally, increasing demand for fuel-efficient vehicles, and government incentives for eco-friendly vehicles are key drivers for growth. The rising adoption of electric and hybrid vehicles further boosts demand due to their critical thermal management needs.
Challenges Impacting Heat Shield Industry Growth
Raw material price volatility, supply chain disruptions, intense competition, the need for continuous innovation to meet evolving regulatory standards (particularly concerning sustainable materials and manufacturing processes), and the high capital expenditure required for research and development pose significant ongoing challenges to the industry’s growth trajectory. Adapting to the demands of the rapidly evolving electric vehicle market will require considerable investment and innovation.
Key Players Shaping the Heat Shield Industry Market
- Lydall Inc
- Talbros Automotive Components Ltd
- Autoneum Holding AG
- Nichias Corporation
- Elringklinger AG
- Morgan Advanced Materials
- Dana Incorporated
- Federal-Mogul Corporation
Significant Heat Shield Industry Milestones
- March 2021: Zircotec launched ZircoFlex SHIELD, a heat shield offering improved thermal performance with 40% lower weight and 46% lower volume compared to competitors. This launch signifies a notable advancement in material technology and has impacted the market by offering a superior, more efficient product.
- [Insert Month, Year]: DuPont invested USD 30 million in a new manufacturing facility in China for BETAFORCE and BETATECH thermal interface materials. This investment indicates growing investment in battery thermal management solutions for EVs and HEVs, creating a new market segment for heat shields.
Future Outlook for Heat Shield Industry Market
The heat shield industry is poised for continued growth, driven by the sustained demand for fuel-efficient vehicles and the rising adoption of electric vehicles. Strategic investments in R&D, focusing on lightweight and high-performance materials, will be crucial for companies to maintain a competitive edge. Expansion into new markets and applications, particularly in aerospace and other industrial sectors, presents significant opportunities for future growth. The market is projected to achieve substantial growth, driven by technological innovation and a focus on sustainable solutions.
Heat Shield Industry Segmentation
-
1. Type
- 1.1. Engine Compartment
- 1.2. Exhaust Compartment
- 1.3. Other Types
-
2. Vehicle Type
- 2.1. Passenger Cars
- 2.2. Commercial Vehicles
-
3. Sales Channel
- 3.1. OEMs
- 3.2. Aftermarket
Heat Shield Industry Segmentation By Geography
-
1. North America
- 1.1. United States
- 1.2. Canada
- 1.3. Rest of North America
-
2. Europe
- 2.1. Germany
- 2.2. United Kingdom
- 2.3. France
- 2.4. Spain
- 2.5. Rest of Europe
-
3. Asia Pacific
- 3.1. India
- 3.2. China
- 3.3. Japan
- 3.4. South Korea
- 3.5. Rest of Asia Pacific
-
4. South America
- 4.1. Brazil
- 4.2. Argentina
- 4.3. Rest of South America
- 5. Middle East
-
6. United Arab Emirates
- 6.1. Saudi Arabia
- 6.2. Rest of Middle East
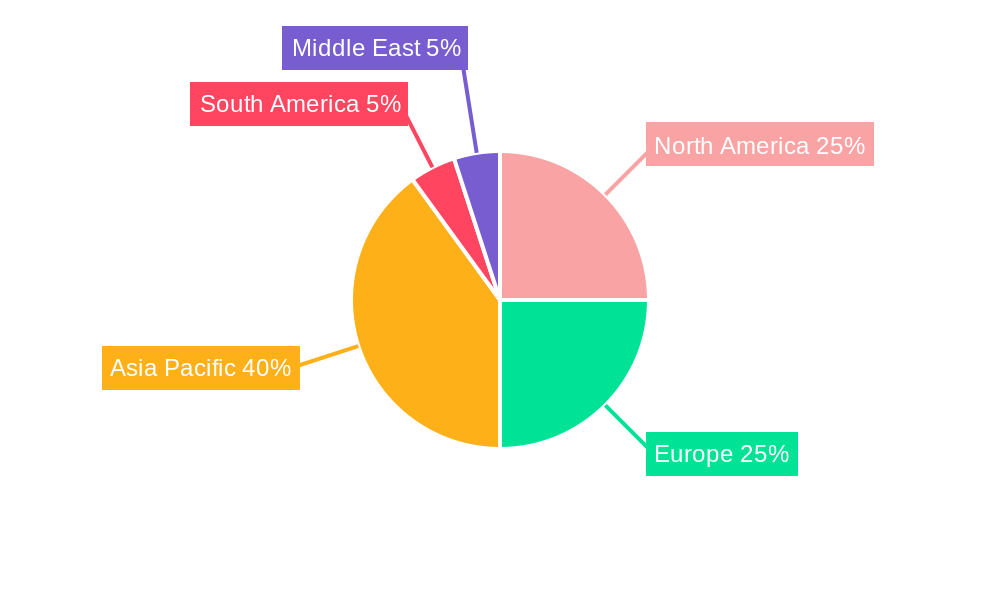
Heat Shield Industry Regional Market Share
Geographic Coverage of Heat Shield Industry
Heat Shield Industry REPORT HIGHLIGHTS
| Aspects | Details |
|---|---|
| Study Period | 2020-2034 |
| Base Year | 2025 |
| Estimated Year | 2026 |
| Forecast Period | 2026-2034 |
| Historical Period | 2020-2025 |
| Growth Rate | CAGR of 5.5% from 2020-2034 |
| Segmentation |
|
Table of Contents
- 1. Introduction
- 1.1. Research Scope
- 1.2. Market Segmentation
- 1.3. Research Objective
- 1.4. Definitions and Assumptions
- 2. Executive Summary
- 2.1. Market Snapshot
- 3. Market Dynamics
- 3.1. Market Drivers
- 3.2. Market Restrains
- 3.3. Market Trends
- 3.4. Market Opportunities
- 4. Market Factor Analysis
- 4.1. Porters Five Forces
- 4.1.1. Bargaining Power of Suppliers
- 4.1.2. Bargaining Power of Buyers
- 4.1.3. Threat of New Entrants
- 4.1.4. Threat of Substitutes
- 4.1.5. Competitive Rivalry
- 4.2. PESTEL analysis
- 4.3. BCG Analysis
- 4.3.1. Stars (High Growth, High Market Share)
- 4.3.2. Cash Cows (Low Growth, High Market Share)
- 4.3.3. Question Mark (High Growth, Low Market Share)
- 4.3.4. Dogs (Low Growth, Low Market Share)
- 4.4. Ansoff Matrix Analysis
- 4.5. Supply Chain Analysis
- 4.6. Regulatory Landscape
- 4.7. Current Market Potential and Opportunity Assessment (TAM–SAM–SOM Framework)
- 4.8. TIR Analyst Note
- 4.1. Porters Five Forces
- 5. Market Analysis, Insights and Forecast 2021-2033
- 5.1. Market Analysis, Insights and Forecast - by Type
- 5.1.1. Engine Compartment
- 5.1.2. Exhaust Compartment
- 5.1.3. Other Types
- 5.2. Market Analysis, Insights and Forecast - by Vehicle Type
- 5.2.1. Passenger Cars
- 5.2.2. Commercial Vehicles
- 5.3. Market Analysis, Insights and Forecast - by Sales Channel
- 5.3.1. OEMs
- 5.3.2. Aftermarket
- 5.4. Market Analysis, Insights and Forecast - by Region
- 5.4.1. North America
- 5.4.2. Europe
- 5.4.3. Asia Pacific
- 5.4.4. South America
- 5.4.5. Middle East
- 5.4.6. United Arab Emirates
- 5.1. Market Analysis, Insights and Forecast - by Type
- 6. Global Heat Shield Industry Analysis, Insights and Forecast, 2021-2033
- 6.1. Market Analysis, Insights and Forecast - by Type
- 6.1.1. Engine Compartment
- 6.1.2. Exhaust Compartment
- 6.1.3. Other Types
- 6.2. Market Analysis, Insights and Forecast - by Vehicle Type
- 6.2.1. Passenger Cars
- 6.2.2. Commercial Vehicles
- 6.3. Market Analysis, Insights and Forecast - by Sales Channel
- 6.3.1. OEMs
- 6.3.2. Aftermarket
- 6.1. Market Analysis, Insights and Forecast - by Type
- 7. North America Heat Shield Industry Analysis, Insights and Forecast, 2020-2032
- 7.1. Market Analysis, Insights and Forecast - by Type
- 7.1.1. Engine Compartment
- 7.1.2. Exhaust Compartment
- 7.1.3. Other Types
- 7.2. Market Analysis, Insights and Forecast - by Vehicle Type
- 7.2.1. Passenger Cars
- 7.2.2. Commercial Vehicles
- 7.3. Market Analysis, Insights and Forecast - by Sales Channel
- 7.3.1. OEMs
- 7.3.2. Aftermarket
- 7.1. Market Analysis, Insights and Forecast - by Type
- 8. Europe Heat Shield Industry Analysis, Insights and Forecast, 2020-2032
- 8.1. Market Analysis, Insights and Forecast - by Type
- 8.1.1. Engine Compartment
- 8.1.2. Exhaust Compartment
- 8.1.3. Other Types
- 8.2. Market Analysis, Insights and Forecast - by Vehicle Type
- 8.2.1. Passenger Cars
- 8.2.2. Commercial Vehicles
- 8.3. Market Analysis, Insights and Forecast - by Sales Channel
- 8.3.1. OEMs
- 8.3.2. Aftermarket
- 8.1. Market Analysis, Insights and Forecast - by Type
- 9. Asia Pacific Heat Shield Industry Analysis, Insights and Forecast, 2020-2032
- 9.1. Market Analysis, Insights and Forecast - by Type
- 9.1.1. Engine Compartment
- 9.1.2. Exhaust Compartment
- 9.1.3. Other Types
- 9.2. Market Analysis, Insights and Forecast - by Vehicle Type
- 9.2.1. Passenger Cars
- 9.2.2. Commercial Vehicles
- 9.3. Market Analysis, Insights and Forecast - by Sales Channel
- 9.3.1. OEMs
- 9.3.2. Aftermarket
- 9.1. Market Analysis, Insights and Forecast - by Type
- 10. South America Heat Shield Industry Analysis, Insights and Forecast, 2020-2032
- 10.1. Market Analysis, Insights and Forecast - by Type
- 10.1.1. Engine Compartment
- 10.1.2. Exhaust Compartment
- 10.1.3. Other Types
- 10.2. Market Analysis, Insights and Forecast - by Vehicle Type
- 10.2.1. Passenger Cars
- 10.2.2. Commercial Vehicles
- 10.3. Market Analysis, Insights and Forecast - by Sales Channel
- 10.3.1. OEMs
- 10.3.2. Aftermarket
- 10.1. Market Analysis, Insights and Forecast - by Type
- 11. Middle East Heat Shield Industry Analysis, Insights and Forecast, 2020-2032
- 11.1. Market Analysis, Insights and Forecast - by Type
- 11.1.1. Engine Compartment
- 11.1.2. Exhaust Compartment
- 11.1.3. Other Types
- 11.2. Market Analysis, Insights and Forecast - by Vehicle Type
- 11.2.1. Passenger Cars
- 11.2.2. Commercial Vehicles
- 11.3. Market Analysis, Insights and Forecast - by Sales Channel
- 11.3.1. OEMs
- 11.3.2. Aftermarket
- 11.1. Market Analysis, Insights and Forecast - by Type
- 12. United Arab Emirates Heat Shield Industry Analysis, Insights and Forecast, 2020-2032
- 12.1. Market Analysis, Insights and Forecast - by Type
- 12.1.1. Engine Compartment
- 12.1.2. Exhaust Compartment
- 12.1.3. Other Types
- 12.2. Market Analysis, Insights and Forecast - by Vehicle Type
- 12.2.1. Passenger Cars
- 12.2.2. Commercial Vehicles
- 12.3. Market Analysis, Insights and Forecast - by Sales Channel
- 12.3.1. OEMs
- 12.3.2. Aftermarket
- 12.1. Market Analysis, Insights and Forecast - by Type
- 13. Competitive Analysis
- 13.1. Company Profiles
- 13.1.1 Lydall Inc
- 13.1.1.1. Company Overview
- 13.1.1.2. Products
- 13.1.1.3. Company Financials
- 13.1.1.4. SWOT Analysis
- 13.1.2 Talbros Automotive Components Lt
- 13.1.2.1. Company Overview
- 13.1.2.2. Products
- 13.1.2.3. Company Financials
- 13.1.2.4. SWOT Analysis
- 13.1.3 Autoneum Holding AG
- 13.1.3.1. Company Overview
- 13.1.3.2. Products
- 13.1.3.3. Company Financials
- 13.1.3.4. SWOT Analysis
- 13.1.4 Nichias Corporation
- 13.1.4.1. Company Overview
- 13.1.4.2. Products
- 13.1.4.3. Company Financials
- 13.1.4.4. SWOT Analysis
- 13.1.5 Elringklinger AG
- 13.1.5.1. Company Overview
- 13.1.5.2. Products
- 13.1.5.3. Company Financials
- 13.1.5.4. SWOT Analysis
- 13.1.6 Morgan Advanced Materials
- 13.1.6.1. Company Overview
- 13.1.6.2. Products
- 13.1.6.3. Company Financials
- 13.1.6.4. SWOT Analysis
- 13.1.7 Dana Incorporated
- 13.1.7.1. Company Overview
- 13.1.7.2. Products
- 13.1.7.3. Company Financials
- 13.1.7.4. SWOT Analysis
- 13.1.8 Federal-Mogul Corporation
- 13.1.8.1. Company Overview
- 13.1.8.2. Products
- 13.1.8.3. Company Financials
- 13.1.8.4. SWOT Analysis
- 13.1.1 Lydall Inc
- 13.2. Market Entropy
- 13.2.1 Company's Key Areas Served
- 13.2.2 Recent Developments
- 13.3. Company Market Share Analysis 2025
- 13.3.1 Top 5 Companies Market Share Analysis
- 13.3.2 Top 3 Companies Market Share Analysis
- 13.4. List of Potential Customers
- 14. Research Methodology
List of Figures
- Figure 1: Global Heat Shield Industry Revenue Breakdown (billion, %) by Region 2025 & 2033
- Figure 2: North America Heat Shield Industry Revenue (billion), by Type 2025 & 2033
- Figure 3: North America Heat Shield Industry Revenue Share (%), by Type 2025 & 2033
- Figure 4: North America Heat Shield Industry Revenue (billion), by Vehicle Type 2025 & 2033
- Figure 5: North America Heat Shield Industry Revenue Share (%), by Vehicle Type 2025 & 2033
- Figure 6: North America Heat Shield Industry Revenue (billion), by Sales Channel 2025 & 2033
- Figure 7: North America Heat Shield Industry Revenue Share (%), by Sales Channel 2025 & 2033
- Figure 8: North America Heat Shield Industry Revenue (billion), by Country 2025 & 2033
- Figure 9: North America Heat Shield Industry Revenue Share (%), by Country 2025 & 2033
- Figure 10: Europe Heat Shield Industry Revenue (billion), by Type 2025 & 2033
- Figure 11: Europe Heat Shield Industry Revenue Share (%), by Type 2025 & 2033
- Figure 12: Europe Heat Shield Industry Revenue (billion), by Vehicle Type 2025 & 2033
- Figure 13: Europe Heat Shield Industry Revenue Share (%), by Vehicle Type 2025 & 2033
- Figure 14: Europe Heat Shield Industry Revenue (billion), by Sales Channel 2025 & 2033
- Figure 15: Europe Heat Shield Industry Revenue Share (%), by Sales Channel 2025 & 2033
- Figure 16: Europe Heat Shield Industry Revenue (billion), by Country 2025 & 2033
- Figure 17: Europe Heat Shield Industry Revenue Share (%), by Country 2025 & 2033
- Figure 18: Asia Pacific Heat Shield Industry Revenue (billion), by Type 2025 & 2033
- Figure 19: Asia Pacific Heat Shield Industry Revenue Share (%), by Type 2025 & 2033
- Figure 20: Asia Pacific Heat Shield Industry Revenue (billion), by Vehicle Type 2025 & 2033
- Figure 21: Asia Pacific Heat Shield Industry Revenue Share (%), by Vehicle Type 2025 & 2033
- Figure 22: Asia Pacific Heat Shield Industry Revenue (billion), by Sales Channel 2025 & 2033
- Figure 23: Asia Pacific Heat Shield Industry Revenue Share (%), by Sales Channel 2025 & 2033
- Figure 24: Asia Pacific Heat Shield Industry Revenue (billion), by Country 2025 & 2033
- Figure 25: Asia Pacific Heat Shield Industry Revenue Share (%), by Country 2025 & 2033
- Figure 26: South America Heat Shield Industry Revenue (billion), by Type 2025 & 2033
- Figure 27: South America Heat Shield Industry Revenue Share (%), by Type 2025 & 2033
- Figure 28: South America Heat Shield Industry Revenue (billion), by Vehicle Type 2025 & 2033
- Figure 29: South America Heat Shield Industry Revenue Share (%), by Vehicle Type 2025 & 2033
- Figure 30: South America Heat Shield Industry Revenue (billion), by Sales Channel 2025 & 2033
- Figure 31: South America Heat Shield Industry Revenue Share (%), by Sales Channel 2025 & 2033
- Figure 32: South America Heat Shield Industry Revenue (billion), by Country 2025 & 2033
- Figure 33: South America Heat Shield Industry Revenue Share (%), by Country 2025 & 2033
- Figure 34: Middle East Heat Shield Industry Revenue (billion), by Type 2025 & 2033
- Figure 35: Middle East Heat Shield Industry Revenue Share (%), by Type 2025 & 2033
- Figure 36: Middle East Heat Shield Industry Revenue (billion), by Vehicle Type 2025 & 2033
- Figure 37: Middle East Heat Shield Industry Revenue Share (%), by Vehicle Type 2025 & 2033
- Figure 38: Middle East Heat Shield Industry Revenue (billion), by Sales Channel 2025 & 2033
- Figure 39: Middle East Heat Shield Industry Revenue Share (%), by Sales Channel 2025 & 2033
- Figure 40: Middle East Heat Shield Industry Revenue (billion), by Country 2025 & 2033
- Figure 41: Middle East Heat Shield Industry Revenue Share (%), by Country 2025 & 2033
- Figure 42: United Arab Emirates Heat Shield Industry Revenue (billion), by Type 2025 & 2033
- Figure 43: United Arab Emirates Heat Shield Industry Revenue Share (%), by Type 2025 & 2033
- Figure 44: United Arab Emirates Heat Shield Industry Revenue (billion), by Vehicle Type 2025 & 2033
- Figure 45: United Arab Emirates Heat Shield Industry Revenue Share (%), by Vehicle Type 2025 & 2033
- Figure 46: United Arab Emirates Heat Shield Industry Revenue (billion), by Sales Channel 2025 & 2033
- Figure 47: United Arab Emirates Heat Shield Industry Revenue Share (%), by Sales Channel 2025 & 2033
- Figure 48: United Arab Emirates Heat Shield Industry Revenue (billion), by Country 2025 & 2033
- Figure 49: United Arab Emirates Heat Shield Industry Revenue Share (%), by Country 2025 & 2033
List of Tables
- Table 1: Global Heat Shield Industry Revenue billion Forecast, by Type 2020 & 2033
- Table 2: Global Heat Shield Industry Revenue billion Forecast, by Vehicle Type 2020 & 2033
- Table 3: Global Heat Shield Industry Revenue billion Forecast, by Sales Channel 2020 & 2033
- Table 4: Global Heat Shield Industry Revenue billion Forecast, by Region 2020 & 2033
- Table 5: Global Heat Shield Industry Revenue billion Forecast, by Type 2020 & 2033
- Table 6: Global Heat Shield Industry Revenue billion Forecast, by Vehicle Type 2020 & 2033
- Table 7: Global Heat Shield Industry Revenue billion Forecast, by Sales Channel 2020 & 2033
- Table 8: Global Heat Shield Industry Revenue billion Forecast, by Country 2020 & 2033
- Table 9: United States Heat Shield Industry Revenue (billion) Forecast, by Application 2020 & 2033
- Table 10: Canada Heat Shield Industry Revenue (billion) Forecast, by Application 2020 & 2033
- Table 11: Rest of North America Heat Shield Industry Revenue (billion) Forecast, by Application 2020 & 2033
- Table 12: Global Heat Shield Industry Revenue billion Forecast, by Type 2020 & 2033
- Table 13: Global Heat Shield Industry Revenue billion Forecast, by Vehicle Type 2020 & 2033
- Table 14: Global Heat Shield Industry Revenue billion Forecast, by Sales Channel 2020 & 2033
- Table 15: Global Heat Shield Industry Revenue billion Forecast, by Country 2020 & 2033
- Table 16: Germany Heat Shield Industry Revenue (billion) Forecast, by Application 2020 & 2033
- Table 17: United Kingdom Heat Shield Industry Revenue (billion) Forecast, by Application 2020 & 2033
- Table 18: France Heat Shield Industry Revenue (billion) Forecast, by Application 2020 & 2033
- Table 19: Spain Heat Shield Industry Revenue (billion) Forecast, by Application 2020 & 2033
- Table 20: Rest of Europe Heat Shield Industry Revenue (billion) Forecast, by Application 2020 & 2033
- Table 21: Global Heat Shield Industry Revenue billion Forecast, by Type 2020 & 2033
- Table 22: Global Heat Shield Industry Revenue billion Forecast, by Vehicle Type 2020 & 2033
- Table 23: Global Heat Shield Industry Revenue billion Forecast, by Sales Channel 2020 & 2033
- Table 24: Global Heat Shield Industry Revenue billion Forecast, by Country 2020 & 2033
- Table 25: India Heat Shield Industry Revenue (billion) Forecast, by Application 2020 & 2033
- Table 26: China Heat Shield Industry Revenue (billion) Forecast, by Application 2020 & 2033
- Table 27: Japan Heat Shield Industry Revenue (billion) Forecast, by Application 2020 & 2033
- Table 28: South Korea Heat Shield Industry Revenue (billion) Forecast, by Application 2020 & 2033
- Table 29: Rest of Asia Pacific Heat Shield Industry Revenue (billion) Forecast, by Application 2020 & 2033
- Table 30: Global Heat Shield Industry Revenue billion Forecast, by Type 2020 & 2033
- Table 31: Global Heat Shield Industry Revenue billion Forecast, by Vehicle Type 2020 & 2033
- Table 32: Global Heat Shield Industry Revenue billion Forecast, by Sales Channel 2020 & 2033
- Table 33: Global Heat Shield Industry Revenue billion Forecast, by Country 2020 & 2033
- Table 34: Brazil Heat Shield Industry Revenue (billion) Forecast, by Application 2020 & 2033
- Table 35: Argentina Heat Shield Industry Revenue (billion) Forecast, by Application 2020 & 2033
- Table 36: Rest of South America Heat Shield Industry Revenue (billion) Forecast, by Application 2020 & 2033
- Table 37: Global Heat Shield Industry Revenue billion Forecast, by Type 2020 & 2033
- Table 38: Global Heat Shield Industry Revenue billion Forecast, by Vehicle Type 2020 & 2033
- Table 39: Global Heat Shield Industry Revenue billion Forecast, by Sales Channel 2020 & 2033
- Table 40: Global Heat Shield Industry Revenue billion Forecast, by Country 2020 & 2033
- Table 41: Global Heat Shield Industry Revenue billion Forecast, by Type 2020 & 2033
- Table 42: Global Heat Shield Industry Revenue billion Forecast, by Vehicle Type 2020 & 2033
- Table 43: Global Heat Shield Industry Revenue billion Forecast, by Sales Channel 2020 & 2033
- Table 44: Global Heat Shield Industry Revenue billion Forecast, by Country 2020 & 2033
- Table 45: Saudi Arabia Heat Shield Industry Revenue (billion) Forecast, by Application 2020 & 2033
- Table 46: Rest of Middle East Heat Shield Industry Revenue (billion) Forecast, by Application 2020 & 2033
Frequently Asked Questions
1. What is the projected Compound Annual Growth Rate (CAGR) of the Heat Shield Industry?
The projected CAGR is approximately 5.5%.
2. Which companies are prominent players in the Heat Shield Industry?
Key companies in the market include Lydall Inc, Talbros Automotive Components Lt, Autoneum Holding AG, Nichias Corporation, Elringklinger AG, Morgan Advanced Materials, Dana Incorporated, Federal-Mogul Corporation.
3. What are the main segments of the Heat Shield Industry?
The market segments include Type, Vehicle Type, Sales Channel.
4. Can you provide details about the market size?
The market size is estimated to be USD 5.18 billion as of 2022.
5. What are some drivers contributing to market growth?
Rising Demand for Small Boats; Expanding Recreational Boating Opportunities.
6. What are the notable trends driving market growth?
High Cost of Heat Shield in Aftermarket and Increasing Electric Vehicle Sales Restraining the Market Growth.
7. Are there any restraints impacting market growth?
Strict Emission Norms for Recreation Boats Likely to Have Negative Impact.
8. Can you provide examples of recent developments in the market?
In March 2021, Zircotec launched ZircoFlex SHIELD. ZircoFlex SHIELD reportedly achieves better thermal performance at 40% lower weight and 46% lower volume than competing heat-shield products.
9. What pricing options are available for accessing the report?
Pricing options include single-user, multi-user, and enterprise licenses priced at USD 4750, USD 5250, and USD 8750 respectively.
10. Is the market size provided in terms of value or volume?
The market size is provided in terms of value, measured in billion.
11. Are there any specific market keywords associated with the report?
Yes, the market keyword associated with the report is "Heat Shield Industry," which aids in identifying and referencing the specific market segment covered.
12. How do I determine which pricing option suits my needs best?
The pricing options vary based on user requirements and access needs. Individual users may opt for single-user licenses, while businesses requiring broader access may choose multi-user or enterprise licenses for cost-effective access to the report.
13. Are there any additional resources or data provided in the Heat Shield Industry report?
While the report offers comprehensive insights, it's advisable to review the specific contents or supplementary materials provided to ascertain if additional resources or data are available.
14. How can I stay updated on further developments or reports in the Heat Shield Industry?
To stay informed about further developments, trends, and reports in the Heat Shield Industry, consider subscribing to industry newsletters, following relevant companies and organizations, or regularly checking reputable industry news sources and publications.
Methodology
Step 1 - Identification of Relevant Samples Size from Population Database


Step 2 - Approaches for Defining Global Market Size (Value, Volume* & Price*)

Note*: In applicable scenarios
Step 3 - Data Sources
Primary Research
- Web Analytics
- Survey Reports
- Research Institute
- Latest Research Reports
- Opinion Leaders
Secondary Research
- Annual Reports
- White Paper
- Latest Press Release
- Industry Association
- Paid Database
- Investor Presentations

Step 4 - Data Triangulation
Involves using different sources of information in order to increase the validity of a study
These sources are likely to be stakeholders in a program - participants, other researchers, program staff, other community members, and so on.
Then we put all data in single framework & apply various statistical tools to find out the dynamic on the market.
During the analysis stage, feedback from the stakeholder groups would be compared to determine areas of agreement as well as areas of divergence