

Key Insights
The in-taxi digital signage market is experiencing steady growth, driven by increasing passenger numbers, advancements in display technology (LCD and LED), and the rising popularity of targeted advertising. The market's segmentation by vehicle type (luxury/premium and economy/budget taxis) reflects varying advertising potential and pricing strategies. Luxury taxis, with their higher-spending clientele, command premium ad rates, while economy taxis offer broader reach and cost-effectiveness for advertisers. The adoption of LED displays is a key trend, offering superior image quality and energy efficiency compared to LCDs. Software providers play a crucial role, offering sophisticated content management systems and targeted advertising platforms. Leading companies like 42Gears Mobility Systems, Curb Mobility, and others are instrumental in developing and implementing the technology and advertising strategies. Geographic expansion, especially in rapidly urbanizing regions of Asia Pacific, is expected to further fuel market growth. However, challenges remain, including concerns regarding passenger privacy, regulatory hurdles in certain markets, and the need for consistent and high-quality content to maintain advertiser interest. The forecast period (2025-2033) anticipates continued expansion, driven by technological innovation and the increasing integration of in-taxi advertising into broader mobility marketing strategies. The market's CAGR of 3.00% suggests a sustainable and predictable growth trajectory.
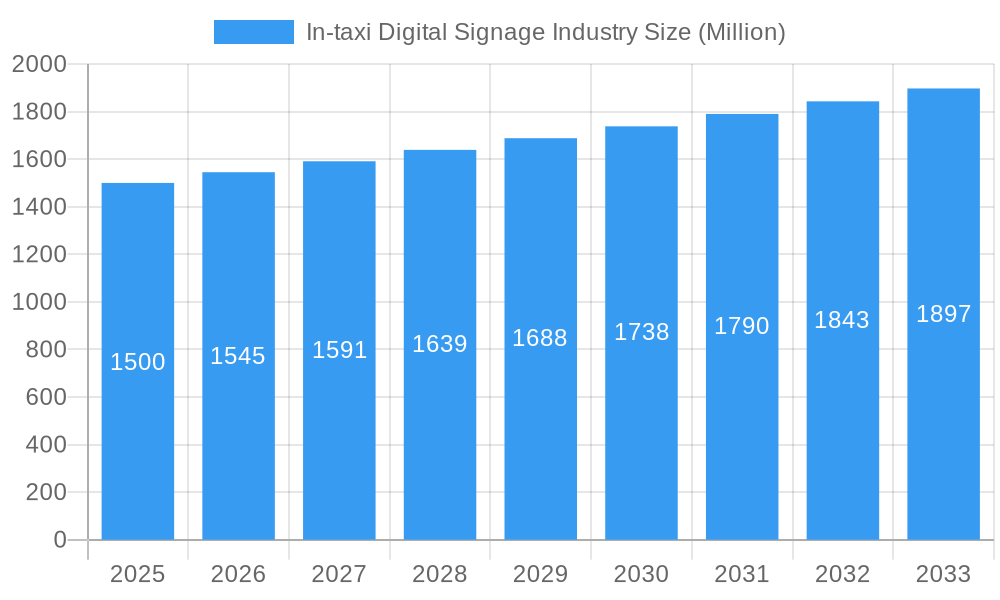
In-taxi Digital Signage Industry Market Size (In Billion)
The competitive landscape is dynamic, with a mix of established players and emerging technology companies. The presence of established tech companies like Apple and Samsung, alongside advertising specialists and mobility service providers, indicates diverse technological capabilities and strategic partnerships driving innovation within the sector. The integration of in-taxi digital signage with mobile payment systems and other in-vehicle technologies presents significant opportunities for enhanced advertising personalization and effectiveness. Future growth will depend on successfully addressing passenger concerns, adapting to evolving technological advancements, and navigating regulatory landscapes to ensure sustainable market development. The current market size estimation, while not explicitly provided, can be reasonably extrapolated based on the CAGR and available data points to form a plausible forecast for future market valuation.
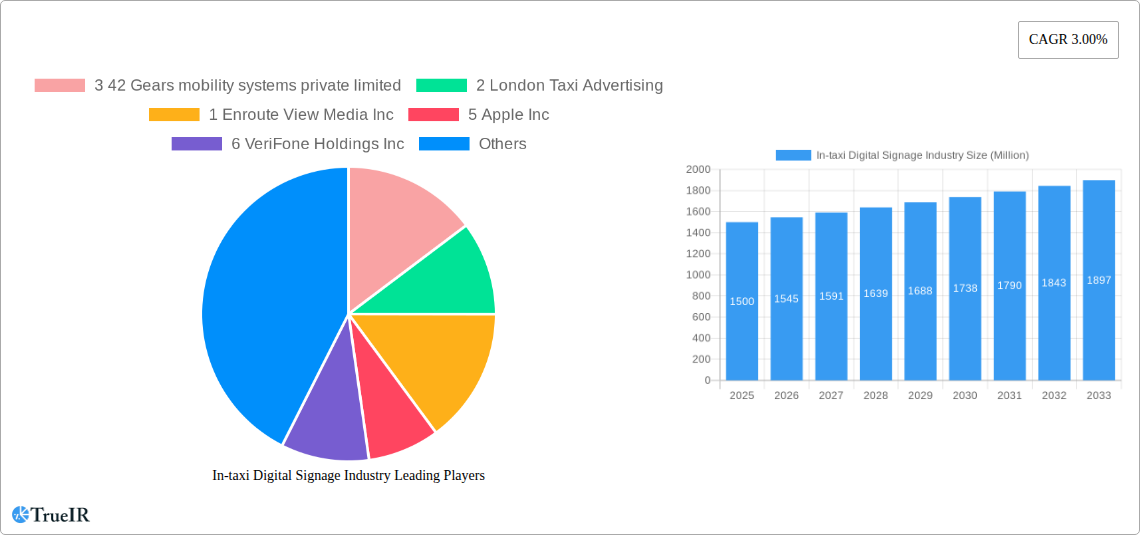
In-taxi Digital Signage Industry Company Market Share
In-Taxi Digital Signage Industry Market Report: 2019-2033
This comprehensive report provides an in-depth analysis of the In-taxi Digital Signage industry, projecting a market value exceeding $XX Million by 2033. The study covers the period from 2019 to 2033, with 2025 as the base and estimated year. This report is essential for investors, industry players, and strategists seeking a granular understanding of this dynamic market.
In-taxi Digital Signage Industry Market Structure & Competitive Landscape
The In-taxi Digital Signage market exhibits a moderately fragmented structure, with a Herfindahl-Hirschman Index (HHI) of approximately xx, indicating a blend of established players and emerging companies. Key drivers of innovation include advancements in display technology (e.g., higher resolution screens, interactive capabilities), the integration of mobile advertising platforms, and the increasing adoption of data analytics for targeted advertising. Regulatory frameworks, particularly concerning data privacy and passenger safety, significantly influence market dynamics. Product substitutes, such as traditional in-taxi advertising (e.g., printed materials) and competing digital platforms (e.g., streaming services), exert competitive pressure. End-user segmentation is largely driven by taxi type (luxury vs. budget) and geographic location.
M&A activity in the period 2019-2024 totaled approximately $XX Million, with a noticeable increase in consolidation among smaller advertising service providers. The top 5 players currently hold an estimated xx% market share.
- Concentration Ratio (CR4): xx%
- M&A Volume (2019-2024): $XX Million
- Key Players: 42Gears Mobility Systems Pvt Ltd, London Taxi Advertising, Enroute View Media Inc, Apple Inc, Verifone Holdings Inc, Samsung Electronics Co Ltd, Clear Vision Advertisement, Blue Line Media, Swipe Technologies, Curb Mobility LLC, Cabby Tabby Technologies, BillboardsIn, Bona Phandle Media
In-taxi Digital Signage Industry Market Trends & Opportunities
The In-taxi Digital Signage market is experiencing robust growth, with a projected Compound Annual Growth Rate (CAGR) of xx% during the forecast period (2025-2033). Market penetration is rising steadily, driven by increasing smartphone adoption among passengers and improved data analytics capabilities that enable more effective targeted advertising. Technological advancements, such as the introduction of higher-resolution displays and interactive advertising formats, enhance the passenger experience and increase advertiser engagement. Consumer preference trends reveal a growing demand for personalized and engaging advertising experiences within the taxi environment. This preference is pushing businesses to adopt more dynamic and interactive ad displays. The shift towards connected vehicles and the integration of in-taxi Wi-Fi are expanding opportunities for digital signage adoption. The competitive landscape involves a dynamic mix of established advertising companies, technology providers, and emerging startups, leading to continuous innovation.
Dominant Markets & Segments in In-taxi Digital Signage Industry
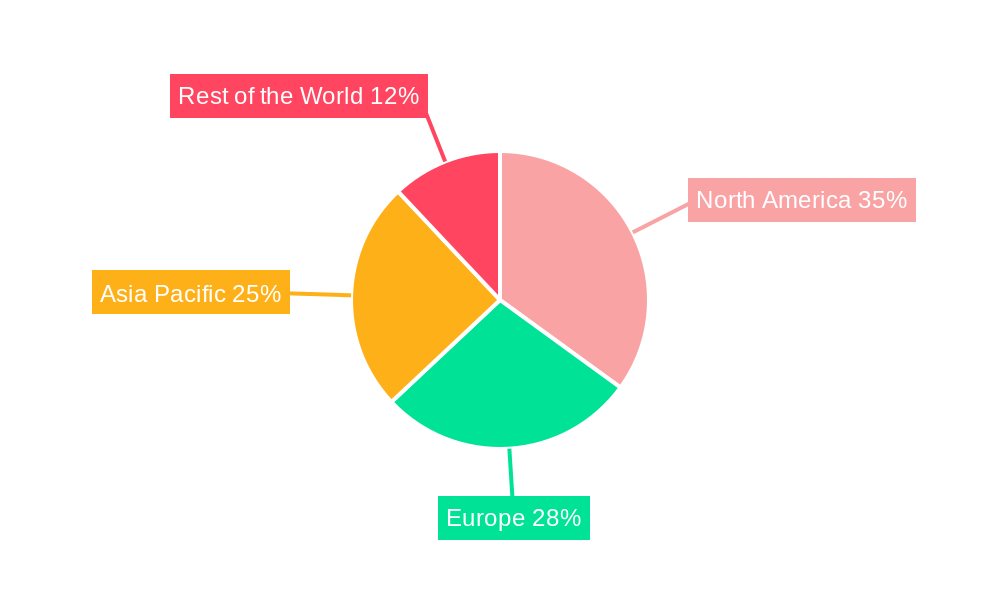
The North American region currently dominates the In-taxi Digital Signage market, accounting for approximately xx% of global revenue in 2024. However, strong growth is expected in Asia-Pacific markets due to increasing urbanization and rising taxi ridership.
Key Growth Drivers:
- Vehicle Type: Luxury/premium taxis show higher adoption rates due to the premium advertising space, while economy/budget taxis present a larger volume opportunity.
- Display Type: LCD displays currently hold the largest market share, but LED displays are gaining traction due to their energy efficiency and superior image quality.
Market Dominance Analysis: The dominance of North America is attributed to high advertising spending, advanced technological infrastructure, and a well-established taxi industry. The Asia-Pacific region's potential stems from rapid economic growth, increasing urbanization, and a large and expanding taxi market.
- Leading Region: North America (xx% market share in 2024)
- Fastest-Growing Region: Asia-Pacific (Projected CAGR of xx% during 2025-2033)
- Dominant Vehicle Type: Economy/Budget Taxis (due to sheer volume)
- Dominant Display Type: LCD (Currently holds the largest market share due to cost-effectiveness)
In-taxi Digital Signage Industry Product Analysis
Product innovation focuses on enhancing passenger engagement and advertising effectiveness. This includes the development of interactive displays, personalized content delivery, and data analytics integration to optimize advertising campaigns. Key competitive advantages lie in the ability to deliver targeted, high-impact advertisements, combined with innovative display technology and data-driven insights. The market demonstrates a strong fit for companies offering integrated hardware and software solutions.
Key Drivers, Barriers & Challenges in In-taxi Digital Signage Industry
Key Drivers:
- Rising Smartphone Penetration: Increased passenger engagement with mobile devices creates opportunities for interactive advertisements.
- Data Analytics Advancements: Enables precise targeting and improved ROI for advertisers.
- Technological Advancements in Display Technology: Enhanced passenger experience, improved visual appeal of advertisements.
Key Challenges:
- High Initial Investment Costs: The cost of implementing and maintaining in-taxi digital signage systems can be a significant barrier for smaller operators.
- Regulatory Hurdles: Data privacy regulations and advertising standards vary across different jurisdictions, which requires meticulous compliance procedures.
- Supply Chain Disruptions: Global supply chain challenges have impacted the availability and pricing of components. This has led to an estimated xx% increase in hardware costs in the past year.
Growth Drivers in the In-taxi Digital Signage Industry Market
The market's growth is fuelled by technological advancements, increasing urbanization, rising disposable incomes, and supportive government policies. These factors collectively contribute to a greater adoption of in-taxi digital signage by taxi operators and advertising agencies. Specifically, the development of more interactive and engaging display technologies is a significant growth catalyst.
Challenges Impacting In-taxi Digital Signage Industry Growth
Significant challenges include the high initial investment costs for taxi operators, stringent regulatory compliance requirements, and the need to address passenger privacy concerns. These factors can slow down market adoption, especially among smaller taxi operators. Furthermore, supply chain disruptions can lead to cost increases and potentially delay deployment plans.
Key Players Shaping the In-taxi Digital Signage Industry Market
- 42Gears Mobility Systems Pvt Ltd (3)
- London Taxi Advertising (2)
- Enroute View Media Inc (1)
- Apple Inc (5)
- VeriFone Holdings Inc (6)
- Samsung Electronics Co Ltd (4)
- Clear Vision Advertisement (1)
- Blue Line Media (4)
- Swipe Technologies (3)
- Curb Mobility LLC (4)
- Cabby Tabby Technologies (5)
- BillboardsIn (6)
- Bona Phandle Media
Significant In-taxi Digital Signage Industry Industry Milestones
- 2020: Introduction of 5G enabled screens in New York City taxis.
- 2021: London Taxi Advertising acquires smaller competitor, expanding market share.
- 2022: Significant investment in R&D for interactive displays.
- 2023: Launch of several new platforms focused on data-driven advertising campaigns.
- 2024: Increased regulatory scrutiny related to data privacy
Future Outlook for In-taxi Digital Signage Industry Market
The In-taxi Digital Signage market is poised for continued expansion driven by technological innovation, the growing adoption of connected vehicles, and the increasing use of data analytics in advertising. Strategic opportunities lie in developing more interactive and personalized advertising experiences, leveraging advancements in artificial intelligence (AI) and augmented reality (AR), and exploring new partnerships to expand reach and service offerings. The market's future is bright, promising significant growth and potential for disruption.
In-taxi Digital Signage Industry Segmentation
-
1. Vehicle Type
- 1.1. Luxury/Premium Taxi
- 1.2. Economy/Budget Taxi
-
2. Display Type
- 2.1. LCD
- 2.2. LED
In-taxi Digital Signage Industry Segmentation By Geography
-
1. North America
- 1.1. United States
- 1.2. Canada
- 1.3. Rest of North America
-
2. Europe
- 2.1. United Kingdom
- 2.2. Germany
- 2.3. France
- 2.4. Spain
- 2.5. Rest of Europe
-
3. Asia Pacific
- 3.1. China
- 3.2. Japan
- 3.3. India
- 3.4. Rest of Asia Pacific
-
4. Rest of the World
- 4.1. Saudi Arabia
- 4.2. Brazil
- 4.3. Other Countries
In-taxi Digital Signage Industry Regional Market Share
Geographic Coverage of In-taxi Digital Signage Industry
In-taxi Digital Signage Industry REPORT HIGHLIGHTS
| Aspects | Details |
|---|---|
| Study Period | 2020-2034 |
| Base Year | 2025 |
| Estimated Year | 2026 |
| Forecast Period | 2026-2034 |
| Historical Period | 2020-2025 |
| Growth Rate | CAGR of 4.5% from 2020-2034 |
| Segmentation |
|
Table of Contents
- 1. Introduction
- 1.1. Research Scope
- 1.2. Market Segmentation
- 1.3. Research Objective
- 1.4. Definitions and Assumptions
- 2. Executive Summary
- 2.1. Market Snapshot
- 3. Market Dynamics
- 3.1. Market Drivers
- 3.2. Market Restrains
- 3.3. Market Trends
- 3.4. Market Opportunities
- 4. Market Factor Analysis
- 4.1. Porters Five Forces
- 4.1.1. Bargaining Power of Suppliers
- 4.1.2. Bargaining Power of Buyers
- 4.1.3. Threat of New Entrants
- 4.1.4. Threat of Substitutes
- 4.1.5. Competitive Rivalry
- 4.2. PESTEL analysis
- 4.3. BCG Analysis
- 4.3.1. Stars (High Growth, High Market Share)
- 4.3.2. Cash Cows (Low Growth, High Market Share)
- 4.3.3. Question Mark (High Growth, Low Market Share)
- 4.3.4. Dogs (Low Growth, Low Market Share)
- 4.4. Ansoff Matrix Analysis
- 4.5. Supply Chain Analysis
- 4.6. Regulatory Landscape
- 4.7. Current Market Potential and Opportunity Assessment (TAM–SAM–SOM Framework)
- 4.8. TIR Analyst Note
- 4.1. Porters Five Forces
- 5. Market Analysis, Insights and Forecast 2021-2033
- 5.1. Market Analysis, Insights and Forecast - by Vehicle Type
- 5.1.1. Luxury/Premium Taxi
- 5.1.2. Economy/Budget Taxi
- 5.2. Market Analysis, Insights and Forecast - by Display Type
- 5.2.1. LCD
- 5.2.2. LED
- 5.3. Market Analysis, Insights and Forecast - by Region
- 5.3.1. North America
- 5.3.2. Europe
- 5.3.3. Asia Pacific
- 5.3.4. Rest of the World
- 5.1. Market Analysis, Insights and Forecast - by Vehicle Type
- 6. Global In-taxi Digital Signage Industry Analysis, Insights and Forecast, 2021-2033
- 6.1. Market Analysis, Insights and Forecast - by Vehicle Type
- 6.1.1. Luxury/Premium Taxi
- 6.1.2. Economy/Budget Taxi
- 6.2. Market Analysis, Insights and Forecast - by Display Type
- 6.2.1. LCD
- 6.2.2. LED
- 6.1. Market Analysis, Insights and Forecast - by Vehicle Type
- 7. North America In-taxi Digital Signage Industry Analysis, Insights and Forecast, 2020-2032
- 7.1. Market Analysis, Insights and Forecast - by Vehicle Type
- 7.1.1. Luxury/Premium Taxi
- 7.1.2. Economy/Budget Taxi
- 7.2. Market Analysis, Insights and Forecast - by Display Type
- 7.2.1. LCD
- 7.2.2. LED
- 7.1. Market Analysis, Insights and Forecast - by Vehicle Type
- 8. Europe In-taxi Digital Signage Industry Analysis, Insights and Forecast, 2020-2032
- 8.1. Market Analysis, Insights and Forecast - by Vehicle Type
- 8.1.1. Luxury/Premium Taxi
- 8.1.2. Economy/Budget Taxi
- 8.2. Market Analysis, Insights and Forecast - by Display Type
- 8.2.1. LCD
- 8.2.2. LED
- 8.1. Market Analysis, Insights and Forecast - by Vehicle Type
- 9. Asia Pacific In-taxi Digital Signage Industry Analysis, Insights and Forecast, 2020-2032
- 9.1. Market Analysis, Insights and Forecast - by Vehicle Type
- 9.1.1. Luxury/Premium Taxi
- 9.1.2. Economy/Budget Taxi
- 9.2. Market Analysis, Insights and Forecast - by Display Type
- 9.2.1. LCD
- 9.2.2. LED
- 9.1. Market Analysis, Insights and Forecast - by Vehicle Type
- 10. Rest of the World In-taxi Digital Signage Industry Analysis, Insights and Forecast, 2020-2032
- 10.1. Market Analysis, Insights and Forecast - by Vehicle Type
- 10.1.1. Luxury/Premium Taxi
- 10.1.2. Economy/Budget Taxi
- 10.2. Market Analysis, Insights and Forecast - by Display Type
- 10.2.1. LCD
- 10.2.2. LED
- 10.1. Market Analysis, Insights and Forecast - by Vehicle Type
- 11. Competitive Analysis
- 11.1. Company Profiles
- 11.1.1 3 42 Gears mobility systems private limited
- 11.1.1.1. Company Overview
- 11.1.1.2. Products
- 11.1.1.3. Company Financials
- 11.1.1.4. SWOT Analysis
- 11.1.2 2 London Taxi Advertising
- 11.1.2.1. Company Overview
- 11.1.2.2. Products
- 11.1.2.3. Company Financials
- 11.1.2.4. SWOT Analysis
- 11.1.3 1 Enroute View Media Inc
- 11.1.3.1. Company Overview
- 11.1.3.2. Products
- 11.1.3.3. Company Financials
- 11.1.3.4. SWOT Analysis
- 11.1.4 5 Apple Inc
- 11.1.4.1. Company Overview
- 11.1.4.2. Products
- 11.1.4.3. Company Financials
- 11.1.4.4. SWOT Analysis
- 11.1.5 6 VeriFone Holdings Inc
- 11.1.5.1. Company Overview
- 11.1.5.2. Products
- 11.1.5.3. Company Financials
- 11.1.5.4. SWOT Analysis
- 11.1.6 4 Samsung Electronics Co Ltd
- 11.1.6.1. Company Overview
- 11.1.6.2. Products
- 11.1.6.3. Company Financials
- 11.1.6.4. SWOT Analysis
- 11.1.7 1 Clear Vision Advertisement
- 11.1.7.1. Company Overview
- 11.1.7.2. Products
- 11.1.7.3. Company Financials
- 11.1.7.4. SWOT Analysis
- 11.1.8 4 Blue Line Media
- 11.1.8.1. Company Overview
- 11.1.8.2. Products
- 11.1.8.3. Company Financials
- 11.1.8.4. SWOT Analysis
- 11.1.9 1 Swipe Technologies
- 11.1.9.1. Company Overview
- 11.1.9.2. Products
- 11.1.9.3. Company Financials
- 11.1.9.4. SWOT Analysis
- 11.1.10 3 Curb Mobility LLC
- 11.1.10.1. Company Overview
- 11.1.10.2. Products
- 11.1.10.3. Company Financials
- 11.1.10.4. SWOT Analysis
- 11.1.11 2 Curb Mobility LLC
- 11.1.11.1. Company Overview
- 11.1.11.2. Products
- 11.1.11.3. Company Financials
- 11.1.11.4. SWOT Analysis
- 11.1.12 2 Cabby Tabby Technologies
- 11.1.12.1. Company Overview
- 11.1.12.2. Products
- 11.1.12.3. Company Financials
- 11.1.12.4. SWOT Analysis
- 11.1.13 5 BillboardsIn
- 11.1.13.1. Company Overview
- 11.1.13.2. Products
- 11.1.13.3. Company Financials
- 11.1.13.4. SWOT Analysis
- 11.1.14 6 Bona Phandle Media
- 11.1.14.1. Company Overview
- 11.1.14.2. Products
- 11.1.14.3. Company Financials
- 11.1.14.4. SWOT Analysis
- 11.1.15 Advertising Service Providers
- 11.1.15.1. Company Overview
- 11.1.15.2. Products
- 11.1.15.3. Company Financials
- 11.1.15.4. SWOT Analysis
- 11.1.16 Software Providers
- 11.1.16.1. Company Overview
- 11.1.16.2. Products
- 11.1.16.3. Company Financials
- 11.1.16.4. SWOT Analysis
- 11.1.17 3 42Gears Mobility Systems Pvt Ltd
- 11.1.17.1. Company Overview
- 11.1.17.2. Products
- 11.1.17.3. Company Financials
- 11.1.17.4. SWOT Analysis
- 11.1.18 Device Manufacturers
- 11.1.18.1. Company Overview
- 11.1.18.2. Products
- 11.1.18.3. Company Financials
- 11.1.18.4. SWOT Analysis
- 11.1.1 3 42 Gears mobility systems private limited
- 11.2. Market Entropy
- 11.2.1 Company's Key Areas Served
- 11.2.2 Recent Developments
- 11.3. Company Market Share Analysis 2025
- 11.3.1 Top 5 Companies Market Share Analysis
- 11.3.2 Top 3 Companies Market Share Analysis
- 11.4. List of Potential Customers
- 12. Research Methodology
List of Figures
- Figure 1: Global In-taxi Digital Signage Industry Revenue Breakdown (undefined, %) by Region 2025 & 2033
- Figure 2: North America In-taxi Digital Signage Industry Revenue (undefined), by Vehicle Type 2025 & 2033
- Figure 3: North America In-taxi Digital Signage Industry Revenue Share (%), by Vehicle Type 2025 & 2033
- Figure 4: North America In-taxi Digital Signage Industry Revenue (undefined), by Display Type 2025 & 2033
- Figure 5: North America In-taxi Digital Signage Industry Revenue Share (%), by Display Type 2025 & 2033
- Figure 6: North America In-taxi Digital Signage Industry Revenue (undefined), by Country 2025 & 2033
- Figure 7: North America In-taxi Digital Signage Industry Revenue Share (%), by Country 2025 & 2033
- Figure 8: Europe In-taxi Digital Signage Industry Revenue (undefined), by Vehicle Type 2025 & 2033
- Figure 9: Europe In-taxi Digital Signage Industry Revenue Share (%), by Vehicle Type 2025 & 2033
- Figure 10: Europe In-taxi Digital Signage Industry Revenue (undefined), by Display Type 2025 & 2033
- Figure 11: Europe In-taxi Digital Signage Industry Revenue Share (%), by Display Type 2025 & 2033
- Figure 12: Europe In-taxi Digital Signage Industry Revenue (undefined), by Country 2025 & 2033
- Figure 13: Europe In-taxi Digital Signage Industry Revenue Share (%), by Country 2025 & 2033
- Figure 14: Asia Pacific In-taxi Digital Signage Industry Revenue (undefined), by Vehicle Type 2025 & 2033
- Figure 15: Asia Pacific In-taxi Digital Signage Industry Revenue Share (%), by Vehicle Type 2025 & 2033
- Figure 16: Asia Pacific In-taxi Digital Signage Industry Revenue (undefined), by Display Type 2025 & 2033
- Figure 17: Asia Pacific In-taxi Digital Signage Industry Revenue Share (%), by Display Type 2025 & 2033
- Figure 18: Asia Pacific In-taxi Digital Signage Industry Revenue (undefined), by Country 2025 & 2033
- Figure 19: Asia Pacific In-taxi Digital Signage Industry Revenue Share (%), by Country 2025 & 2033
- Figure 20: Rest of the World In-taxi Digital Signage Industry Revenue (undefined), by Vehicle Type 2025 & 2033
- Figure 21: Rest of the World In-taxi Digital Signage Industry Revenue Share (%), by Vehicle Type 2025 & 2033
- Figure 22: Rest of the World In-taxi Digital Signage Industry Revenue (undefined), by Display Type 2025 & 2033
- Figure 23: Rest of the World In-taxi Digital Signage Industry Revenue Share (%), by Display Type 2025 & 2033
- Figure 24: Rest of the World In-taxi Digital Signage Industry Revenue (undefined), by Country 2025 & 2033
- Figure 25: Rest of the World In-taxi Digital Signage Industry Revenue Share (%), by Country 2025 & 2033
List of Tables
- Table 1: Global In-taxi Digital Signage Industry Revenue undefined Forecast, by Vehicle Type 2020 & 2033
- Table 2: Global In-taxi Digital Signage Industry Revenue undefined Forecast, by Display Type 2020 & 2033
- Table 3: Global In-taxi Digital Signage Industry Revenue undefined Forecast, by Region 2020 & 2033
- Table 4: Global In-taxi Digital Signage Industry Revenue undefined Forecast, by Vehicle Type 2020 & 2033
- Table 5: Global In-taxi Digital Signage Industry Revenue undefined Forecast, by Display Type 2020 & 2033
- Table 6: Global In-taxi Digital Signage Industry Revenue undefined Forecast, by Country 2020 & 2033
- Table 7: United States In-taxi Digital Signage Industry Revenue (undefined) Forecast, by Application 2020 & 2033
- Table 8: Canada In-taxi Digital Signage Industry Revenue (undefined) Forecast, by Application 2020 & 2033
- Table 9: Rest of North America In-taxi Digital Signage Industry Revenue (undefined) Forecast, by Application 2020 & 2033
- Table 10: Global In-taxi Digital Signage Industry Revenue undefined Forecast, by Vehicle Type 2020 & 2033
- Table 11: Global In-taxi Digital Signage Industry Revenue undefined Forecast, by Display Type 2020 & 2033
- Table 12: Global In-taxi Digital Signage Industry Revenue undefined Forecast, by Country 2020 & 2033
- Table 13: United Kingdom In-taxi Digital Signage Industry Revenue (undefined) Forecast, by Application 2020 & 2033
- Table 14: Germany In-taxi Digital Signage Industry Revenue (undefined) Forecast, by Application 2020 & 2033
- Table 15: France In-taxi Digital Signage Industry Revenue (undefined) Forecast, by Application 2020 & 2033
- Table 16: Spain In-taxi Digital Signage Industry Revenue (undefined) Forecast, by Application 2020 & 2033
- Table 17: Rest of Europe In-taxi Digital Signage Industry Revenue (undefined) Forecast, by Application 2020 & 2033
- Table 18: Global In-taxi Digital Signage Industry Revenue undefined Forecast, by Vehicle Type 2020 & 2033
- Table 19: Global In-taxi Digital Signage Industry Revenue undefined Forecast, by Display Type 2020 & 2033
- Table 20: Global In-taxi Digital Signage Industry Revenue undefined Forecast, by Country 2020 & 2033
- Table 21: China In-taxi Digital Signage Industry Revenue (undefined) Forecast, by Application 2020 & 2033
- Table 22: Japan In-taxi Digital Signage Industry Revenue (undefined) Forecast, by Application 2020 & 2033
- Table 23: India In-taxi Digital Signage Industry Revenue (undefined) Forecast, by Application 2020 & 2033
- Table 24: Rest of Asia Pacific In-taxi Digital Signage Industry Revenue (undefined) Forecast, by Application 2020 & 2033
- Table 25: Global In-taxi Digital Signage Industry Revenue undefined Forecast, by Vehicle Type 2020 & 2033
- Table 26: Global In-taxi Digital Signage Industry Revenue undefined Forecast, by Display Type 2020 & 2033
- Table 27: Global In-taxi Digital Signage Industry Revenue undefined Forecast, by Country 2020 & 2033
- Table 28: Saudi Arabia In-taxi Digital Signage Industry Revenue (undefined) Forecast, by Application 2020 & 2033
- Table 29: Brazil In-taxi Digital Signage Industry Revenue (undefined) Forecast, by Application 2020 & 2033
- Table 30: Other Countries In-taxi Digital Signage Industry Revenue (undefined) Forecast, by Application 2020 & 2033
Frequently Asked Questions
1. What is the projected Compound Annual Growth Rate (CAGR) of the In-taxi Digital Signage Industry?
The projected CAGR is approximately 4.5%.
2. Which companies are prominent players in the In-taxi Digital Signage Industry?
Key companies in the market include 3 42 Gears mobility systems private limited, 2 London Taxi Advertising, 1 Enroute View Media Inc, 5 Apple Inc, 6 VeriFone Holdings Inc, 4 Samsung Electronics Co Ltd, 1 Clear Vision Advertisement, 4 Blue Line Media, 1 Swipe Technologies, 3 Curb Mobility LLC, 2 Curb Mobility LLC, 2 Cabby Tabby Technologies, 5 BillboardsIn, 6 Bona Phandle Media, Advertising Service Providers, Software Providers, 3 42Gears Mobility Systems Pvt Ltd, Device Manufacturers.
3. What are the main segments of the In-taxi Digital Signage Industry?
The market segments include Vehicle Type, Display Type.
4. Can you provide details about the market size?
The market size is estimated to be USD XXX N/A as of 2022.
5. What are some drivers contributing to market growth?
Exponential Increase in Automotive Sector.
6. What are the notable trends driving market growth?
Growing Adoption of Entertainment Devices in Luxury Taxis.
7. Are there any restraints impacting market growth?
Digitization of R&D Operations in Automotive Sector.
8. Can you provide examples of recent developments in the market?
N/A
9. What pricing options are available for accessing the report?
Pricing options include single-user, multi-user, and enterprise licenses priced at USD 4750, USD 5250, and USD 8750 respectively.
10. Is the market size provided in terms of value or volume?
The market size is provided in terms of value, measured in N/A.
11. Are there any specific market keywords associated with the report?
Yes, the market keyword associated with the report is "In-taxi Digital Signage Industry," which aids in identifying and referencing the specific market segment covered.
12. How do I determine which pricing option suits my needs best?
The pricing options vary based on user requirements and access needs. Individual users may opt for single-user licenses, while businesses requiring broader access may choose multi-user or enterprise licenses for cost-effective access to the report.
13. Are there any additional resources or data provided in the In-taxi Digital Signage Industry report?
While the report offers comprehensive insights, it's advisable to review the specific contents or supplementary materials provided to ascertain if additional resources or data are available.
14. How can I stay updated on further developments or reports in the In-taxi Digital Signage Industry?
To stay informed about further developments, trends, and reports in the In-taxi Digital Signage Industry, consider subscribing to industry newsletters, following relevant companies and organizations, or regularly checking reputable industry news sources and publications.
Methodology
Step 1 - Identification of Relevant Samples Size from Population Database


Step 2 - Approaches for Defining Global Market Size (Value, Volume* & Price*)

Note*: In applicable scenarios
Step 3 - Data Sources
Primary Research
- Web Analytics
- Survey Reports
- Research Institute
- Latest Research Reports
- Opinion Leaders
Secondary Research
- Annual Reports
- White Paper
- Latest Press Release
- Industry Association
- Paid Database
- Investor Presentations

Step 4 - Data Triangulation
Involves using different sources of information in order to increase the validity of a study
These sources are likely to be stakeholders in a program - participants, other researchers, program staff, other community members, and so on.
Then we put all data in single framework & apply various statistical tools to find out the dynamic on the market.
During the analysis stage, feedback from the stakeholder groups would be compared to determine areas of agreement as well as areas of divergence