

Key Insights
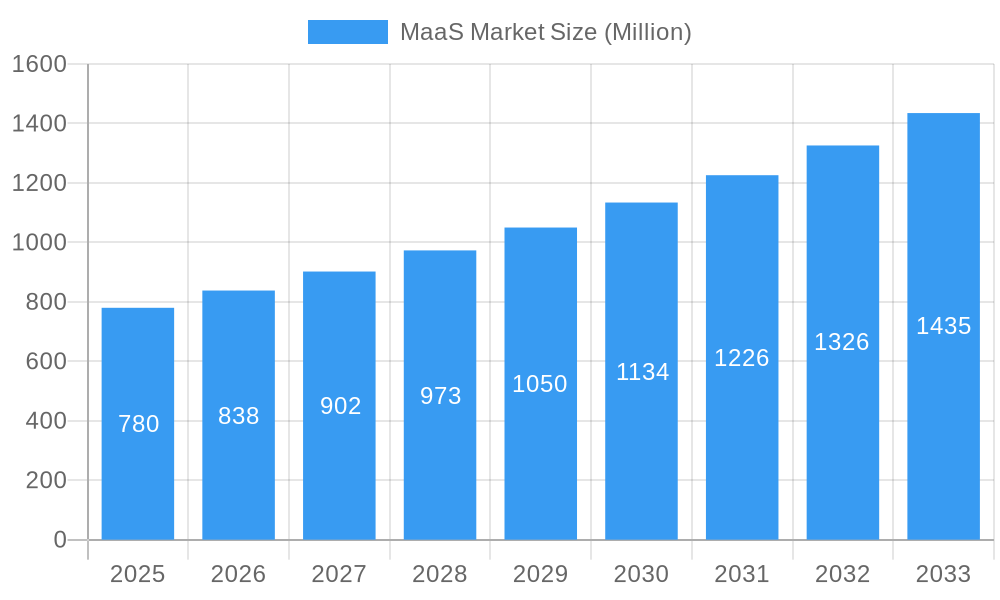
The Mobility as a Service (MaaS) market, valued at $0.78 billion in 2025, is experiencing robust growth, projected to expand at a Compound Annual Growth Rate (CAGR) of 7.43% from 2025 to 2033. This growth is fueled by several key factors. Increasing urbanization and traffic congestion in major cities are driving demand for efficient and integrated transportation solutions. The rising adoption of smartphones and mobile applications facilitates seamless access to MaaS platforms, enhancing user experience and convenience. Furthermore, growing environmental concerns and the push for sustainable transportation are encouraging the shift towards shared mobility options offered by MaaS providers. Government initiatives promoting sustainable transportation and smart city development further contribute to the market's expansion. The market segmentation reveals a strong preference for car-based services within the private transportation sector, although public transport integration is rapidly gaining traction. Competition among established players like Hertz, Uber, and Avis, alongside innovative startups, is driving innovation and service diversification.
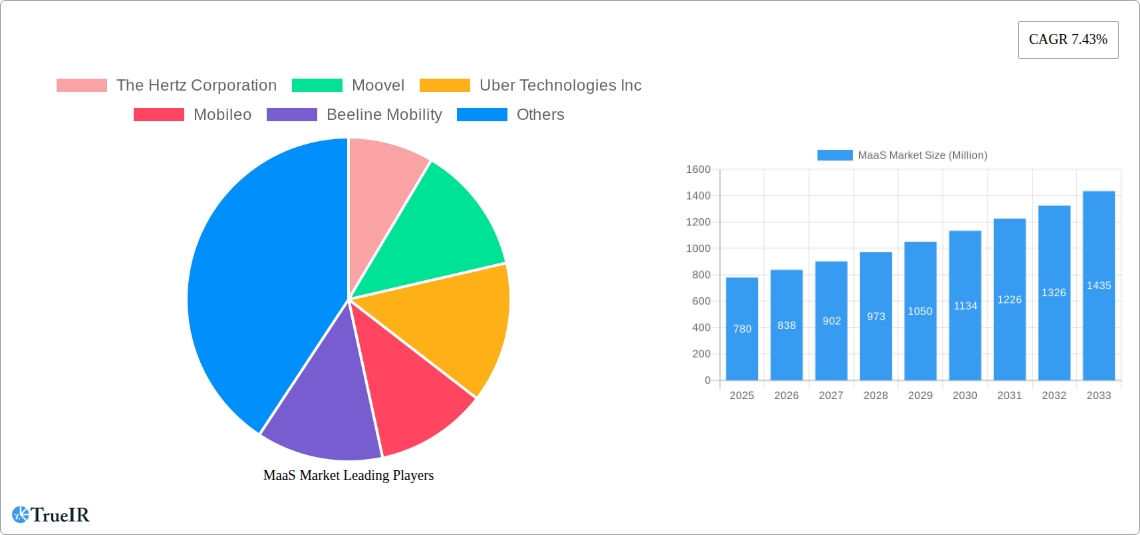
MaaS Market Market Size (In Million)
The MaaS market's geographical distribution shows strong potential across diverse regions. North America, particularly the United States, is expected to maintain a significant market share due to early adoption and technological advancements. Europe, driven by strong government support and a developed public transport infrastructure, is poised for substantial growth. The Asia-Pacific region, particularly India and China, presents a high-growth opportunity due to rapid urbanization and rising disposable incomes, although infrastructure limitations may present a challenge. While precise regional market shares are unavailable, a reasonable estimation based on existing market trends would show North America and Europe holding a larger share initially, with Asia-Pacific demonstrating faster growth in the later years of the forecast period. This dynamic landscape suggests a significant expansion of MaaS services globally in the coming decade.
MaaS Market Company Market Share
This dynamic report offers an in-depth analysis of the burgeoning Mobility as a Service (MaaS) market, projecting robust growth from 2025 to 2033. Leveraging extensive market research and data analysis conducted between 2019 and 2024, this report provides crucial insights for investors, industry stakeholders, and strategic decision-makers. The report uses 2025 as its base and estimated year and forecasts growth until 2033.
MaaS Market Market Structure & Competitive Landscape
The MaaS market exhibits a moderately concentrated structure, with key players such as Uber Technologies Inc, The Hertz Corporation, and Didi Chuxing holding significant market share. However, the landscape is dynamic, characterized by continuous innovation and strategic mergers and acquisitions (M&A). The xx% market concentration ratio in 2024 indicates ongoing consolidation. Innovation drivers include the development of integrated mobility platforms, advancements in data analytics for personalized services, and the emergence of autonomous vehicle technology. Regulatory impacts vary significantly across regions, influencing market access and operational costs. Product substitutes, including traditional transportation modes, pose a competitive challenge. End-user segmentation includes commuters, tourists, and businesses, each with unique needs and preferences. M&A activity has been significant in recent years, with an estimated volume of xx deals in 2024, primarily focused on expanding service offerings and geographical reach. The trend indicates further consolidation and integration within the industry.
MaaS Market Market Trends & Opportunities
The MaaS market is experiencing exponential growth, with a projected Compound Annual Growth Rate (CAGR) of xx% during the forecast period (2025-2033). Market size is estimated to reach xx Million by 2025, driven by increasing urbanization, rising demand for convenient and sustainable transportation options, and advancements in technology. Technological shifts, particularly the integration of artificial intelligence (AI), the Internet of Things (IoT), and big data analytics, are enhancing operational efficiency and personalizing user experiences. Consumer preferences are shifting towards integrated, on-demand services that offer seamless multimodal journeys. Competitive dynamics are intensified by the entry of new players and the expansion of existing ones, leading to price competition and service innovation. Market penetration rates are expected to increase significantly in the coming years, especially in urban areas with well-developed infrastructure.
Dominant Markets & Segments in MaaS Market
The North American and European markets are currently dominating the MaaS landscape, driven by high levels of technological adoption, supportive government policies, and well-established transportation infrastructure. Within these markets, urban centers are experiencing the fastest growth.
By Service Type:
- Car: The car segment is currently the largest, driven by the convenience and flexibility it offers. However, the growth of other modes is catching up.
- Bus: Bus services are gaining traction as a cost-effective and sustainable solution, particularly in densely populated areas.
- Bike: Bike-sharing programs are proliferating in many cities, driven by environmental concerns and health awareness.
By Transportation Type:
- Private: Private transport services, such as ride-hailing, continue to be popular for convenience.
- Public: Integration of public transport into MaaS platforms is enhancing accessibility and reducing reliance on private vehicles.
Key Growth Drivers:
- Government Initiatives: Supportive policies, including funding for smart city projects and investments in public transport infrastructure, are boosting market growth.
- Technological Advancements: The development of AI-powered route optimization, real-time data analysis, and seamless payment systems improves the user experience.
- Urbanization: Rapid urbanization is driving the demand for efficient transportation solutions within congested cities.
MaaS Market Product Analysis
MaaS offerings are evolving beyond simple ride-hailing to encompass comprehensive, integrated platforms that provide seamless multimodal journeys. Key product innovations include real-time data integration, personalized trip planning, dynamic pricing models, and the integration of diverse transportation modes. These advancements enhance user convenience and create a competitive advantage by meeting the diverse needs of commuters and travelers. The market fit is strong in urban areas and continues to expand into suburban and rural regions.
Key Drivers, Barriers & Challenges in MaaS Market
Key Drivers:
- Technological advancements: AI, IoT, and big data analytics are streamlining operations, improving efficiency and personalizing the user experience.
- Rising urbanization: Increasing populations in urban areas create a greater need for efficient public transit.
- Government support: Investment in smart city initiatives and supportive regulations are fostering growth.
Key Challenges and Restraints:
- Regulatory hurdles: Differing regulations across jurisdictions create complexities in operations and expansion.
- Data privacy concerns: The collection and use of user data require robust security and privacy measures.
- Competition: Intense competition from established players and new entrants puts pressure on pricing and profitability. (Estimated xx% decrease in average revenue per user in 2024 due to competition).
Growth Drivers in the MaaS Market Market
The MaaS market is primarily driven by technological advancements such as AI-powered route optimization, the proliferation of smartphone usage, and the integration of various modes of transportation. Economic factors like rising disposable incomes in developing economies and the rising cost of car ownership also stimulate growth. Supportive government policies and initiatives focused on sustainable transportation further propel the market forward.
Challenges Impacting MaaS Market Growth
Challenges include regulatory complexities, especially variations across different jurisdictions. Supply chain disruptions can impact service availability. Intense competition amongst established and emerging players creates price pressures and necessitates continuous innovation to maintain market share.
Key Players Shaping the MaaS Market Market
- The Hertz Corporation
- Moovel
- Uber Technologies Inc
- Mobileo
- Beeline Mobility
- Enterprise Holdings Inc
- Avis Budget Group
- Moovit Inc
- Whim (Maas Global)
- Didi Chuxing
- Bridj Technology Pty Ltd
- Ubigo (via-id)
- Citymapper
Significant MaaS Market Industry Milestones
- December 2022: Moovit launches in Tampa, Florida, implementing a Mobility as a Service (MaaS) pilot program integrating various transport modes.
- January 2023: DiDi collaborates with Jordan Transfer Guidance to integrate taxi dispatch into a tourism app, supporting Jordan's MaaS service.
- February 2023: Uber partners with HSBC to provide unbanked drivers in Egypt with access to timely digital payments.
Future Outlook for MaaS Market Market
The MaaS market is poised for sustained growth, driven by continued technological innovation, expanding urban populations, and increased government support for sustainable transportation solutions. Strategic partnerships and collaborations are expected to further shape the market landscape, with opportunities for enhanced service integration, data-driven optimization, and expansion into new geographical markets. The market's potential is significant, with substantial room for expansion and diversification of services.
MaaS Market Segmentation
-
1. Service Type
- 1.1. Car
- 1.2. Bus
- 1.3. Bike
-
2. Transportation Type
- 2.1. Public
- 2.2. Private
MaaS Market Segmentation By Geography
-
1. North America
- 1.1. United States
- 1.2. Canada
- 1.3. Rest of North America
-
2. Europe
- 2.1. Germany
- 2.2. United Kingdom
- 2.3. France
- 2.4. Rest of Europe
-
3. Asia Pacific
- 3.1. India
- 3.2. China
- 3.3. Japan
- 3.4. South Korea
- 3.5. Rest of Asia Pacific
-
4. Rest of the World
- 4.1. South America
- 4.2. Middle East and Africa
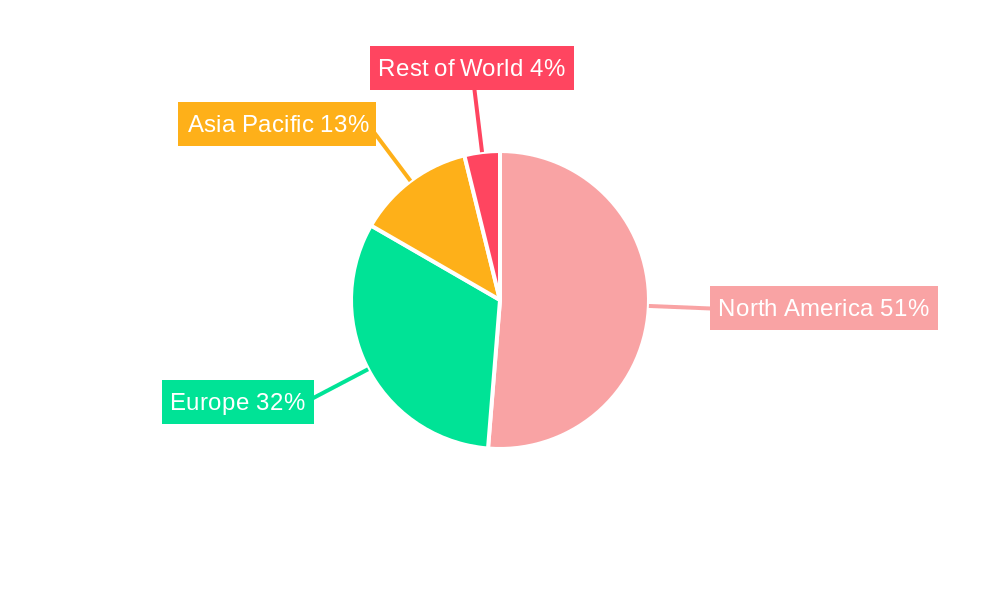
MaaS Market Regional Market Share
Geographic Coverage of MaaS Market
MaaS Market REPORT HIGHLIGHTS
| Aspects | Details |
|---|---|
| Study Period | 2020-2034 |
| Base Year | 2025 |
| Estimated Year | 2026 |
| Forecast Period | 2026-2034 |
| Historical Period | 2020-2025 |
| Growth Rate | CAGR of 7.43% from 2020-2034 |
| Segmentation |
|
Table of Contents
- 1. Introduction
- 1.1. Research Scope
- 1.2. Market Segmentation
- 1.3. Research Objective
- 1.4. Definitions and Assumptions
- 2. Executive Summary
- 2.1. Market Snapshot
- 3. Market Dynamics
- 3.1. Market Drivers
- 3.2. Market Restrains
- 3.3. Market Trends
- 3.4. Market Opportunities
- 4. Market Factor Analysis
- 4.1. Porters Five Forces
- 4.1.1. Bargaining Power of Suppliers
- 4.1.2. Bargaining Power of Buyers
- 4.1.3. Threat of New Entrants
- 4.1.4. Threat of Substitutes
- 4.1.5. Competitive Rivalry
- 4.2. PESTEL analysis
- 4.3. BCG Analysis
- 4.3.1. Stars (High Growth, High Market Share)
- 4.3.2. Cash Cows (Low Growth, High Market Share)
- 4.3.3. Question Mark (High Growth, Low Market Share)
- 4.3.4. Dogs (Low Growth, Low Market Share)
- 4.4. Ansoff Matrix Analysis
- 4.5. Supply Chain Analysis
- 4.6. Regulatory Landscape
- 4.7. Current Market Potential and Opportunity Assessment (TAM–SAM–SOM Framework)
- 4.8. TIR Analyst Note
- 4.1. Porters Five Forces
- 5. Market Analysis, Insights and Forecast 2021-2033
- 5.1. Market Analysis, Insights and Forecast - by Service Type
- 5.1.1. Car
- 5.1.2. Bus
- 5.1.3. Bike
- 5.2. Market Analysis, Insights and Forecast - by Transportation Type
- 5.2.1. Public
- 5.2.2. Private
- 5.3. Market Analysis, Insights and Forecast - by Region
- 5.3.1. North America
- 5.3.2. Europe
- 5.3.3. Asia Pacific
- 5.3.4. Rest of the World
- 5.1. Market Analysis, Insights and Forecast - by Service Type
- 6. Global MaaS Market Analysis, Insights and Forecast, 2021-2033
- 6.1. Market Analysis, Insights and Forecast - by Service Type
- 6.1.1. Car
- 6.1.2. Bus
- 6.1.3. Bike
- 6.2. Market Analysis, Insights and Forecast - by Transportation Type
- 6.2.1. Public
- 6.2.2. Private
- 6.1. Market Analysis, Insights and Forecast - by Service Type
- 7. North America MaaS Market Analysis, Insights and Forecast, 2020-2032
- 7.1. Market Analysis, Insights and Forecast - by Service Type
- 7.1.1. Car
- 7.1.2. Bus
- 7.1.3. Bike
- 7.2. Market Analysis, Insights and Forecast - by Transportation Type
- 7.2.1. Public
- 7.2.2. Private
- 7.1. Market Analysis, Insights and Forecast - by Service Type
- 8. Europe MaaS Market Analysis, Insights and Forecast, 2020-2032
- 8.1. Market Analysis, Insights and Forecast - by Service Type
- 8.1.1. Car
- 8.1.2. Bus
- 8.1.3. Bike
- 8.2. Market Analysis, Insights and Forecast - by Transportation Type
- 8.2.1. Public
- 8.2.2. Private
- 8.1. Market Analysis, Insights and Forecast - by Service Type
- 9. Asia Pacific MaaS Market Analysis, Insights and Forecast, 2020-2032
- 9.1. Market Analysis, Insights and Forecast - by Service Type
- 9.1.1. Car
- 9.1.2. Bus
- 9.1.3. Bike
- 9.2. Market Analysis, Insights and Forecast - by Transportation Type
- 9.2.1. Public
- 9.2.2. Private
- 9.1. Market Analysis, Insights and Forecast - by Service Type
- 10. Rest of the World MaaS Market Analysis, Insights and Forecast, 2020-2032
- 10.1. Market Analysis, Insights and Forecast - by Service Type
- 10.1.1. Car
- 10.1.2. Bus
- 10.1.3. Bike
- 10.2. Market Analysis, Insights and Forecast - by Transportation Type
- 10.2.1. Public
- 10.2.2. Private
- 10.1. Market Analysis, Insights and Forecast - by Service Type
- 11. Competitive Analysis
- 11.1. Company Profiles
- 11.1.1 The Hertz Corporation
- 11.1.1.1. Company Overview
- 11.1.1.2. Products
- 11.1.1.3. Company Financials
- 11.1.1.4. SWOT Analysis
- 11.1.2 Moovel
- 11.1.2.1. Company Overview
- 11.1.2.2. Products
- 11.1.2.3. Company Financials
- 11.1.2.4. SWOT Analysis
- 11.1.3 Uber Technologies Inc
- 11.1.3.1. Company Overview
- 11.1.3.2. Products
- 11.1.3.3. Company Financials
- 11.1.3.4. SWOT Analysis
- 11.1.4 Mobileo
- 11.1.4.1. Company Overview
- 11.1.4.2. Products
- 11.1.4.3. Company Financials
- 11.1.4.4. SWOT Analysis
- 11.1.5 Beeline Mobility
- 11.1.5.1. Company Overview
- 11.1.5.2. Products
- 11.1.5.3. Company Financials
- 11.1.5.4. SWOT Analysis
- 11.1.6 Enterprise Holdings Inc
- 11.1.6.1. Company Overview
- 11.1.6.2. Products
- 11.1.6.3. Company Financials
- 11.1.6.4. SWOT Analysis
- 11.1.7 Avis Budget Group
- 11.1.7.1. Company Overview
- 11.1.7.2. Products
- 11.1.7.3. Company Financials
- 11.1.7.4. SWOT Analysis
- 11.1.8 Moovit Inc
- 11.1.8.1. Company Overview
- 11.1.8.2. Products
- 11.1.8.3. Company Financials
- 11.1.8.4. SWOT Analysis
- 11.1.9 Whim (Maas Global)
- 11.1.9.1. Company Overview
- 11.1.9.2. Products
- 11.1.9.3. Company Financials
- 11.1.9.4. SWOT Analysis
- 11.1.10 Didi Chuxing
- 11.1.10.1. Company Overview
- 11.1.10.2. Products
- 11.1.10.3. Company Financials
- 11.1.10.4. SWOT Analysis
- 11.1.11 Bridj Technology Pty Ltd
- 11.1.11.1. Company Overview
- 11.1.11.2. Products
- 11.1.11.3. Company Financials
- 11.1.11.4. SWOT Analysis
- 11.1.12 Ubigo (via-id)
- 11.1.12.1. Company Overview
- 11.1.12.2. Products
- 11.1.12.3. Company Financials
- 11.1.12.4. SWOT Analysis
- 11.1.13 Citymapper
- 11.1.13.1. Company Overview
- 11.1.13.2. Products
- 11.1.13.3. Company Financials
- 11.1.13.4. SWOT Analysis
- 11.1.1 The Hertz Corporation
- 11.2. Market Entropy
- 11.2.1 Company's Key Areas Served
- 11.2.2 Recent Developments
- 11.3. Company Market Share Analysis 2025
- 11.3.1 Top 5 Companies Market Share Analysis
- 11.3.2 Top 3 Companies Market Share Analysis
- 11.4. List of Potential Customers
- 12. Research Methodology
List of Figures
- Figure 1: Global MaaS Market Revenue Breakdown (Million, %) by Region 2025 & 2033
- Figure 2: North America MaaS Market Revenue (Million), by Service Type 2025 & 2033
- Figure 3: North America MaaS Market Revenue Share (%), by Service Type 2025 & 2033
- Figure 4: North America MaaS Market Revenue (Million), by Transportation Type 2025 & 2033
- Figure 5: North America MaaS Market Revenue Share (%), by Transportation Type 2025 & 2033
- Figure 6: North America MaaS Market Revenue (Million), by Country 2025 & 2033
- Figure 7: North America MaaS Market Revenue Share (%), by Country 2025 & 2033
- Figure 8: Europe MaaS Market Revenue (Million), by Service Type 2025 & 2033
- Figure 9: Europe MaaS Market Revenue Share (%), by Service Type 2025 & 2033
- Figure 10: Europe MaaS Market Revenue (Million), by Transportation Type 2025 & 2033
- Figure 11: Europe MaaS Market Revenue Share (%), by Transportation Type 2025 & 2033
- Figure 12: Europe MaaS Market Revenue (Million), by Country 2025 & 2033
- Figure 13: Europe MaaS Market Revenue Share (%), by Country 2025 & 2033
- Figure 14: Asia Pacific MaaS Market Revenue (Million), by Service Type 2025 & 2033
- Figure 15: Asia Pacific MaaS Market Revenue Share (%), by Service Type 2025 & 2033
- Figure 16: Asia Pacific MaaS Market Revenue (Million), by Transportation Type 2025 & 2033
- Figure 17: Asia Pacific MaaS Market Revenue Share (%), by Transportation Type 2025 & 2033
- Figure 18: Asia Pacific MaaS Market Revenue (Million), by Country 2025 & 2033
- Figure 19: Asia Pacific MaaS Market Revenue Share (%), by Country 2025 & 2033
- Figure 20: Rest of the World MaaS Market Revenue (Million), by Service Type 2025 & 2033
- Figure 21: Rest of the World MaaS Market Revenue Share (%), by Service Type 2025 & 2033
- Figure 22: Rest of the World MaaS Market Revenue (Million), by Transportation Type 2025 & 2033
- Figure 23: Rest of the World MaaS Market Revenue Share (%), by Transportation Type 2025 & 2033
- Figure 24: Rest of the World MaaS Market Revenue (Million), by Country 2025 & 2033
- Figure 25: Rest of the World MaaS Market Revenue Share (%), by Country 2025 & 2033
List of Tables
- Table 1: Global MaaS Market Revenue Million Forecast, by Service Type 2020 & 2033
- Table 2: Global MaaS Market Revenue Million Forecast, by Transportation Type 2020 & 2033
- Table 3: Global MaaS Market Revenue Million Forecast, by Region 2020 & 2033
- Table 4: Global MaaS Market Revenue Million Forecast, by Service Type 2020 & 2033
- Table 5: Global MaaS Market Revenue Million Forecast, by Transportation Type 2020 & 2033
- Table 6: Global MaaS Market Revenue Million Forecast, by Country 2020 & 2033
- Table 7: United States MaaS Market Revenue (Million) Forecast, by Application 2020 & 2033
- Table 8: Canada MaaS Market Revenue (Million) Forecast, by Application 2020 & 2033
- Table 9: Rest of North America MaaS Market Revenue (Million) Forecast, by Application 2020 & 2033
- Table 10: Global MaaS Market Revenue Million Forecast, by Service Type 2020 & 2033
- Table 11: Global MaaS Market Revenue Million Forecast, by Transportation Type 2020 & 2033
- Table 12: Global MaaS Market Revenue Million Forecast, by Country 2020 & 2033
- Table 13: Germany MaaS Market Revenue (Million) Forecast, by Application 2020 & 2033
- Table 14: United Kingdom MaaS Market Revenue (Million) Forecast, by Application 2020 & 2033
- Table 15: France MaaS Market Revenue (Million) Forecast, by Application 2020 & 2033
- Table 16: Rest of Europe MaaS Market Revenue (Million) Forecast, by Application 2020 & 2033
- Table 17: Global MaaS Market Revenue Million Forecast, by Service Type 2020 & 2033
- Table 18: Global MaaS Market Revenue Million Forecast, by Transportation Type 2020 & 2033
- Table 19: Global MaaS Market Revenue Million Forecast, by Country 2020 & 2033
- Table 20: India MaaS Market Revenue (Million) Forecast, by Application 2020 & 2033
- Table 21: China MaaS Market Revenue (Million) Forecast, by Application 2020 & 2033
- Table 22: Japan MaaS Market Revenue (Million) Forecast, by Application 2020 & 2033
- Table 23: South Korea MaaS Market Revenue (Million) Forecast, by Application 2020 & 2033
- Table 24: Rest of Asia Pacific MaaS Market Revenue (Million) Forecast, by Application 2020 & 2033
- Table 25: Global MaaS Market Revenue Million Forecast, by Service Type 2020 & 2033
- Table 26: Global MaaS Market Revenue Million Forecast, by Transportation Type 2020 & 2033
- Table 27: Global MaaS Market Revenue Million Forecast, by Country 2020 & 2033
- Table 28: South America MaaS Market Revenue (Million) Forecast, by Application 2020 & 2033
- Table 29: Middle East and Africa MaaS Market Revenue (Million) Forecast, by Application 2020 & 2033
Frequently Asked Questions
1. What is the projected Compound Annual Growth Rate (CAGR) of the MaaS Market?
The projected CAGR is approximately 7.43%.
2. Which companies are prominent players in the MaaS Market?
Key companies in the market include The Hertz Corporation, Moovel, Uber Technologies Inc, Mobileo, Beeline Mobility, Enterprise Holdings Inc, Avis Budget Group, Moovit Inc, Whim (Maas Global), Didi Chuxing, Bridj Technology Pty Ltd, Ubigo (via-id), Citymapper.
3. What are the main segments of the MaaS Market?
The market segments include Service Type, Transportation Type.
4. Can you provide details about the market size?
The market size is estimated to be USD 0.78 Million as of 2022.
5. What are some drivers contributing to market growth?
Increasing Vehicle Production; Emphasis on Vehicle Comfort and NVH Reduction.
6. What are the notable trends driving market growth?
Increasing Traffic Congestion Drive the Demand in the Market.
7. Are there any restraints impacting market growth?
Economic Fluctuations And Uncertainties.
8. Can you provide examples of recent developments in the market?
In February 2023, Uber partnered with financial services firm HSBC to launch a digital payments solution that allows unbanked drivers in Egypt to receive on-demand cash outs into mobile wallets. Through this collaboration, the companies hope to provide Uber platform drivers with access to 100% of their earnings in a timely and convenient manner via HSBC Net's payment solution.
9. What pricing options are available for accessing the report?
Pricing options include single-user, multi-user, and enterprise licenses priced at USD 4750, USD 5250, and USD 8750 respectively.
10. Is the market size provided in terms of value or volume?
The market size is provided in terms of value, measured in Million.
11. Are there any specific market keywords associated with the report?
Yes, the market keyword associated with the report is "MaaS Market," which aids in identifying and referencing the specific market segment covered.
12. How do I determine which pricing option suits my needs best?
The pricing options vary based on user requirements and access needs. Individual users may opt for single-user licenses, while businesses requiring broader access may choose multi-user or enterprise licenses for cost-effective access to the report.
13. Are there any additional resources or data provided in the MaaS Market report?
While the report offers comprehensive insights, it's advisable to review the specific contents or supplementary materials provided to ascertain if additional resources or data are available.
14. How can I stay updated on further developments or reports in the MaaS Market?
To stay informed about further developments, trends, and reports in the MaaS Market, consider subscribing to industry newsletters, following relevant companies and organizations, or regularly checking reputable industry news sources and publications.
Methodology
Step 1 - Identification of Relevant Samples Size from Population Database


Step 2 - Approaches for Defining Global Market Size (Value, Volume* & Price*)

Note*: In applicable scenarios
Step 3 - Data Sources
Primary Research
- Web Analytics
- Survey Reports
- Research Institute
- Latest Research Reports
- Opinion Leaders
Secondary Research
- Annual Reports
- White Paper
- Latest Press Release
- Industry Association
- Paid Database
- Investor Presentations

Step 4 - Data Triangulation
Involves using different sources of information in order to increase the validity of a study
These sources are likely to be stakeholders in a program - participants, other researchers, program staff, other community members, and so on.
Then we put all data in single framework & apply various statistical tools to find out the dynamic on the market.
During the analysis stage, feedback from the stakeholder groups would be compared to determine areas of agreement as well as areas of divergence