

Key Insights
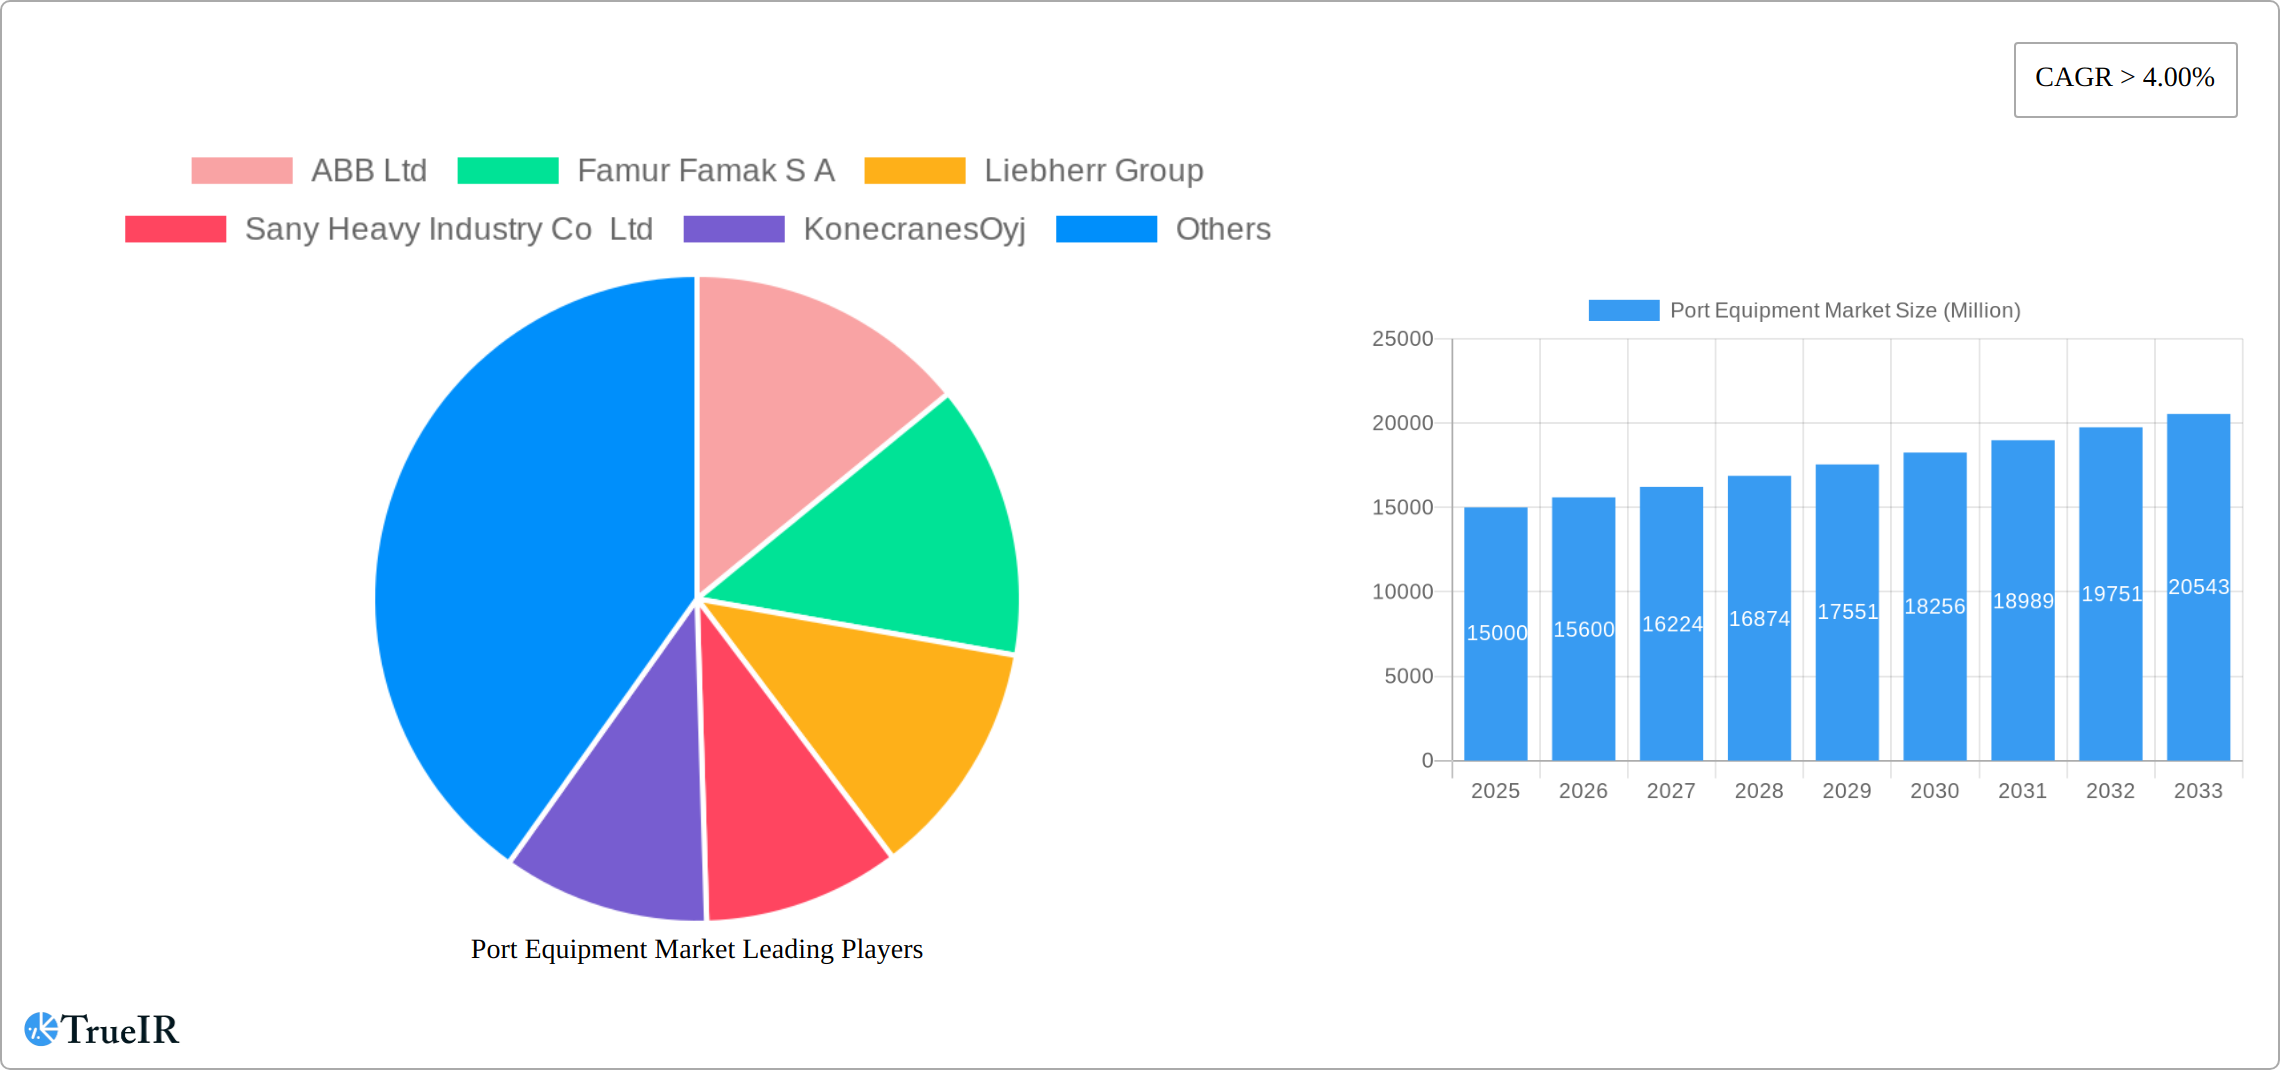
The global port equipment market is experiencing robust expansion, driven by increasing international trade volumes and ongoing port infrastructure development worldwide. The market, valued at 20.4 billion in 2025, is projected to grow at a Compound Annual Growth Rate (CAGR) of 5.7% from 2025 to 2033. This growth is propelled by several key factors. The rising demand for efficient and automated port operations is accelerating the adoption of advanced equipment such as electric and hybrid cranes and reach stackers. Additionally, the shipping industry's increasing emphasis on sustainability and carbon emission reduction is stimulating demand for eco-friendly equipment. Government investments in port modernization and expansion projects, particularly in rapidly developing economies in the Asia-Pacific region, are also contributing to market growth. Container handling equipment currently dominates the market, reflecting the substantial volume of containerized cargo globally. Leading companies, including ABB Ltd, Liebherr Group, Konecranes Oyj, and Kalmar, are spearheading innovation, continuously enhancing the efficiency, safety, and environmental performance of port equipment. However, significant initial investment costs for new equipment and potential disruptions from geopolitical uncertainties may present challenges to market growth.
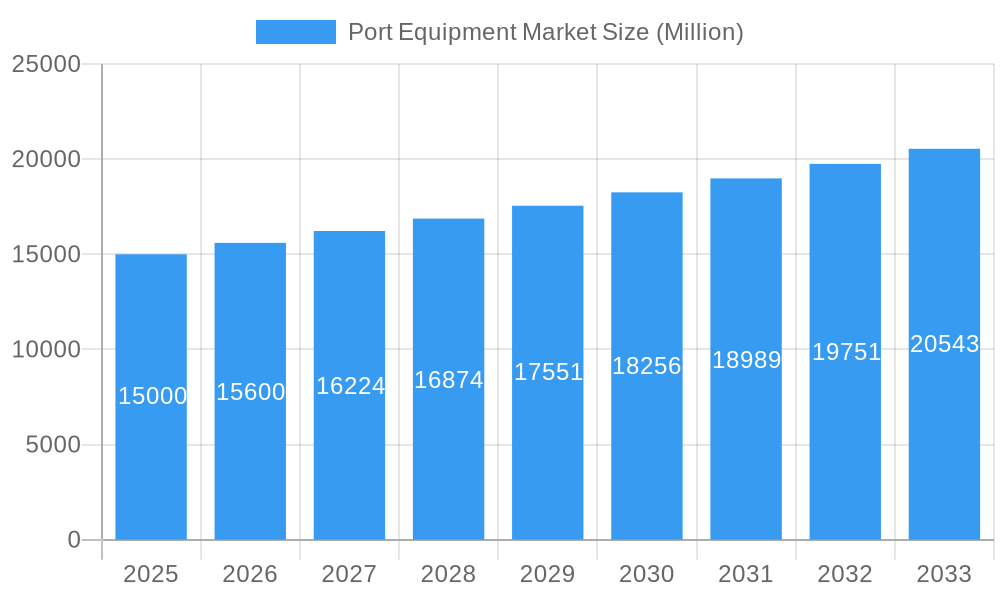
Port Equipment Market Market Size (In Billion)
Regional analysis highlights strong growth in Asia-Pacific, driven by extensive infrastructure development and increased port activities in countries such as China and India. North America and Europe maintain substantial market shares, though their growth rates may be slower compared to the Asia-Pacific region. The market's future trajectory indicates a sustained upward trend, with growth rates potentially influenced by global economic conditions and technological advancements. The integration of Internet of Things (IoT) technology and sophisticated automation systems is poised to redefine the market landscape. Manufacturers are prioritizing the development of intelligent equipment capable of real-time data analytics and predictive maintenance, thereby improving operational efficiency and minimizing downtime. A continued shift towards diverse fuel types, including increased adoption of electric and hybrid options, is anticipated, aligning with global sustainability objectives. Intense competition among key players is expected to persist, with a strategic focus on innovation, product differentiation, and strategic partnerships to secure market share. The market's ultimate success will hinge on the sustained expansion of global trade, sustainable infrastructure development, and ongoing technological innovations in port equipment.
Port Equipment Market Company Market Share
This comprehensive report offers in-depth analysis of the global Port Equipment Market, providing crucial insights for industry stakeholders, investors, and researchers. The study covers the period from 2019 to 2033, with 2025 serving as the base year and the forecast period extending from 2025 to 2033. Leveraging rigorous data analysis and expert perspectives, the report elucidates key market trends, growth drivers, challenges, and the competitive landscape. The global Port Equipment Market is projected to reach substantial figures by 2033, exhibiting a robust CAGR of 5.7% during the forecast period.
Port Equipment Market Market Structure & Competitive Landscape
The Port Equipment Market is characterized by a moderately concentrated structure, with a few dominant players and numerous smaller specialized firms. The Herfindahl-Hirschman Index (HHI) for 2024 is estimated at xx, indicating a moderately consolidated market. Innovation is a key driver, with companies constantly developing technologically advanced equipment to enhance efficiency, safety, and environmental sustainability. Stringent environmental regulations regarding emissions and noise pollution significantly impact the market, prompting the adoption of electric and hybrid fuel options. The market is also witnessing increasing adoption of automation technologies and remote control systems. Product substitution is minimal, with specialized equipment often tailored to specific port operations. End-user segmentation primarily comprises container terminals, general cargo handling facilities, and specialized ports. The past five years have seen a moderate level of mergers and acquisitions (M&A) activity, with approximately xx M&A deals completed between 2019 and 2024, primarily driven by consolidation strategies among existing players.
Port Equipment Market Market Trends & Opportunities
The global Port Equipment Market is experiencing robust growth, driven by the expansion of global trade, the increasing containerization of goods, and the development of larger, more efficient ports. Market size reached XX Million in 2024 and is projected to reach XX Million by 2033, exhibiting a CAGR of XX% during this period. This growth is fueled by increased global port capacity expansion and significant technological advancements. Key technological trends include the widespread adoption of automation, digitalization leveraging IoT technologies, and the integration of AI for enhanced operational efficiency and predictive maintenance. Sustainability is a major focus, with a growing preference for environmentally friendly equipment featuring reduced emissions and enhanced safety features. The market's competitive landscape is highly dynamic, with intense competition among major players driving innovation and creating pressure on pricing. The market penetration rate of electric and hybrid port equipment is steadily increasing, boosted by environmental concerns and government incentives promoting cleaner technologies. This shift towards sustainable and efficient solutions is reshaping the industry landscape.
Dominant Markets & Segments in Port Equipment Market
Leading Region: Asia-Pacific dominates the market, driven by robust port infrastructure development and burgeoning trade volumes. China, in particular, presents a significant market opportunity.
Leading Country: China accounts for the largest market share due to its massive container handling infrastructure, rapidly expanding trade activities, and significant investments in port modernization.
Leading Equipment Type: Cranes hold the largest market share, due to their indispensability in container handling and bulk cargo operations.
Leading Application: Container handling accounts for the major share, driven by the continued growth in containerized shipping.
Leading Fuel Type: Diesel fuel currently dominates the market, but electric and hybrid alternatives are gaining traction, driven by environmental concerns and government regulations.
Key Growth Drivers:
- Infrastructure development: Significant investments in port infrastructure globally are driving demand for port equipment.
- Government policies: Supportive government policies promoting trade and port modernization are boosting market growth.
- Technological advancements: Continuous technological innovations are enhancing equipment efficiency, productivity, and environmental performance.
- Increased global trade: Expansion of global trade necessitates increased port capacity and handling efficiency.
Detailed Analysis of Market Dominance: China's dominance is primarily due to its rapid economic growth and strategic focus on building global trade hub status. The country's significant investments in port infrastructure and ongoing expansion are key factors behind the strong demand for port equipment. Asia-Pacific's overall dominance reflects the rapid economic development and rising trade volumes within the region.
Port Equipment Market Product Analysis
Recent innovations in port equipment focus heavily on automation, remote operation, and environmentally friendly designs. This includes the development of autonomous cranes, electric and hybrid-powered trucks and reach stackers, and improved safety features. These advancements enhance efficiency, reduce operational costs, and improve sustainability, leading to a significant competitive advantage for manufacturers. The market is witnessing a trend towards modular and adaptable designs to cater to diverse port needs and changing operational demands.
Key Drivers, Barriers & Challenges in Port Equipment Market
Key Drivers:
- Technological Advancements: Automation, AI-powered systems, and the increasing adoption of electric/hybrid technologies are dramatically improving efficiency, reducing operational costs, and enhancing sustainability. This includes innovations in remote operation, predictive maintenance, and autonomous systems.
- Economic Growth & Global Trade: Continued global economic growth and the rising volume of containerized goods are driving demand for higher-capacity and more efficient port equipment. Increased e-commerce further fuels this demand.
- Government Regulations & Incentives: Stringent environmental regulations and government incentives aimed at promoting sustainable port operations are accelerating the adoption of cleaner and more energy-efficient technologies. This includes both direct subsidies and carbon emission reduction targets.
- Infrastructure Development: Significant investments in port infrastructure globally are creating demand for new and upgraded port equipment.
Challenges and Restraints:
- Supply Chain Disruptions: Global supply chain volatility continues to impact the availability and cost of components, leading to production delays and increased equipment costs. (estimated impact: XX% on production in 2024)
- Regulatory Hurdles & Compliance Costs: Meeting stringent safety and environmental regulations presents significant challenges and adds to the overall cost of manufacturing and deployment. (estimated cost increase: XX Million in 2024 for compliance)
- Intense Competition & Pricing Pressures: High competition among major players results in price pressures and reduced profit margins, requiring manufacturers to constantly innovate and optimize costs. (estimated margin reduction: XX% in 2024)
- Cybersecurity Risks: Increased reliance on digital technologies and automation introduces cybersecurity risks that need to be addressed to protect operational integrity.
Growth Drivers in the Port Equipment Market Market
Market growth is primarily driven by a confluence of factors: significant technological advancements (especially in automation and electrification), the sustained increase in global trade volumes demanding higher port handling capacities, and supportive government policies focused on efficient port operations and environmental sustainability. These factors are creating a compelling environment for continued market expansion.
Challenges Impacting Port Equipment Market Growth
The market faces challenges from global supply chain disruptions causing production delays, stringent environmental regulations increasing production costs, and intense competition pressuring profit margins.
Key Players Shaping the Port Equipment Market Market
- ABB Ltd
- Famur Famak S A
- Liebherr Group
- Sany Heavy Industry Co Ltd
- Konecranes Oyj
- Cavote
- TTS Group
- Kalmar
- CVS Ferrari
- Hyster-Yale Group
Significant Port Equipment Market Industry Milestones
- 2022: ABB Ltd launches a new range of automated container cranes.
- 2023: Kalmar introduces a new generation of electric reach stackers.
- 2024: Liebherr Group and Konecranes Oyj announce a joint venture focusing on automated port solutions.
- 2025: Sany Heavy Industry Co Ltd introduces a new line of hybrid port equipment. (projected)
Future Outlook for Port Equipment Market Market
The Port Equipment Market is poised for continued strong growth, driven by ongoing port infrastructure development worldwide, the expansion of global trade, and the accelerating adoption of advanced technologies such as AI, automation, and electrification. Significant opportunities exist for companies that can provide innovative automation solutions, electric/hybrid equipment, and comprehensive port management systems. The market is expected to see significant advancements in technological sophistication, sustainability, digitalization, and operational efficiency in the coming years. The focus on reducing environmental impact and increasing operational efficiency will be key drivers of innovation and growth.
Port Equipment Market Segmentation
-
1. Equipment Type
- 1.1. Cranes
- 1.2. Trucks
- 1.3. Reach Stackers
- 1.4. Forklifts
- 1.5. Others
-
2. Application
- 2.1. Container Handling
- 2.2. Ship Handling
-
3. Fuel Type
- 3.1. Diesel
- 3.2. Electric
- 3.3. Hybrid
Port Equipment Market Segmentation By Geography
-
1. North America
- 1.1. United States
- 1.2. Canada
- 1.3. Rest of North America
-
2. Europe
- 2.1. Germany
- 2.2. United Kingdom
- 2.3. France
- 2.4. Rest of Europe
-
3. Asia Pacific
- 3.1. India
- 3.2. China
- 3.3. Japan
- 3.4. South Korea
- 3.5. Rest of Asia Pacific
-
4. Rest of the World
- 4.1. Brazil
- 4.2. Mexico
- 4.3. United Arab Emirates
- 4.4. Other Countries
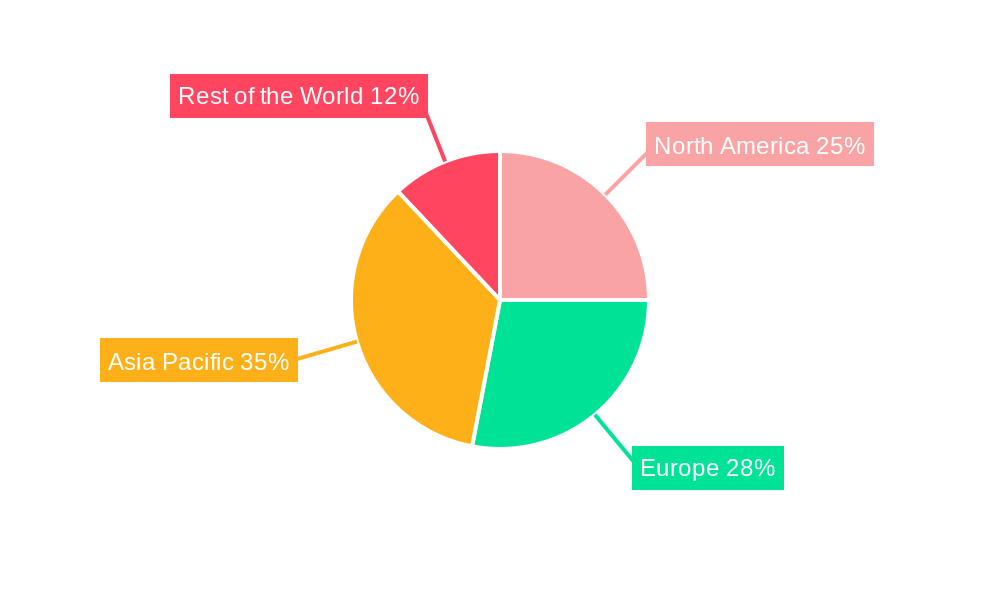
Port Equipment Market Regional Market Share
Geographic Coverage of Port Equipment Market
Port Equipment Market REPORT HIGHLIGHTS
| Aspects | Details |
|---|---|
| Study Period | 2020-2034 |
| Base Year | 2025 |
| Estimated Year | 2026 |
| Forecast Period | 2026-2034 |
| Historical Period | 2020-2025 |
| Growth Rate | CAGR of 5.7% from 2020-2034 |
| Segmentation |
|
Table of Contents
- 1. Introduction
- 1.1. Research Scope
- 1.2. Market Segmentation
- 1.3. Research Objective
- 1.4. Definitions and Assumptions
- 2. Executive Summary
- 2.1. Market Snapshot
- 3. Market Dynamics
- 3.1. Market Drivers
- 3.2. Market Restrains
- 3.3. Market Trends
- 3.4. Market Opportunities
- 4. Market Factor Analysis
- 4.1. Porters Five Forces
- 4.1.1. Bargaining Power of Suppliers
- 4.1.2. Bargaining Power of Buyers
- 4.1.3. Threat of New Entrants
- 4.1.4. Threat of Substitutes
- 4.1.5. Competitive Rivalry
- 4.2. PESTEL analysis
- 4.3. BCG Analysis
- 4.3.1. Stars (High Growth, High Market Share)
- 4.3.2. Cash Cows (Low Growth, High Market Share)
- 4.3.3. Question Mark (High Growth, Low Market Share)
- 4.3.4. Dogs (Low Growth, Low Market Share)
- 4.4. Ansoff Matrix Analysis
- 4.5. Supply Chain Analysis
- 4.6. Regulatory Landscape
- 4.7. Current Market Potential and Opportunity Assessment (TAM–SAM–SOM Framework)
- 4.8. TIR Analyst Note
- 4.1. Porters Five Forces
- 5. Market Analysis, Insights and Forecast 2021-2033
- 5.1. Market Analysis, Insights and Forecast - by Equipment Type
- 5.1.1. Cranes
- 5.1.2. Trucks
- 5.1.3. Reach Stackers
- 5.1.4. Forklifts
- 5.1.5. Others
- 5.2. Market Analysis, Insights and Forecast - by Application
- 5.2.1. Container Handling
- 5.2.2. Ship Handling
- 5.3. Market Analysis, Insights and Forecast - by Fuel Type
- 5.3.1. Diesel
- 5.3.2. Electric
- 5.3.3. Hybrid
- 5.4. Market Analysis, Insights and Forecast - by Region
- 5.4.1. North America
- 5.4.2. Europe
- 5.4.3. Asia Pacific
- 5.4.4. Rest of the World
- 5.1. Market Analysis, Insights and Forecast - by Equipment Type
- 6. Global Port Equipment Market Analysis, Insights and Forecast, 2021-2033
- 6.1. Market Analysis, Insights and Forecast - by Equipment Type
- 6.1.1. Cranes
- 6.1.2. Trucks
- 6.1.3. Reach Stackers
- 6.1.4. Forklifts
- 6.1.5. Others
- 6.2. Market Analysis, Insights and Forecast - by Application
- 6.2.1. Container Handling
- 6.2.2. Ship Handling
- 6.3. Market Analysis, Insights and Forecast - by Fuel Type
- 6.3.1. Diesel
- 6.3.2. Electric
- 6.3.3. Hybrid
- 6.1. Market Analysis, Insights and Forecast - by Equipment Type
- 7. North America Port Equipment Market Analysis, Insights and Forecast, 2020-2032
- 7.1. Market Analysis, Insights and Forecast - by Equipment Type
- 7.1.1. Cranes
- 7.1.2. Trucks
- 7.1.3. Reach Stackers
- 7.1.4. Forklifts
- 7.1.5. Others
- 7.2. Market Analysis, Insights and Forecast - by Application
- 7.2.1. Container Handling
- 7.2.2. Ship Handling
- 7.3. Market Analysis, Insights and Forecast - by Fuel Type
- 7.3.1. Diesel
- 7.3.2. Electric
- 7.3.3. Hybrid
- 7.1. Market Analysis, Insights and Forecast - by Equipment Type
- 8. Europe Port Equipment Market Analysis, Insights and Forecast, 2020-2032
- 8.1. Market Analysis, Insights and Forecast - by Equipment Type
- 8.1.1. Cranes
- 8.1.2. Trucks
- 8.1.3. Reach Stackers
- 8.1.4. Forklifts
- 8.1.5. Others
- 8.2. Market Analysis, Insights and Forecast - by Application
- 8.2.1. Container Handling
- 8.2.2. Ship Handling
- 8.3. Market Analysis, Insights and Forecast - by Fuel Type
- 8.3.1. Diesel
- 8.3.2. Electric
- 8.3.3. Hybrid
- 8.1. Market Analysis, Insights and Forecast - by Equipment Type
- 9. Asia Pacific Port Equipment Market Analysis, Insights and Forecast, 2020-2032
- 9.1. Market Analysis, Insights and Forecast - by Equipment Type
- 9.1.1. Cranes
- 9.1.2. Trucks
- 9.1.3. Reach Stackers
- 9.1.4. Forklifts
- 9.1.5. Others
- 9.2. Market Analysis, Insights and Forecast - by Application
- 9.2.1. Container Handling
- 9.2.2. Ship Handling
- 9.3. Market Analysis, Insights and Forecast - by Fuel Type
- 9.3.1. Diesel
- 9.3.2. Electric
- 9.3.3. Hybrid
- 9.1. Market Analysis, Insights and Forecast - by Equipment Type
- 10. Rest of the World Port Equipment Market Analysis, Insights and Forecast, 2020-2032
- 10.1. Market Analysis, Insights and Forecast - by Equipment Type
- 10.1.1. Cranes
- 10.1.2. Trucks
- 10.1.3. Reach Stackers
- 10.1.4. Forklifts
- 10.1.5. Others
- 10.2. Market Analysis, Insights and Forecast - by Application
- 10.2.1. Container Handling
- 10.2.2. Ship Handling
- 10.3. Market Analysis, Insights and Forecast - by Fuel Type
- 10.3.1. Diesel
- 10.3.2. Electric
- 10.3.3. Hybrid
- 10.1. Market Analysis, Insights and Forecast - by Equipment Type
- 11. Competitive Analysis
- 11.1. Company Profiles
- 11.1.1 ABB Ltd
- 11.1.1.1. Company Overview
- 11.1.1.2. Products
- 11.1.1.3. Company Financials
- 11.1.1.4. SWOT Analysis
- 11.1.2 Famur Famak S A
- 11.1.2.1. Company Overview
- 11.1.2.2. Products
- 11.1.2.3. Company Financials
- 11.1.2.4. SWOT Analysis
- 11.1.3 Liebherr Group
- 11.1.3.1. Company Overview
- 11.1.3.2. Products
- 11.1.3.3. Company Financials
- 11.1.3.4. SWOT Analysis
- 11.1.4 Sany Heavy Industry Co Ltd
- 11.1.4.1. Company Overview
- 11.1.4.2. Products
- 11.1.4.3. Company Financials
- 11.1.4.4. SWOT Analysis
- 11.1.5 KonecranesOyj
- 11.1.5.1. Company Overview
- 11.1.5.2. Products
- 11.1.5.3. Company Financials
- 11.1.5.4. SWOT Analysis
- 11.1.6 Cavote
- 11.1.6.1. Company Overview
- 11.1.6.2. Products
- 11.1.6.3. Company Financials
- 11.1.6.4. SWOT Analysis
- 11.1.7 TTS Group
- 11.1.7.1. Company Overview
- 11.1.7.2. Products
- 11.1.7.3. Company Financials
- 11.1.7.4. SWOT Analysis
- 11.1.8 Kalmar
- 11.1.8.1. Company Overview
- 11.1.8.2. Products
- 11.1.8.3. Company Financials
- 11.1.8.4. SWOT Analysis
- 11.1.9 CVS Ferrari
- 11.1.9.1. Company Overview
- 11.1.9.2. Products
- 11.1.9.3. Company Financials
- 11.1.9.4. SWOT Analysis
- 11.1.10 Hyster-Yale Group
- 11.1.10.1. Company Overview
- 11.1.10.2. Products
- 11.1.10.3. Company Financials
- 11.1.10.4. SWOT Analysis
- 11.1.1 ABB Ltd
- 11.2. Market Entropy
- 11.2.1 Company's Key Areas Served
- 11.2.2 Recent Developments
- 11.3. Company Market Share Analysis 2025
- 11.3.1 Top 5 Companies Market Share Analysis
- 11.3.2 Top 3 Companies Market Share Analysis
- 11.4. List of Potential Customers
- 12. Research Methodology
List of Figures
- Figure 1: Global Port Equipment Market Revenue Breakdown (billion, %) by Region 2025 & 2033
- Figure 2: North America Port Equipment Market Revenue (billion), by Equipment Type 2025 & 2033
- Figure 3: North America Port Equipment Market Revenue Share (%), by Equipment Type 2025 & 2033
- Figure 4: North America Port Equipment Market Revenue (billion), by Application 2025 & 2033
- Figure 5: North America Port Equipment Market Revenue Share (%), by Application 2025 & 2033
- Figure 6: North America Port Equipment Market Revenue (billion), by Fuel Type 2025 & 2033
- Figure 7: North America Port Equipment Market Revenue Share (%), by Fuel Type 2025 & 2033
- Figure 8: North America Port Equipment Market Revenue (billion), by Country 2025 & 2033
- Figure 9: North America Port Equipment Market Revenue Share (%), by Country 2025 & 2033
- Figure 10: Europe Port Equipment Market Revenue (billion), by Equipment Type 2025 & 2033
- Figure 11: Europe Port Equipment Market Revenue Share (%), by Equipment Type 2025 & 2033
- Figure 12: Europe Port Equipment Market Revenue (billion), by Application 2025 & 2033
- Figure 13: Europe Port Equipment Market Revenue Share (%), by Application 2025 & 2033
- Figure 14: Europe Port Equipment Market Revenue (billion), by Fuel Type 2025 & 2033
- Figure 15: Europe Port Equipment Market Revenue Share (%), by Fuel Type 2025 & 2033
- Figure 16: Europe Port Equipment Market Revenue (billion), by Country 2025 & 2033
- Figure 17: Europe Port Equipment Market Revenue Share (%), by Country 2025 & 2033
- Figure 18: Asia Pacific Port Equipment Market Revenue (billion), by Equipment Type 2025 & 2033
- Figure 19: Asia Pacific Port Equipment Market Revenue Share (%), by Equipment Type 2025 & 2033
- Figure 20: Asia Pacific Port Equipment Market Revenue (billion), by Application 2025 & 2033
- Figure 21: Asia Pacific Port Equipment Market Revenue Share (%), by Application 2025 & 2033
- Figure 22: Asia Pacific Port Equipment Market Revenue (billion), by Fuel Type 2025 & 2033
- Figure 23: Asia Pacific Port Equipment Market Revenue Share (%), by Fuel Type 2025 & 2033
- Figure 24: Asia Pacific Port Equipment Market Revenue (billion), by Country 2025 & 2033
- Figure 25: Asia Pacific Port Equipment Market Revenue Share (%), by Country 2025 & 2033
- Figure 26: Rest of the World Port Equipment Market Revenue (billion), by Equipment Type 2025 & 2033
- Figure 27: Rest of the World Port Equipment Market Revenue Share (%), by Equipment Type 2025 & 2033
- Figure 28: Rest of the World Port Equipment Market Revenue (billion), by Application 2025 & 2033
- Figure 29: Rest of the World Port Equipment Market Revenue Share (%), by Application 2025 & 2033
- Figure 30: Rest of the World Port Equipment Market Revenue (billion), by Fuel Type 2025 & 2033
- Figure 31: Rest of the World Port Equipment Market Revenue Share (%), by Fuel Type 2025 & 2033
- Figure 32: Rest of the World Port Equipment Market Revenue (billion), by Country 2025 & 2033
- Figure 33: Rest of the World Port Equipment Market Revenue Share (%), by Country 2025 & 2033
List of Tables
- Table 1: Global Port Equipment Market Revenue billion Forecast, by Equipment Type 2020 & 2033
- Table 2: Global Port Equipment Market Revenue billion Forecast, by Application 2020 & 2033
- Table 3: Global Port Equipment Market Revenue billion Forecast, by Fuel Type 2020 & 2033
- Table 4: Global Port Equipment Market Revenue billion Forecast, by Region 2020 & 2033
- Table 5: Global Port Equipment Market Revenue billion Forecast, by Equipment Type 2020 & 2033
- Table 6: Global Port Equipment Market Revenue billion Forecast, by Application 2020 & 2033
- Table 7: Global Port Equipment Market Revenue billion Forecast, by Fuel Type 2020 & 2033
- Table 8: Global Port Equipment Market Revenue billion Forecast, by Country 2020 & 2033
- Table 9: United States Port Equipment Market Revenue (billion) Forecast, by Application 2020 & 2033
- Table 10: Canada Port Equipment Market Revenue (billion) Forecast, by Application 2020 & 2033
- Table 11: Rest of North America Port Equipment Market Revenue (billion) Forecast, by Application 2020 & 2033
- Table 12: Global Port Equipment Market Revenue billion Forecast, by Equipment Type 2020 & 2033
- Table 13: Global Port Equipment Market Revenue billion Forecast, by Application 2020 & 2033
- Table 14: Global Port Equipment Market Revenue billion Forecast, by Fuel Type 2020 & 2033
- Table 15: Global Port Equipment Market Revenue billion Forecast, by Country 2020 & 2033
- Table 16: Germany Port Equipment Market Revenue (billion) Forecast, by Application 2020 & 2033
- Table 17: United Kingdom Port Equipment Market Revenue (billion) Forecast, by Application 2020 & 2033
- Table 18: France Port Equipment Market Revenue (billion) Forecast, by Application 2020 & 2033
- Table 19: Rest of Europe Port Equipment Market Revenue (billion) Forecast, by Application 2020 & 2033
- Table 20: Global Port Equipment Market Revenue billion Forecast, by Equipment Type 2020 & 2033
- Table 21: Global Port Equipment Market Revenue billion Forecast, by Application 2020 & 2033
- Table 22: Global Port Equipment Market Revenue billion Forecast, by Fuel Type 2020 & 2033
- Table 23: Global Port Equipment Market Revenue billion Forecast, by Country 2020 & 2033
- Table 24: India Port Equipment Market Revenue (billion) Forecast, by Application 2020 & 2033
- Table 25: China Port Equipment Market Revenue (billion) Forecast, by Application 2020 & 2033
- Table 26: Japan Port Equipment Market Revenue (billion) Forecast, by Application 2020 & 2033
- Table 27: South Korea Port Equipment Market Revenue (billion) Forecast, by Application 2020 & 2033
- Table 28: Rest of Asia Pacific Port Equipment Market Revenue (billion) Forecast, by Application 2020 & 2033
- Table 29: Global Port Equipment Market Revenue billion Forecast, by Equipment Type 2020 & 2033
- Table 30: Global Port Equipment Market Revenue billion Forecast, by Application 2020 & 2033
- Table 31: Global Port Equipment Market Revenue billion Forecast, by Fuel Type 2020 & 2033
- Table 32: Global Port Equipment Market Revenue billion Forecast, by Country 2020 & 2033
- Table 33: Brazil Port Equipment Market Revenue (billion) Forecast, by Application 2020 & 2033
- Table 34: Mexico Port Equipment Market Revenue (billion) Forecast, by Application 2020 & 2033
- Table 35: United Arab Emirates Port Equipment Market Revenue (billion) Forecast, by Application 2020 & 2033
- Table 36: Other Countries Port Equipment Market Revenue (billion) Forecast, by Application 2020 & 2033
Frequently Asked Questions
1. What is the projected Compound Annual Growth Rate (CAGR) of the Port Equipment Market?
The projected CAGR is approximately 5.7%.
2. Which companies are prominent players in the Port Equipment Market?
Key companies in the market include ABB Ltd, Famur Famak S A, Liebherr Group, Sany Heavy Industry Co Ltd, KonecranesOyj, Cavote, TTS Group, Kalmar, CVS Ferrari, Hyster-Yale Group.
3. What are the main segments of the Port Equipment Market?
The market segments include Equipment Type, Application, Fuel Type.
4. Can you provide details about the market size?
The market size is estimated to be USD 20.4 billion as of 2022.
5. What are some drivers contributing to market growth?
Increasing disposable income and Low-interest rates from lenders increase the market demand.
6. What are the notable trends driving market growth?
Government Initiatives for Development of Ports are Driving the Market.
7. Are there any restraints impacting market growth?
High initial costs may obstruct the growth.
8. Can you provide examples of recent developments in the market?
N/A
9. What pricing options are available for accessing the report?
Pricing options include single-user, multi-user, and enterprise licenses priced at USD 4750, USD 5250, and USD 8750 respectively.
10. Is the market size provided in terms of value or volume?
The market size is provided in terms of value, measured in billion.
11. Are there any specific market keywords associated with the report?
Yes, the market keyword associated with the report is "Port Equipment Market," which aids in identifying and referencing the specific market segment covered.
12. How do I determine which pricing option suits my needs best?
The pricing options vary based on user requirements and access needs. Individual users may opt for single-user licenses, while businesses requiring broader access may choose multi-user or enterprise licenses for cost-effective access to the report.
13. Are there any additional resources or data provided in the Port Equipment Market report?
While the report offers comprehensive insights, it's advisable to review the specific contents or supplementary materials provided to ascertain if additional resources or data are available.
14. How can I stay updated on further developments or reports in the Port Equipment Market?
To stay informed about further developments, trends, and reports in the Port Equipment Market, consider subscribing to industry newsletters, following relevant companies and organizations, or regularly checking reputable industry news sources and publications.
Methodology
Step 1 - Identification of Relevant Samples Size from Population Database


Step 2 - Approaches for Defining Global Market Size (Value, Volume* & Price*)

Note*: In applicable scenarios
Step 3 - Data Sources
Primary Research
- Web Analytics
- Survey Reports
- Research Institute
- Latest Research Reports
- Opinion Leaders
Secondary Research
- Annual Reports
- White Paper
- Latest Press Release
- Industry Association
- Paid Database
- Investor Presentations

Step 4 - Data Triangulation
Involves using different sources of information in order to increase the validity of a study
These sources are likely to be stakeholders in a program - participants, other researchers, program staff, other community members, and so on.
Then we put all data in single framework & apply various statistical tools to find out the dynamic on the market.
During the analysis stage, feedback from the stakeholder groups would be compared to determine areas of agreement as well as areas of divergence