

Key Insights
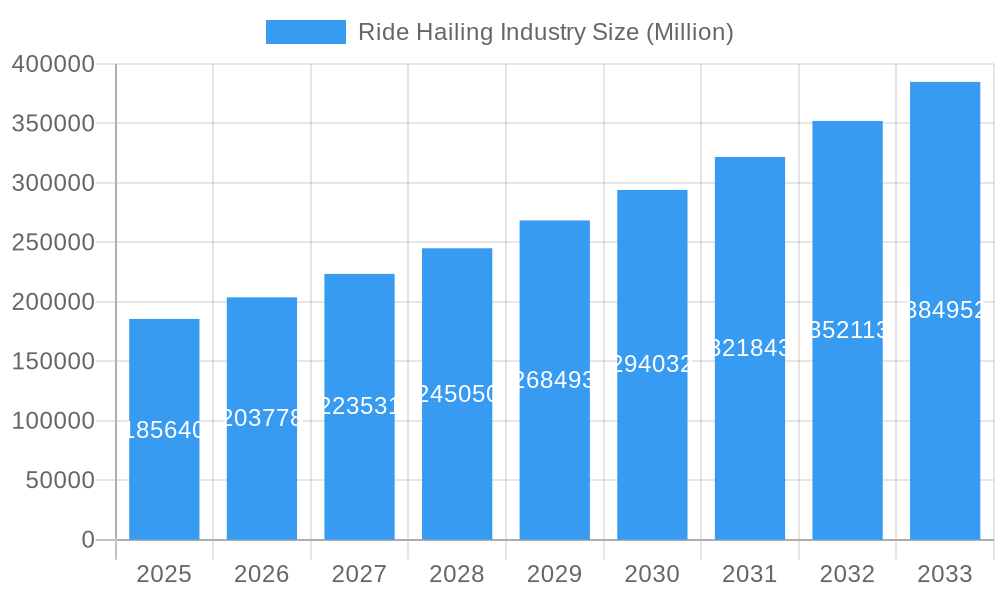
The ride-hailing industry, valued at $185.64 billion in 2025, is experiencing robust growth, projected to expand at a Compound Annual Growth Rate (CAGR) of 9.64% from 2025 to 2033. This expansion is fueled by several key factors. Increasing urbanization and population density in major global cities create a significant demand for convenient and efficient transportation alternatives. Technological advancements, such as improved ride-matching algorithms, in-app payment systems, and the integration of GPS technology, continue to enhance the user experience and drive adoption. The rise of electric vehicles (EVs) within the ride-hailing sector is a significant trend, driven by environmental concerns and government incentives promoting sustainable transportation. This shift presents opportunities for ride-hailing companies to showcase their commitment to environmental responsibility and attract environmentally conscious customers. However, regulatory hurdles, fluctuating fuel prices (impacting ICE vehicle operations), and intense competition among established players and emerging entrants pose significant challenges. The industry's segmentation by vehicle type (motorcycles, cars, vans, buses) and propulsion type (ICE, electric) reflects diverse market needs and evolving consumer preferences. Geographical variations in market penetration are also significant, with North America and Asia Pacific expected to remain dominant regions due to high smartphone penetration and robust tech infrastructure.
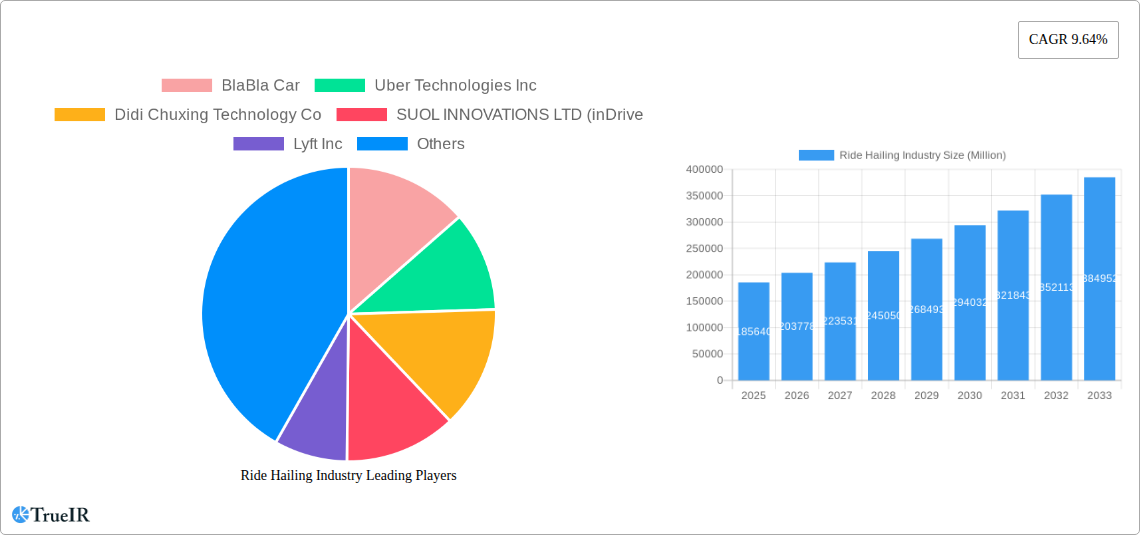
Ride Hailing Industry Market Size (In Billion)
The competitive landscape is intensely dynamic, featuring global giants like Uber and Didi Chuxing alongside regional players such as Ola and Grab. Success will increasingly depend on companies’ ability to innovate, adapt to evolving regulatory frameworks, optimize operational efficiency, and effectively manage driver relations. Strategies focused on offering diverse service options, expanding into new markets, and leveraging data analytics for improved service quality and pricing will be crucial for sustained growth and profitability. The industry's future trajectory will be significantly shaped by its response to environmental concerns, technological advancements, and evolving consumer expectations regarding safety, affordability, and convenience. The continued growth in demand, coupled with strategic adaptations to these market forces, suggests a positive outlook for the ride-hailing industry over the forecast period.
Ride Hailing Industry Company Market Share
Ride-Hailing Industry Market Report: 2019-2033
This comprehensive report provides a detailed analysis of the global ride-hailing industry, encompassing market size, competitive landscape, key trends, and future outlook from 2019 to 2033. With a focus on key players like Uber, Didi, and Lyft, this report is essential for investors, industry professionals, and anyone seeking to understand this rapidly evolving sector. The report leverages extensive data and analysis to forecast a market exceeding $XX Million by 2033.
Ride Hailing Industry Market Structure & Competitive Landscape
The global ride-hailing market is characterized by a concentrated yet dynamic competitive landscape. A few major players, including Uber Technologies Inc., Didi Chuxing Technology Co., and Lyft Inc., command significant market share, resulting in a high concentration ratio of approximately xx%. However, regional players like Grab Holdings Inc. and inDrive (SUOL INNOVATIONS LTD) exert considerable influence in their respective territories. Innovation is a crucial driver, with companies constantly investing in technological advancements such as autonomous vehicles and improved ride-matching algorithms. Regulatory frameworks vary significantly across regions, impacting operational costs and market access. Existing public transport systems and alternative personal transportation options act as key product substitutes. The end-user market is segmented broadly by demographics (age, income), travel needs (commuting, leisure), and technological adoption.
- Market Concentration: High, with a few dominant players.
- Innovation Drivers: Autonomous driving technology, AI-powered ride matching, and enhanced user experience.
- Regulatory Impacts: Vary widely across geographies, affecting operational costs and profitability.
- Product Substitutes: Public transport, personal vehicles, bike sharing, and other micro-mobility services.
- End-User Segmentation: Demographics (age, income), travel needs, and technological adoption.
- M&A Trends: A moderate number of mergers and acquisitions (M&A) have occurred historically, with a total transaction value of approximately $xx Million during the period 2019-2024. This trend is expected to continue but at a varied pace throughout the forecast period.
Ride Hailing Industry Market Trends & Opportunities
The ride-hailing market exhibits significant growth, fueled by increasing urbanization, rising disposable incomes, and the convenience offered by mobile apps. The historical period (2019-2024) saw a Compound Annual Growth Rate (CAGR) of xx%, with the market size reaching $xx Million in 2024. The projected CAGR for the forecast period (2025-2033) is xx%, leading to an estimated market value of over $xx Million by 2033. Technological advancements like autonomous vehicles and electric vehicles are reshaping the industry, creating opportunities for both established and new entrants. Consumer preferences are shifting towards greater safety, affordability, and sustainability, impacting the adoption of different vehicle types and propulsion methods. Competitive dynamics are characterized by aggressive pricing strategies, expansion into new markets, and strategic partnerships. Market penetration rates are increasing steadily, particularly in developing economies with rapidly expanding middle classes.
Dominant Markets & Segments in Ride Hailing Industry
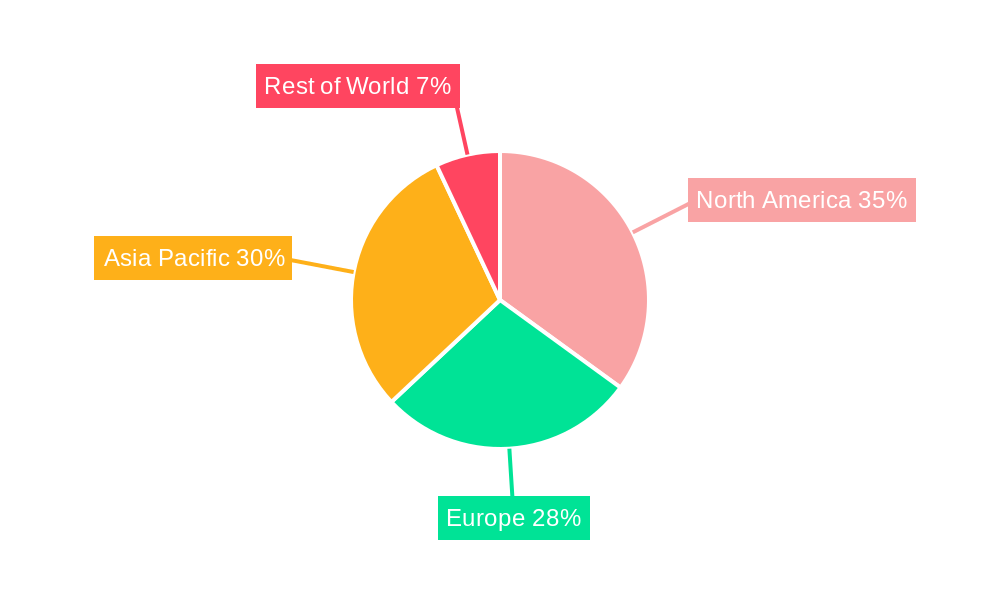
The Asia-Pacific region currently dominates the global ride-hailing market, driven by factors such as high population density, increasing smartphone penetration, and the rapid growth of urban centers. Within this region, countries like India and China are leading the way. However, North America and Europe also represent substantial markets.
By Vehicle Type:
- Cars: This segment currently holds the largest market share due to its versatility and widespread availability.
- Motorcycles: This is a significant segment in densely populated areas and emerging markets, offering affordability and maneuverability.
- Vans & Buses: This segment caters to larger groups and is experiencing growth in both urban and suburban areas. Growth is driven by corporate travel and airport transfers.
By Propulsion Type:
- Internal Combustion Engine (ICE): This remains the dominant propulsion type, due to its established infrastructure and cost-effectiveness.
- Electric: This segment is experiencing rapid growth, driven by environmental concerns and government incentives. Infrastructure development, specifically charging stations, remains a key growth driver.
Key Growth Drivers:
- Increasing Urbanization: The shift of population towards urban centers is increasing the demand for transportation solutions.
- Smartphone Penetration: High smartphone ownership facilitates easy access and adoption of ride-hailing apps.
- Technological Advancements: Autonomous driving and electric vehicle technologies are transforming the industry.
- Government Regulations: Favorable regulations and incentives are boosting market growth, particularly for electric vehicles.
Ride Hailing Industry Product Analysis
Ride-hailing services are evolving beyond basic transportation, integrating features such as ride-sharing, carpooling, and specialized services for delivery and logistics. Technological advancements, including AI-powered ride matching, real-time tracking, and in-app payment systems, provide competitive advantages and enhance the customer experience. The integration of electric vehicles and autonomous technology represents a significant opportunity to improve sustainability and efficiency. The success of ride-hailing apps hinges on their ability to match riders and drivers efficiently, provide secure and reliable transportation, and offer competitive pricing.
Key Drivers, Barriers & Challenges in Ride Hailing Industry
Key Drivers:
- Technological advancements: AI, autonomous vehicles, and electric vehicle adoption are increasing efficiency and sustainability.
- Economic growth: Rising disposable incomes in emerging economies fuel demand for convenient transportation.
- Favorable regulations: Governments are increasingly supporting the industry through licensing and infrastructure investments.
Key Challenges & Restraints:
- Regulatory hurdles: Varying regulations across different regions create operational complexities and compliance costs. These costs can reach xx Million annually for major players.
- Supply chain disruptions: Dependence on vehicle manufacturing and maintenance affects operations, particularly in times of shortages.
- Intense competition: Price wars and aggressive expansion strategies from established and emerging players put pressure on profitability.
Growth Drivers in the Ride Hailing Industry Market
The ride-hailing market is propelled by technological advancements, increasing urbanization, and supportive government policies. The development of autonomous vehicle technology promises to revolutionize the industry, while electric vehicles offer a pathway towards sustainability. Favorable economic conditions in several regions contribute to increased disposable incomes and higher consumer spending on transportation services.
Challenges Impacting Ride Hailing Industry Growth
Significant challenges include regulatory hurdles, such as licensing requirements and safety regulations. These can vary widely across regions, creating operational complexity and cost increases for companies. Supply chain issues can disrupt service delivery and increase operational costs. Furthermore, intense competition, particularly from established players, exerts downward pressure on pricing and profitability.
Key Players Shaping the Ride Hailing Industry Market
Significant Ride Hailing Industry Industry Milestones
- December 2023: TH International Limited partners with Didi Chuxing for a brand-building campaign.
- March 2024: Waymo launches its free ride-hailing service, Waymo One, in Los Angeles.
- April 2024: The Japanese government permits the use of private ride-hailing services via mobile apps.
Future Outlook for Ride Hailing Industry Market
The future of the ride-hailing industry is promising, driven by technological advancements, expanding urban populations, and increasing consumer demand. Strategic opportunities lie in the adoption of autonomous vehicles, electric fleets, and the integration of services with other mobility solutions. The market's potential for growth is substantial, especially in developing economies, creating lucrative prospects for both established players and innovative newcomers.
Ride Hailing Industry Segmentation
-
1. Vehicle Type
- 1.1. Motorcycles
- 1.2. Cars
- 1.3. Vans
- 1.4. Buses
-
2. Propulsion Type
- 2.1. Internal Combustion Engine (ICE)
- 2.2. Electric
Ride Hailing Industry Segmentation By Geography
-
1. North America
- 1.1. United States
- 1.2. Canada
- 1.3. Rest of North America
-
2. Europe
- 2.1. Germany
- 2.2. United Kingdom
- 2.3. France
- 2.4. Italy
- 2.5. Rest of Europe
-
3. Asia Pacific
- 3.1. China
- 3.2. India
- 3.3. Japan
- 3.4. South Korea
- 3.5. Rest of Asia Pacific
-
4. Rest of the World
- 4.1. South America
- 4.2. Middle East and Africa
Ride Hailing Industry Regional Market Share
Geographic Coverage of Ride Hailing Industry
Ride Hailing Industry REPORT HIGHLIGHTS
| Aspects | Details |
|---|---|
| Study Period | 2020-2034 |
| Base Year | 2025 |
| Estimated Year | 2026 |
| Forecast Period | 2026-2034 |
| Historical Period | 2020-2025 |
| Growth Rate | CAGR of 9.64% from 2020-2034 |
| Segmentation |
|
Table of Contents
- 1. Introduction
- 1.1. Research Scope
- 1.2. Market Segmentation
- 1.3. Research Objective
- 1.4. Definitions and Assumptions
- 2. Executive Summary
- 2.1. Market Snapshot
- 3. Market Dynamics
- 3.1. Market Drivers
- 3.2. Market Restrains
- 3.3. Market Trends
- 3.4. Market Opportunities
- 4. Market Factor Analysis
- 4.1. Porters Five Forces
- 4.1.1. Bargaining Power of Suppliers
- 4.1.2. Bargaining Power of Buyers
- 4.1.3. Threat of New Entrants
- 4.1.4. Threat of Substitutes
- 4.1.5. Competitive Rivalry
- 4.2. PESTEL analysis
- 4.3. BCG Analysis
- 4.3.1. Stars (High Growth, High Market Share)
- 4.3.2. Cash Cows (Low Growth, High Market Share)
- 4.3.3. Question Mark (High Growth, Low Market Share)
- 4.3.4. Dogs (Low Growth, Low Market Share)
- 4.4. Ansoff Matrix Analysis
- 4.5. Supply Chain Analysis
- 4.6. Regulatory Landscape
- 4.7. Current Market Potential and Opportunity Assessment (TAM–SAM–SOM Framework)
- 4.8. TIR Analyst Note
- 4.1. Porters Five Forces
- 5. Market Analysis, Insights and Forecast 2021-2033
- 5.1. Market Analysis, Insights and Forecast - by Vehicle Type
- 5.1.1. Motorcycles
- 5.1.2. Cars
- 5.1.3. Vans
- 5.1.4. Buses
- 5.2. Market Analysis, Insights and Forecast - by Propulsion Type
- 5.2.1. Internal Combustion Engine (ICE)
- 5.2.2. Electric
- 5.3. Market Analysis, Insights and Forecast - by Region
- 5.3.1. North America
- 5.3.2. Europe
- 5.3.3. Asia Pacific
- 5.3.4. Rest of the World
- 5.1. Market Analysis, Insights and Forecast - by Vehicle Type
- 6. Global Ride Hailing Industry Analysis, Insights and Forecast, 2021-2033
- 6.1. Market Analysis, Insights and Forecast - by Vehicle Type
- 6.1.1. Motorcycles
- 6.1.2. Cars
- 6.1.3. Vans
- 6.1.4. Buses
- 6.2. Market Analysis, Insights and Forecast - by Propulsion Type
- 6.2.1. Internal Combustion Engine (ICE)
- 6.2.2. Electric
- 6.1. Market Analysis, Insights and Forecast - by Vehicle Type
- 7. North America Ride Hailing Industry Analysis, Insights and Forecast, 2020-2032
- 7.1. Market Analysis, Insights and Forecast - by Vehicle Type
- 7.1.1. Motorcycles
- 7.1.2. Cars
- 7.1.3. Vans
- 7.1.4. Buses
- 7.2. Market Analysis, Insights and Forecast - by Propulsion Type
- 7.2.1. Internal Combustion Engine (ICE)
- 7.2.2. Electric
- 7.1. Market Analysis, Insights and Forecast - by Vehicle Type
- 8. Europe Ride Hailing Industry Analysis, Insights and Forecast, 2020-2032
- 8.1. Market Analysis, Insights and Forecast - by Vehicle Type
- 8.1.1. Motorcycles
- 8.1.2. Cars
- 8.1.3. Vans
- 8.1.4. Buses
- 8.2. Market Analysis, Insights and Forecast - by Propulsion Type
- 8.2.1. Internal Combustion Engine (ICE)
- 8.2.2. Electric
- 8.1. Market Analysis, Insights and Forecast - by Vehicle Type
- 9. Asia Pacific Ride Hailing Industry Analysis, Insights and Forecast, 2020-2032
- 9.1. Market Analysis, Insights and Forecast - by Vehicle Type
- 9.1.1. Motorcycles
- 9.1.2. Cars
- 9.1.3. Vans
- 9.1.4. Buses
- 9.2. Market Analysis, Insights and Forecast - by Propulsion Type
- 9.2.1. Internal Combustion Engine (ICE)
- 9.2.2. Electric
- 9.1. Market Analysis, Insights and Forecast - by Vehicle Type
- 10. Rest of the World Ride Hailing Industry Analysis, Insights and Forecast, 2020-2032
- 10.1. Market Analysis, Insights and Forecast - by Vehicle Type
- 10.1.1. Motorcycles
- 10.1.2. Cars
- 10.1.3. Vans
- 10.1.4. Buses
- 10.2. Market Analysis, Insights and Forecast - by Propulsion Type
- 10.2.1. Internal Combustion Engine (ICE)
- 10.2.2. Electric
- 10.1. Market Analysis, Insights and Forecast - by Vehicle Type
- 11. Competitive Analysis
- 11.1. Company Profiles
- 11.1.1 BlaBla Car
- 11.1.1.1. Company Overview
- 11.1.1.2. Products
- 11.1.1.3. Company Financials
- 11.1.1.4. SWOT Analysis
- 11.1.2 Uber Technologies Inc
- 11.1.2.1. Company Overview
- 11.1.2.2. Products
- 11.1.2.3. Company Financials
- 11.1.2.4. SWOT Analysis
- 11.1.3 Didi Chuxing Technology Co
- 11.1.3.1. Company Overview
- 11.1.3.2. Products
- 11.1.3.3. Company Financials
- 11.1.3.4. SWOT Analysis
- 11.1.4 SUOL INNOVATIONS LTD (inDrive
- 11.1.4.1. Company Overview
- 11.1.4.2. Products
- 11.1.4.3. Company Financials
- 11.1.4.4. SWOT Analysis
- 11.1.5 Lyft Inc
- 11.1.5.1. Company Overview
- 11.1.5.2. Products
- 11.1.5.3. Company Financials
- 11.1.5.4. SWOT Analysis
- 11.1.6 Ani Technologies Pvt Ltd (OLA)
- 11.1.6.1. Company Overview
- 11.1.6.2. Products
- 11.1.6.3. Company Financials
- 11.1.6.4. SWOT Analysis
- 11.1.7 Gett Group
- 11.1.7.1. Company Overview
- 11.1.7.2. Products
- 11.1.7.3. Company Financials
- 11.1.7.4. SWOT Analysis
- 11.1.8 Bolt Technology OU
- 11.1.8.1. Company Overview
- 11.1.8.2. Products
- 11.1.8.3. Company Financials
- 11.1.8.4. SWOT Analysis
- 11.1.9 Maxi Mobility SL (Cabify)
- 11.1.9.1. Company Overview
- 11.1.9.2. Products
- 11.1.9.3. Company Financials
- 11.1.9.4. SWOT Analysis
- 11.1.10 GoTo Group (GoJek)
- 11.1.10.1. Company Overview
- 11.1.10.2. Products
- 11.1.10.3. Company Financials
- 11.1.10.4. SWOT Analysis
- 11.1.11 Xanh SM (GSM)
- 11.1.11.1. Company Overview
- 11.1.11.2. Products
- 11.1.11.3. Company Financials
- 11.1.11.4. SWOT Analysis
- 11.1.12 Grab Holdings Inc
- 11.1.12.1. Company Overview
- 11.1.12.2. Products
- 11.1.12.3. Company Financials
- 11.1.12.4. SWOT Analysis
- 11.1.1 BlaBla Car
- 11.2. Market Entropy
- 11.2.1 Company's Key Areas Served
- 11.2.2 Recent Developments
- 11.3. Company Market Share Analysis 2025
- 11.3.1 Top 5 Companies Market Share Analysis
- 11.3.2 Top 3 Companies Market Share Analysis
- 11.4. List of Potential Customers
- 12. Research Methodology
List of Figures
- Figure 1: Global Ride Hailing Industry Revenue Breakdown (Million, %) by Region 2025 & 2033
- Figure 2: North America Ride Hailing Industry Revenue (Million), by Vehicle Type 2025 & 2033
- Figure 3: North America Ride Hailing Industry Revenue Share (%), by Vehicle Type 2025 & 2033
- Figure 4: North America Ride Hailing Industry Revenue (Million), by Propulsion Type 2025 & 2033
- Figure 5: North America Ride Hailing Industry Revenue Share (%), by Propulsion Type 2025 & 2033
- Figure 6: North America Ride Hailing Industry Revenue (Million), by Country 2025 & 2033
- Figure 7: North America Ride Hailing Industry Revenue Share (%), by Country 2025 & 2033
- Figure 8: Europe Ride Hailing Industry Revenue (Million), by Vehicle Type 2025 & 2033
- Figure 9: Europe Ride Hailing Industry Revenue Share (%), by Vehicle Type 2025 & 2033
- Figure 10: Europe Ride Hailing Industry Revenue (Million), by Propulsion Type 2025 & 2033
- Figure 11: Europe Ride Hailing Industry Revenue Share (%), by Propulsion Type 2025 & 2033
- Figure 12: Europe Ride Hailing Industry Revenue (Million), by Country 2025 & 2033
- Figure 13: Europe Ride Hailing Industry Revenue Share (%), by Country 2025 & 2033
- Figure 14: Asia Pacific Ride Hailing Industry Revenue (Million), by Vehicle Type 2025 & 2033
- Figure 15: Asia Pacific Ride Hailing Industry Revenue Share (%), by Vehicle Type 2025 & 2033
- Figure 16: Asia Pacific Ride Hailing Industry Revenue (Million), by Propulsion Type 2025 & 2033
- Figure 17: Asia Pacific Ride Hailing Industry Revenue Share (%), by Propulsion Type 2025 & 2033
- Figure 18: Asia Pacific Ride Hailing Industry Revenue (Million), by Country 2025 & 2033
- Figure 19: Asia Pacific Ride Hailing Industry Revenue Share (%), by Country 2025 & 2033
- Figure 20: Rest of the World Ride Hailing Industry Revenue (Million), by Vehicle Type 2025 & 2033
- Figure 21: Rest of the World Ride Hailing Industry Revenue Share (%), by Vehicle Type 2025 & 2033
- Figure 22: Rest of the World Ride Hailing Industry Revenue (Million), by Propulsion Type 2025 & 2033
- Figure 23: Rest of the World Ride Hailing Industry Revenue Share (%), by Propulsion Type 2025 & 2033
- Figure 24: Rest of the World Ride Hailing Industry Revenue (Million), by Country 2025 & 2033
- Figure 25: Rest of the World Ride Hailing Industry Revenue Share (%), by Country 2025 & 2033
List of Tables
- Table 1: Global Ride Hailing Industry Revenue Million Forecast, by Vehicle Type 2020 & 2033
- Table 2: Global Ride Hailing Industry Revenue Million Forecast, by Propulsion Type 2020 & 2033
- Table 3: Global Ride Hailing Industry Revenue Million Forecast, by Region 2020 & 2033
- Table 4: Global Ride Hailing Industry Revenue Million Forecast, by Vehicle Type 2020 & 2033
- Table 5: Global Ride Hailing Industry Revenue Million Forecast, by Propulsion Type 2020 & 2033
- Table 6: Global Ride Hailing Industry Revenue Million Forecast, by Country 2020 & 2033
- Table 7: United States Ride Hailing Industry Revenue (Million) Forecast, by Application 2020 & 2033
- Table 8: Canada Ride Hailing Industry Revenue (Million) Forecast, by Application 2020 & 2033
- Table 9: Rest of North America Ride Hailing Industry Revenue (Million) Forecast, by Application 2020 & 2033
- Table 10: Global Ride Hailing Industry Revenue Million Forecast, by Vehicle Type 2020 & 2033
- Table 11: Global Ride Hailing Industry Revenue Million Forecast, by Propulsion Type 2020 & 2033
- Table 12: Global Ride Hailing Industry Revenue Million Forecast, by Country 2020 & 2033
- Table 13: Germany Ride Hailing Industry Revenue (Million) Forecast, by Application 2020 & 2033
- Table 14: United Kingdom Ride Hailing Industry Revenue (Million) Forecast, by Application 2020 & 2033
- Table 15: France Ride Hailing Industry Revenue (Million) Forecast, by Application 2020 & 2033
- Table 16: Italy Ride Hailing Industry Revenue (Million) Forecast, by Application 2020 & 2033
- Table 17: Rest of Europe Ride Hailing Industry Revenue (Million) Forecast, by Application 2020 & 2033
- Table 18: Global Ride Hailing Industry Revenue Million Forecast, by Vehicle Type 2020 & 2033
- Table 19: Global Ride Hailing Industry Revenue Million Forecast, by Propulsion Type 2020 & 2033
- Table 20: Global Ride Hailing Industry Revenue Million Forecast, by Country 2020 & 2033
- Table 21: China Ride Hailing Industry Revenue (Million) Forecast, by Application 2020 & 2033
- Table 22: India Ride Hailing Industry Revenue (Million) Forecast, by Application 2020 & 2033
- Table 23: Japan Ride Hailing Industry Revenue (Million) Forecast, by Application 2020 & 2033
- Table 24: South Korea Ride Hailing Industry Revenue (Million) Forecast, by Application 2020 & 2033
- Table 25: Rest of Asia Pacific Ride Hailing Industry Revenue (Million) Forecast, by Application 2020 & 2033
- Table 26: Global Ride Hailing Industry Revenue Million Forecast, by Vehicle Type 2020 & 2033
- Table 27: Global Ride Hailing Industry Revenue Million Forecast, by Propulsion Type 2020 & 2033
- Table 28: Global Ride Hailing Industry Revenue Million Forecast, by Country 2020 & 2033
- Table 29: South America Ride Hailing Industry Revenue (Million) Forecast, by Application 2020 & 2033
- Table 30: Middle East and Africa Ride Hailing Industry Revenue (Million) Forecast, by Application 2020 & 2033
Frequently Asked Questions
1. What is the projected Compound Annual Growth Rate (CAGR) of the Ride Hailing Industry?
The projected CAGR is approximately 9.64%.
2. Which companies are prominent players in the Ride Hailing Industry?
Key companies in the market include BlaBla Car, Uber Technologies Inc, Didi Chuxing Technology Co, SUOL INNOVATIONS LTD (inDrive, Lyft Inc, Ani Technologies Pvt Ltd (OLA), Gett Group, Bolt Technology OU, Maxi Mobility SL (Cabify), GoTo Group (GoJek), Xanh SM (GSM), Grab Holdings Inc.
3. What are the main segments of the Ride Hailing Industry?
The market segments include Vehicle Type, Propulsion Type.
4. Can you provide details about the market size?
The market size is estimated to be USD 185.64 Million as of 2022.
5. What are some drivers contributing to market growth?
Rising Traffic Congestion and Increasing Urban Population to Foster Market Growth.
6. What are the notable trends driving market growth?
The Cars Segment is Expected to Gain Traction During the Forecast Period.
7. Are there any restraints impacting market growth?
Strict Government Regulations and Policies Toward Ride-hailing Services Impact the Market Growth.
8. Can you provide examples of recent developments in the market?
April 2024: The Japanese government implemented the use of private ride-hailing services, which are accessible through mobile applications such as Uber and Go.
9. What pricing options are available for accessing the report?
Pricing options include single-user, multi-user, and enterprise licenses priced at USD 4750, USD 5250, and USD 8750 respectively.
10. Is the market size provided in terms of value or volume?
The market size is provided in terms of value, measured in Million.
11. Are there any specific market keywords associated with the report?
Yes, the market keyword associated with the report is "Ride Hailing Industry," which aids in identifying and referencing the specific market segment covered.
12. How do I determine which pricing option suits my needs best?
The pricing options vary based on user requirements and access needs. Individual users may opt for single-user licenses, while businesses requiring broader access may choose multi-user or enterprise licenses for cost-effective access to the report.
13. Are there any additional resources or data provided in the Ride Hailing Industry report?
While the report offers comprehensive insights, it's advisable to review the specific contents or supplementary materials provided to ascertain if additional resources or data are available.
14. How can I stay updated on further developments or reports in the Ride Hailing Industry?
To stay informed about further developments, trends, and reports in the Ride Hailing Industry, consider subscribing to industry newsletters, following relevant companies and organizations, or regularly checking reputable industry news sources and publications.
Methodology
Step 1 - Identification of Relevant Samples Size from Population Database


Step 2 - Approaches for Defining Global Market Size (Value, Volume* & Price*)

Note*: In applicable scenarios
Step 3 - Data Sources
Primary Research
- Web Analytics
- Survey Reports
- Research Institute
- Latest Research Reports
- Opinion Leaders
Secondary Research
- Annual Reports
- White Paper
- Latest Press Release
- Industry Association
- Paid Database
- Investor Presentations

Step 4 - Data Triangulation
Involves using different sources of information in order to increase the validity of a study
These sources are likely to be stakeholders in a program - participants, other researchers, program staff, other community members, and so on.
Then we put all data in single framework & apply various statistical tools to find out the dynamic on the market.
During the analysis stage, feedback from the stakeholder groups would be compared to determine areas of agreement as well as areas of divergence