

Key Insights
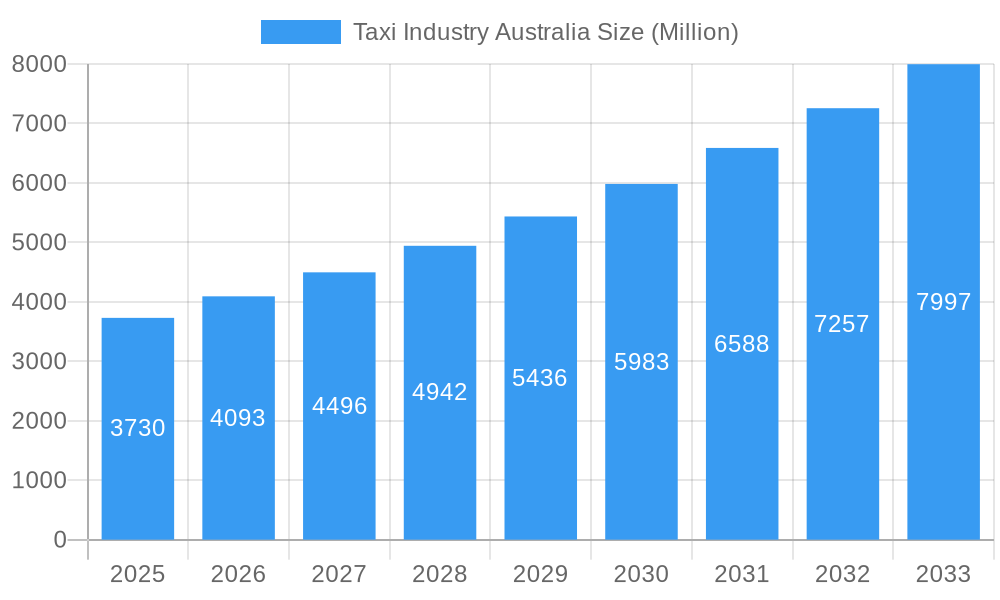
The Australian taxi industry, valued at $3.73 billion in 2025, is projected to experience robust growth, driven by a rising population, increasing urbanization, and a surge in demand for convenient and reliable transportation options. The industry's Compound Annual Growth Rate (CAGR) of 9.60% from 2025 to 2033 indicates a significant expansion of the market over the forecast period. Key growth drivers include the increasing adoption of ride-hailing apps, offering users greater choice and transparency, coupled with technological advancements improving efficiency and safety features within the sector. The segmentation of the market across service types (ride-hailing, ridesharing), booking methods (online, offline), and vehicle types (hatchbacks, sedans, SUVs/MPVs) provides various avenues for market expansion and specialization. Significant regional variations exist, with states like New South Wales, Victoria, and Queensland representing substantial market shares due to higher population densities and tourism activity. While the industry faces challenges such as stringent regulations, competition from ride-sharing services, and fluctuating fuel prices, the continued investment in technology and improved service offerings are likely to mitigate these restraints and drive future growth.
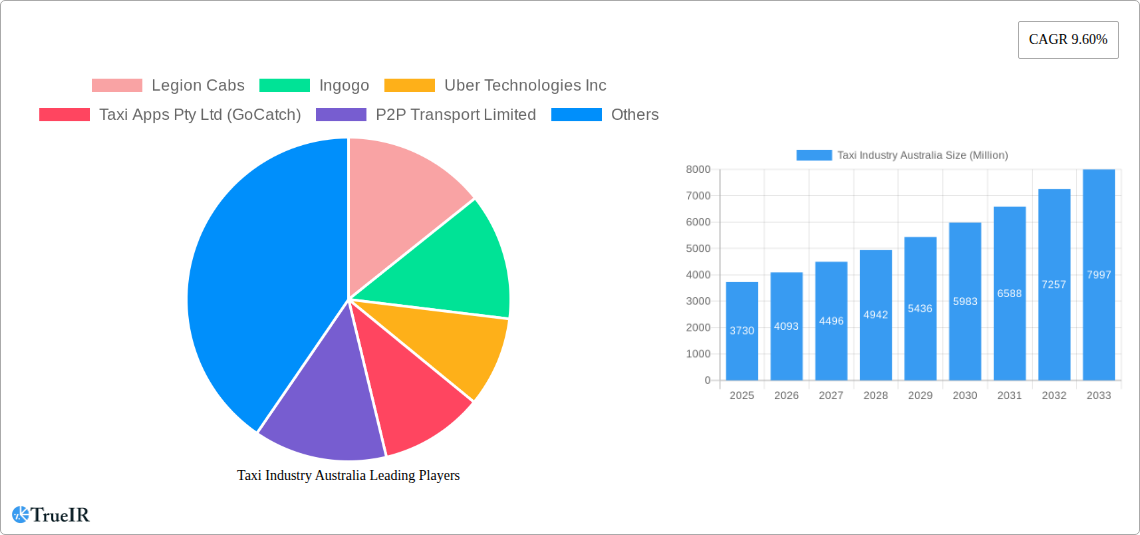
Taxi Industry Australia Market Size (In Billion)
The competitive landscape is dynamic, with both established taxi companies like Legion Cabs and GM Cabs alongside prominent ride-hailing players like Uber and Ola competing for market share. The increasing adoption of online booking platforms underscores the shift towards digitalization within the industry. The forecast period of 2025-2033 is expected to see significant consolidation and innovation as companies strive to enhance their services and capture a larger slice of the growing market. The ongoing integration of technology, such as real-time tracking, fare optimization, and advanced safety features, will be crucial in shaping the future of the Australian taxi industry. The successful companies will be those adapting quickly to changing consumer demands and technological advancements.
Taxi Industry Australia Company Market Share
Taxi Industry Australia Market Report: 2019-2033
This comprehensive report provides a detailed analysis of the Australian taxi industry, encompassing market structure, competitive dynamics, trends, and future projections from 2019 to 2033. With a focus on key players like Uber Technologies Inc, Taxi Apps Pty Ltd (GoCatch), GM Cabs, and many more, this report is an invaluable resource for investors, industry professionals, and anyone seeking to understand this dynamic sector. The report utilizes a base year of 2025 and covers the historical period (2019-2024), estimated year (2025), and forecast period (2025-2033). The total market size is projected to reach xx Million by 2033.
Taxi Industry Australia Market Structure & Competitive Landscape
The Australian taxi industry is characterized by a complex interplay of traditional taxi services and ride-hailing platforms. Market concentration is moderate, with a few dominant players like Uber holding significant market share, alongside regional players such as GM Cabs and smaller ride-sharing companies. However, the market remains fragmented, with numerous smaller operators and independent drivers.
Innovation Drivers: Technological advancements, particularly in mobile app development, GPS integration, and payment systems, are major drivers of industry innovation. The rise of electric vehicles and autonomous driving technologies promises further disruption.
Regulatory Impacts: Government regulations, including licensing, fare structures, and safety standards, significantly influence market dynamics. Changes in regulations can impact both established players and new entrants.
Product Substitutes: Public transportation, ride-sharing services (outside of dedicated taxi apps), and private car ownership represent key substitutes for traditional taxi services.
End-User Segmentation: The market caters to diverse customer segments, including commuters, tourists, business travelers, and individuals requiring transportation for special occasions. Understanding these varying needs is crucial for effective market segmentation and service customization.
M&A Trends: The industry has witnessed several mergers and acquisitions in recent years, primarily driven by efforts to consolidate market share and leverage economies of scale. The total M&A volume over the historical period (2019-2024) is estimated at xx Million.
Taxi Industry Australia Market Trends & Opportunities
The Australian taxi market is experiencing significant transformation, driven by technological advancements, evolving consumer preferences, and increased competition. The market size is projected to grow at a Compound Annual Growth Rate (CAGR) of xx% during the forecast period (2025-2033), reaching a projected xx Million by 2033. Online booking penetration is increasing steadily, driven by the convenience and transparency offered by mobile applications. This shift is impacting the traditional offline booking model. The adoption of electric vehicles is also gaining traction, driven by environmental concerns and government incentives. Furthermore, there's a growing demand for ride-sharing options, particularly among younger demographics. This competitive landscape fosters innovation and increased customer choice.
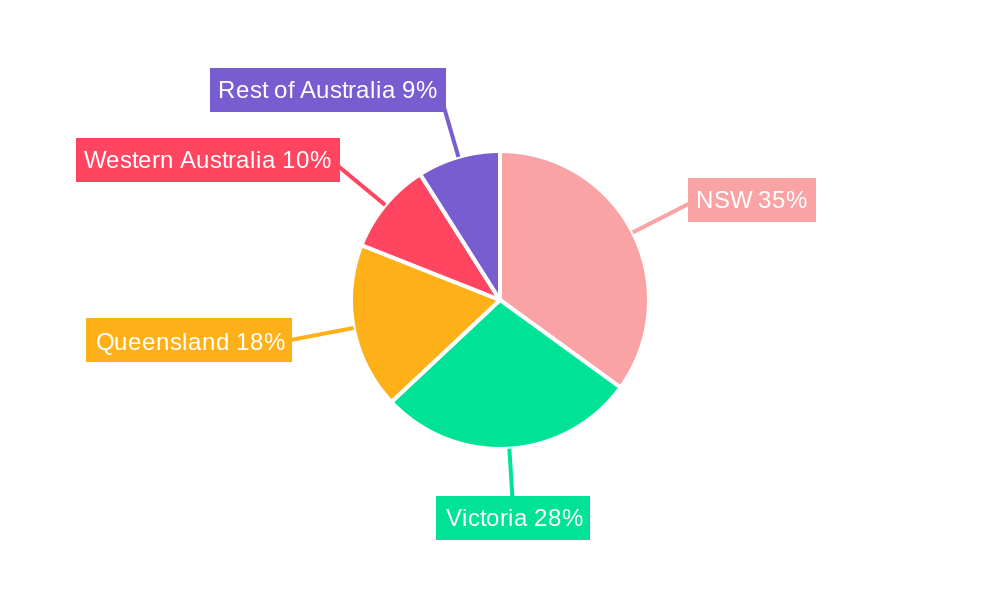
Dominant Markets & Segments in Taxi Industry Australia
New South Wales (NSW) and Victoria represent the most significant markets within Australia, holding the largest market share. This dominance is attributed to higher population density, greater economic activity, and more developed transportation infrastructure.
Key Growth Drivers:
- NSW: Strong economic activity, substantial tourism, and robust transportation infrastructure contribute to its market leadership.
- Victoria: Similar to NSW, a large population base and extensive public transportation network drive high demand.
- Ride-Hailing: This segment dominates the market due to its convenience and widespread adoption through apps such as Uber.
- Online Booking: Rapid adoption of smartphone technology has significantly increased online bookings across all service types, exceeding xx Million transactions in 2024.
- Sedans: Sedans remain the most popular vehicle type due to their balance of comfort, affordability, and availability.
Taxi Industry Australia Product Analysis
Technological innovation significantly shapes the product landscape. This includes features like real-time tracking, cashless payments, driver ratings, and enhanced safety measures. The industry is progressively integrating electric and hybrid vehicles, improving environmental sustainability. This innovation directly impacts customer satisfaction and market competitiveness. The increasing adoption of ride-sharing, through services like Uber’s Custom Electric initiative, further underscores the industry's adaptation to evolving customer preferences.
Key Drivers, Barriers & Challenges in Taxi Industry Australia
Key Drivers:
Technological advancements such as mobile apps and GPS technology have streamlined operations and improved customer experience. Government initiatives supporting electric vehicles and sustainable transportation further drive market growth. Growing urban populations and increasing demand for convenient transportation also contribute significantly.
Challenges:
Stringent regulatory frameworks and licensing requirements can pose significant barriers to entry and expansion. The intense competition from ride-sharing services puts pressure on profit margins for traditional taxi operators. Fluctuations in fuel prices and driver availability impact operational costs and service reliability. Supply chain disruptions impacting vehicle procurement are also a concern.
Growth Drivers in the Taxi Industry Australia Market
Technological innovation, particularly the development of user-friendly mobile applications and the integration of real-time tracking systems, continues to be a significant driver. Growing urban populations and rising demand for convenient and reliable transportation fuels market expansion. Government initiatives to promote sustainable transportation, coupled with the increasing adoption of electric and hybrid vehicles, contribute to long-term growth.
Challenges Impacting Taxi Industry Australia Growth
Regulatory complexities and licensing requirements impose significant hurdles for new entrants and existing operators. The intense competition from established ride-sharing services creates pressure on pricing and profitability. Driver shortages and fluctuations in fuel prices directly impact operational costs and service reliability. Supply chain disruptions can also impede growth by restricting access to new vehicles.
Key Players Shaping the Taxi Industry Australia Market
- Legion Cabs
- Ingogo
- Uber Technologies Inc
- Taxi Apps Pty Ltd (GoCatch)
- P2P Transport Limited
- GM Cabs
- Rydo Taxi
- Bolt Technology OÜ
- A2B Australia Limited
- ANI Technologies Pvt Ltd (Ola)
- (Didi Chuxing) Beijing Xiaoju Technology Co Ltd
Significant Taxi Industry Australia Industry Milestones
- October 2022: Ingenico and Live Payments partner to enhance payment solutions for retailers and taxis.
- October 2022: Uber announces the addition of 500 Polestar 2 electric vehicles for its Sydney rideshare service, launching Custom Electric in 2023.
- April 2023: GM Cabs launches Taxi-Share 2023, a hybrid taxi and rideshare service.
Future Outlook for Taxi Industry Australia Market
The Australian taxi industry is poised for continued growth, driven by technological advancements, evolving consumer preferences, and government initiatives promoting sustainable transportation. Opportunities exist in the expansion of electric vehicle fleets, the development of innovative mobile applications, and the integration of autonomous driving technologies. The market is expected to continue its dynamic evolution, with a focus on enhancing customer experience and operational efficiency.
Taxi Industry Australia Segmentation
-
1. Service Type
- 1.1. Ride Hailing
- 1.2. Ridesharing
-
2. Booking Type
- 2.1. Online Booking
- 2.2. Offline Booking
-
3. Vehicle Type
- 3.1. Hatchbacks
- 3.2. Sedans
- 3.3. SUVs/MPVs
Taxi Industry Australia Segmentation By Geography
-
1. North America
- 1.1. United States
- 1.2. Canada
- 1.3. Mexico
-
2. South America
- 2.1. Brazil
- 2.2. Argentina
- 2.3. Rest of South America
-
3. Europe
- 3.1. United Kingdom
- 3.2. Germany
- 3.3. France
- 3.4. Italy
- 3.5. Spain
- 3.6. Russia
- 3.7. Benelux
- 3.8. Nordics
- 3.9. Rest of Europe
-
4. Middle East & Africa
- 4.1. Turkey
- 4.2. Israel
- 4.3. GCC
- 4.4. North Africa
- 4.5. South Africa
- 4.6. Rest of Middle East & Africa
-
5. Asia Pacific
- 5.1. China
- 5.2. India
- 5.3. Japan
- 5.4. South Korea
- 5.5. ASEAN
- 5.6. Oceania
- 5.7. Rest of Asia Pacific
Taxi Industry Australia Regional Market Share
Geographic Coverage of Taxi Industry Australia
Taxi Industry Australia REPORT HIGHLIGHTS
| Aspects | Details |
|---|---|
| Study Period | 2020-2034 |
| Base Year | 2025 |
| Estimated Year | 2026 |
| Forecast Period | 2026-2034 |
| Historical Period | 2020-2025 |
| Growth Rate | CAGR of 9.60% from 2020-2034 |
| Segmentation |
|
Table of Contents
- 1. Introduction
- 1.1. Research Scope
- 1.2. Market Segmentation
- 1.3. Research Objective
- 1.4. Definitions and Assumptions
- 2. Executive Summary
- 2.1. Market Snapshot
- 3. Market Dynamics
- 3.1. Market Drivers
- 3.2. Market Restrains
- 3.3. Market Trends
- 3.4. Market Opportunities
- 4. Market Factor Analysis
- 4.1. Porters Five Forces
- 4.1.1. Bargaining Power of Suppliers
- 4.1.2. Bargaining Power of Buyers
- 4.1.3. Threat of New Entrants
- 4.1.4. Threat of Substitutes
- 4.1.5. Competitive Rivalry
- 4.2. PESTEL analysis
- 4.3. BCG Analysis
- 4.3.1. Stars (High Growth, High Market Share)
- 4.3.2. Cash Cows (Low Growth, High Market Share)
- 4.3.3. Question Mark (High Growth, Low Market Share)
- 4.3.4. Dogs (Low Growth, Low Market Share)
- 4.4. Ansoff Matrix Analysis
- 4.5. Supply Chain Analysis
- 4.6. Regulatory Landscape
- 4.7. Current Market Potential and Opportunity Assessment (TAM–SAM–SOM Framework)
- 4.8. TIR Analyst Note
- 4.1. Porters Five Forces
- 5. Market Analysis, Insights and Forecast 2021-2033
- 5.1. Market Analysis, Insights and Forecast - by Service Type
- 5.1.1. Ride Hailing
- 5.1.2. Ridesharing
- 5.2. Market Analysis, Insights and Forecast - by Booking Type
- 5.2.1. Online Booking
- 5.2.2. Offline Booking
- 5.3. Market Analysis, Insights and Forecast - by Vehicle Type
- 5.3.1. Hatchbacks
- 5.3.2. Sedans
- 5.3.3. SUVs/MPVs
- 5.4. Market Analysis, Insights and Forecast - by Region
- 5.4.1. North America
- 5.4.2. South America
- 5.4.3. Europe
- 5.4.4. Middle East & Africa
- 5.4.5. Asia Pacific
- 5.1. Market Analysis, Insights and Forecast - by Service Type
- 6. Global Taxi Industry Australia Analysis, Insights and Forecast, 2021-2033
- 6.1. Market Analysis, Insights and Forecast - by Service Type
- 6.1.1. Ride Hailing
- 6.1.2. Ridesharing
- 6.2. Market Analysis, Insights and Forecast - by Booking Type
- 6.2.1. Online Booking
- 6.2.2. Offline Booking
- 6.3. Market Analysis, Insights and Forecast - by Vehicle Type
- 6.3.1. Hatchbacks
- 6.3.2. Sedans
- 6.3.3. SUVs/MPVs
- 6.1. Market Analysis, Insights and Forecast - by Service Type
- 7. North America Taxi Industry Australia Analysis, Insights and Forecast, 2020-2032
- 7.1. Market Analysis, Insights and Forecast - by Service Type
- 7.1.1. Ride Hailing
- 7.1.2. Ridesharing
- 7.2. Market Analysis, Insights and Forecast - by Booking Type
- 7.2.1. Online Booking
- 7.2.2. Offline Booking
- 7.3. Market Analysis, Insights and Forecast - by Vehicle Type
- 7.3.1. Hatchbacks
- 7.3.2. Sedans
- 7.3.3. SUVs/MPVs
- 7.1. Market Analysis, Insights and Forecast - by Service Type
- 8. South America Taxi Industry Australia Analysis, Insights and Forecast, 2020-2032
- 8.1. Market Analysis, Insights and Forecast - by Service Type
- 8.1.1. Ride Hailing
- 8.1.2. Ridesharing
- 8.2. Market Analysis, Insights and Forecast - by Booking Type
- 8.2.1. Online Booking
- 8.2.2. Offline Booking
- 8.3. Market Analysis, Insights and Forecast - by Vehicle Type
- 8.3.1. Hatchbacks
- 8.3.2. Sedans
- 8.3.3. SUVs/MPVs
- 8.1. Market Analysis, Insights and Forecast - by Service Type
- 9. Europe Taxi Industry Australia Analysis, Insights and Forecast, 2020-2032
- 9.1. Market Analysis, Insights and Forecast - by Service Type
- 9.1.1. Ride Hailing
- 9.1.2. Ridesharing
- 9.2. Market Analysis, Insights and Forecast - by Booking Type
- 9.2.1. Online Booking
- 9.2.2. Offline Booking
- 9.3. Market Analysis, Insights and Forecast - by Vehicle Type
- 9.3.1. Hatchbacks
- 9.3.2. Sedans
- 9.3.3. SUVs/MPVs
- 9.1. Market Analysis, Insights and Forecast - by Service Type
- 10. Middle East & Africa Taxi Industry Australia Analysis, Insights and Forecast, 2020-2032
- 10.1. Market Analysis, Insights and Forecast - by Service Type
- 10.1.1. Ride Hailing
- 10.1.2. Ridesharing
- 10.2. Market Analysis, Insights and Forecast - by Booking Type
- 10.2.1. Online Booking
- 10.2.2. Offline Booking
- 10.3. Market Analysis, Insights and Forecast - by Vehicle Type
- 10.3.1. Hatchbacks
- 10.3.2. Sedans
- 10.3.3. SUVs/MPVs
- 10.1. Market Analysis, Insights and Forecast - by Service Type
- 11. Asia Pacific Taxi Industry Australia Analysis, Insights and Forecast, 2020-2032
- 11.1. Market Analysis, Insights and Forecast - by Service Type
- 11.1.1. Ride Hailing
- 11.1.2. Ridesharing
- 11.2. Market Analysis, Insights and Forecast - by Booking Type
- 11.2.1. Online Booking
- 11.2.2. Offline Booking
- 11.3. Market Analysis, Insights and Forecast - by Vehicle Type
- 11.3.1. Hatchbacks
- 11.3.2. Sedans
- 11.3.3. SUVs/MPVs
- 11.1. Market Analysis, Insights and Forecast - by Service Type
- 12. Competitive Analysis
- 12.1. Company Profiles
- 12.1.1 Legion Cabs
- 12.1.1.1. Company Overview
- 12.1.1.2. Products
- 12.1.1.3. Company Financials
- 12.1.1.4. SWOT Analysis
- 12.1.2 Ingogo
- 12.1.2.1. Company Overview
- 12.1.2.2. Products
- 12.1.2.3. Company Financials
- 12.1.2.4. SWOT Analysis
- 12.1.3 Uber Technologies Inc
- 12.1.3.1. Company Overview
- 12.1.3.2. Products
- 12.1.3.3. Company Financials
- 12.1.3.4. SWOT Analysis
- 12.1.4 Taxi Apps Pty Ltd (GoCatch)
- 12.1.4.1. Company Overview
- 12.1.4.2. Products
- 12.1.4.3. Company Financials
- 12.1.4.4. SWOT Analysis
- 12.1.5 P2P Transport Limited
- 12.1.5.1. Company Overview
- 12.1.5.2. Products
- 12.1.5.3. Company Financials
- 12.1.5.4. SWOT Analysis
- 12.1.6 GM Cabs
- 12.1.6.1. Company Overview
- 12.1.6.2. Products
- 12.1.6.3. Company Financials
- 12.1.6.4. SWOT Analysis
- 12.1.7 Rydo Taxi
- 12.1.7.1. Company Overview
- 12.1.7.2. Products
- 12.1.7.3. Company Financials
- 12.1.7.4. SWOT Analysis
- 12.1.8 Bolt Technology OÜ
- 12.1.8.1. Company Overview
- 12.1.8.2. Products
- 12.1.8.3. Company Financials
- 12.1.8.4. SWOT Analysis
- 12.1.9 A2B Australia Limited
- 12.1.9.1. Company Overview
- 12.1.9.2. Products
- 12.1.9.3. Company Financials
- 12.1.9.4. SWOT Analysis
- 12.1.10 ANI Technologies Pvt Ltd (Ola)
- 12.1.10.1. Company Overview
- 12.1.10.2. Products
- 12.1.10.3. Company Financials
- 12.1.10.4. SWOT Analysis
- 12.1.11 (Didi Chuxing) Beijing Xiaoju Technology Co Ltd *List Not Exhaustive
- 12.1.11.1. Company Overview
- 12.1.11.2. Products
- 12.1.11.3. Company Financials
- 12.1.11.4. SWOT Analysis
- 12.1.1 Legion Cabs
- 12.2. Market Entropy
- 12.2.1 Company's Key Areas Served
- 12.2.2 Recent Developments
- 12.3. Company Market Share Analysis 2025
- 12.3.1 Top 5 Companies Market Share Analysis
- 12.3.2 Top 3 Companies Market Share Analysis
- 12.4. List of Potential Customers
- 13. Research Methodology
List of Figures
- Figure 1: Global Taxi Industry Australia Revenue Breakdown (Million, %) by Region 2025 & 2033
- Figure 2: North America Taxi Industry Australia Revenue (Million), by Service Type 2025 & 2033
- Figure 3: North America Taxi Industry Australia Revenue Share (%), by Service Type 2025 & 2033
- Figure 4: North America Taxi Industry Australia Revenue (Million), by Booking Type 2025 & 2033
- Figure 5: North America Taxi Industry Australia Revenue Share (%), by Booking Type 2025 & 2033
- Figure 6: North America Taxi Industry Australia Revenue (Million), by Vehicle Type 2025 & 2033
- Figure 7: North America Taxi Industry Australia Revenue Share (%), by Vehicle Type 2025 & 2033
- Figure 8: North America Taxi Industry Australia Revenue (Million), by Country 2025 & 2033
- Figure 9: North America Taxi Industry Australia Revenue Share (%), by Country 2025 & 2033
- Figure 10: South America Taxi Industry Australia Revenue (Million), by Service Type 2025 & 2033
- Figure 11: South America Taxi Industry Australia Revenue Share (%), by Service Type 2025 & 2033
- Figure 12: South America Taxi Industry Australia Revenue (Million), by Booking Type 2025 & 2033
- Figure 13: South America Taxi Industry Australia Revenue Share (%), by Booking Type 2025 & 2033
- Figure 14: South America Taxi Industry Australia Revenue (Million), by Vehicle Type 2025 & 2033
- Figure 15: South America Taxi Industry Australia Revenue Share (%), by Vehicle Type 2025 & 2033
- Figure 16: South America Taxi Industry Australia Revenue (Million), by Country 2025 & 2033
- Figure 17: South America Taxi Industry Australia Revenue Share (%), by Country 2025 & 2033
- Figure 18: Europe Taxi Industry Australia Revenue (Million), by Service Type 2025 & 2033
- Figure 19: Europe Taxi Industry Australia Revenue Share (%), by Service Type 2025 & 2033
- Figure 20: Europe Taxi Industry Australia Revenue (Million), by Booking Type 2025 & 2033
- Figure 21: Europe Taxi Industry Australia Revenue Share (%), by Booking Type 2025 & 2033
- Figure 22: Europe Taxi Industry Australia Revenue (Million), by Vehicle Type 2025 & 2033
- Figure 23: Europe Taxi Industry Australia Revenue Share (%), by Vehicle Type 2025 & 2033
- Figure 24: Europe Taxi Industry Australia Revenue (Million), by Country 2025 & 2033
- Figure 25: Europe Taxi Industry Australia Revenue Share (%), by Country 2025 & 2033
- Figure 26: Middle East & Africa Taxi Industry Australia Revenue (Million), by Service Type 2025 & 2033
- Figure 27: Middle East & Africa Taxi Industry Australia Revenue Share (%), by Service Type 2025 & 2033
- Figure 28: Middle East & Africa Taxi Industry Australia Revenue (Million), by Booking Type 2025 & 2033
- Figure 29: Middle East & Africa Taxi Industry Australia Revenue Share (%), by Booking Type 2025 & 2033
- Figure 30: Middle East & Africa Taxi Industry Australia Revenue (Million), by Vehicle Type 2025 & 2033
- Figure 31: Middle East & Africa Taxi Industry Australia Revenue Share (%), by Vehicle Type 2025 & 2033
- Figure 32: Middle East & Africa Taxi Industry Australia Revenue (Million), by Country 2025 & 2033
- Figure 33: Middle East & Africa Taxi Industry Australia Revenue Share (%), by Country 2025 & 2033
- Figure 34: Asia Pacific Taxi Industry Australia Revenue (Million), by Service Type 2025 & 2033
- Figure 35: Asia Pacific Taxi Industry Australia Revenue Share (%), by Service Type 2025 & 2033
- Figure 36: Asia Pacific Taxi Industry Australia Revenue (Million), by Booking Type 2025 & 2033
- Figure 37: Asia Pacific Taxi Industry Australia Revenue Share (%), by Booking Type 2025 & 2033
- Figure 38: Asia Pacific Taxi Industry Australia Revenue (Million), by Vehicle Type 2025 & 2033
- Figure 39: Asia Pacific Taxi Industry Australia Revenue Share (%), by Vehicle Type 2025 & 2033
- Figure 40: Asia Pacific Taxi Industry Australia Revenue (Million), by Country 2025 & 2033
- Figure 41: Asia Pacific Taxi Industry Australia Revenue Share (%), by Country 2025 & 2033
List of Tables
- Table 1: Global Taxi Industry Australia Revenue Million Forecast, by Service Type 2020 & 2033
- Table 2: Global Taxi Industry Australia Revenue Million Forecast, by Booking Type 2020 & 2033
- Table 3: Global Taxi Industry Australia Revenue Million Forecast, by Vehicle Type 2020 & 2033
- Table 4: Global Taxi Industry Australia Revenue Million Forecast, by Region 2020 & 2033
- Table 5: Global Taxi Industry Australia Revenue Million Forecast, by Service Type 2020 & 2033
- Table 6: Global Taxi Industry Australia Revenue Million Forecast, by Booking Type 2020 & 2033
- Table 7: Global Taxi Industry Australia Revenue Million Forecast, by Vehicle Type 2020 & 2033
- Table 8: Global Taxi Industry Australia Revenue Million Forecast, by Country 2020 & 2033
- Table 9: United States Taxi Industry Australia Revenue (Million) Forecast, by Application 2020 & 2033
- Table 10: Canada Taxi Industry Australia Revenue (Million) Forecast, by Application 2020 & 2033
- Table 11: Mexico Taxi Industry Australia Revenue (Million) Forecast, by Application 2020 & 2033
- Table 12: Global Taxi Industry Australia Revenue Million Forecast, by Service Type 2020 & 2033
- Table 13: Global Taxi Industry Australia Revenue Million Forecast, by Booking Type 2020 & 2033
- Table 14: Global Taxi Industry Australia Revenue Million Forecast, by Vehicle Type 2020 & 2033
- Table 15: Global Taxi Industry Australia Revenue Million Forecast, by Country 2020 & 2033
- Table 16: Brazil Taxi Industry Australia Revenue (Million) Forecast, by Application 2020 & 2033
- Table 17: Argentina Taxi Industry Australia Revenue (Million) Forecast, by Application 2020 & 2033
- Table 18: Rest of South America Taxi Industry Australia Revenue (Million) Forecast, by Application 2020 & 2033
- Table 19: Global Taxi Industry Australia Revenue Million Forecast, by Service Type 2020 & 2033
- Table 20: Global Taxi Industry Australia Revenue Million Forecast, by Booking Type 2020 & 2033
- Table 21: Global Taxi Industry Australia Revenue Million Forecast, by Vehicle Type 2020 & 2033
- Table 22: Global Taxi Industry Australia Revenue Million Forecast, by Country 2020 & 2033
- Table 23: United Kingdom Taxi Industry Australia Revenue (Million) Forecast, by Application 2020 & 2033
- Table 24: Germany Taxi Industry Australia Revenue (Million) Forecast, by Application 2020 & 2033
- Table 25: France Taxi Industry Australia Revenue (Million) Forecast, by Application 2020 & 2033
- Table 26: Italy Taxi Industry Australia Revenue (Million) Forecast, by Application 2020 & 2033
- Table 27: Spain Taxi Industry Australia Revenue (Million) Forecast, by Application 2020 & 2033
- Table 28: Russia Taxi Industry Australia Revenue (Million) Forecast, by Application 2020 & 2033
- Table 29: Benelux Taxi Industry Australia Revenue (Million) Forecast, by Application 2020 & 2033
- Table 30: Nordics Taxi Industry Australia Revenue (Million) Forecast, by Application 2020 & 2033
- Table 31: Rest of Europe Taxi Industry Australia Revenue (Million) Forecast, by Application 2020 & 2033
- Table 32: Global Taxi Industry Australia Revenue Million Forecast, by Service Type 2020 & 2033
- Table 33: Global Taxi Industry Australia Revenue Million Forecast, by Booking Type 2020 & 2033
- Table 34: Global Taxi Industry Australia Revenue Million Forecast, by Vehicle Type 2020 & 2033
- Table 35: Global Taxi Industry Australia Revenue Million Forecast, by Country 2020 & 2033
- Table 36: Turkey Taxi Industry Australia Revenue (Million) Forecast, by Application 2020 & 2033
- Table 37: Israel Taxi Industry Australia Revenue (Million) Forecast, by Application 2020 & 2033
- Table 38: GCC Taxi Industry Australia Revenue (Million) Forecast, by Application 2020 & 2033
- Table 39: North Africa Taxi Industry Australia Revenue (Million) Forecast, by Application 2020 & 2033
- Table 40: South Africa Taxi Industry Australia Revenue (Million) Forecast, by Application 2020 & 2033
- Table 41: Rest of Middle East & Africa Taxi Industry Australia Revenue (Million) Forecast, by Application 2020 & 2033
- Table 42: Global Taxi Industry Australia Revenue Million Forecast, by Service Type 2020 & 2033
- Table 43: Global Taxi Industry Australia Revenue Million Forecast, by Booking Type 2020 & 2033
- Table 44: Global Taxi Industry Australia Revenue Million Forecast, by Vehicle Type 2020 & 2033
- Table 45: Global Taxi Industry Australia Revenue Million Forecast, by Country 2020 & 2033
- Table 46: China Taxi Industry Australia Revenue (Million) Forecast, by Application 2020 & 2033
- Table 47: India Taxi Industry Australia Revenue (Million) Forecast, by Application 2020 & 2033
- Table 48: Japan Taxi Industry Australia Revenue (Million) Forecast, by Application 2020 & 2033
- Table 49: South Korea Taxi Industry Australia Revenue (Million) Forecast, by Application 2020 & 2033
- Table 50: ASEAN Taxi Industry Australia Revenue (Million) Forecast, by Application 2020 & 2033
- Table 51: Oceania Taxi Industry Australia Revenue (Million) Forecast, by Application 2020 & 2033
- Table 52: Rest of Asia Pacific Taxi Industry Australia Revenue (Million) Forecast, by Application 2020 & 2033
Frequently Asked Questions
1. What is the projected Compound Annual Growth Rate (CAGR) of the Taxi Industry Australia?
The projected CAGR is approximately 9.60%.
2. Which companies are prominent players in the Taxi Industry Australia?
Key companies in the market include Legion Cabs, Ingogo, Uber Technologies Inc, Taxi Apps Pty Ltd (GoCatch), P2P Transport Limited, GM Cabs, Rydo Taxi, Bolt Technology OÜ, A2B Australia Limited, ANI Technologies Pvt Ltd (Ola), (Didi Chuxing) Beijing Xiaoju Technology Co Ltd *List Not Exhaustive.
3. What are the main segments of the Taxi Industry Australia?
The market segments include Service Type, Booking Type, Vehicle Type.
4. Can you provide details about the market size?
The market size is estimated to be USD 3.73 Million as of 2022.
5. What are some drivers contributing to market growth?
Growing Tourism Industry in Australia.
6. What are the notable trends driving market growth?
Online Booking Holds the Highest Share.
7. Are there any restraints impacting market growth?
Varying Government Regulations on Taxi Services.
8. Can you provide examples of recent developments in the market?
October 2022: Ingenico, the most trusted technological partner for payment acceptance, and Live Payments, one of Australia's leading payment service providers, announced their cooperation for long-term strategic partnerships to equip retailers and taxis with seamless and convenient payment and commerce solutions.
9. What pricing options are available for accessing the report?
Pricing options include single-user, multi-user, and enterprise licenses priced at USD 3800, USD 4500, and USD 5800 respectively.
10. Is the market size provided in terms of value or volume?
The market size is provided in terms of value, measured in Million.
11. Are there any specific market keywords associated with the report?
Yes, the market keyword associated with the report is "Taxi Industry Australia," which aids in identifying and referencing the specific market segment covered.
12. How do I determine which pricing option suits my needs best?
The pricing options vary based on user requirements and access needs. Individual users may opt for single-user licenses, while businesses requiring broader access may choose multi-user or enterprise licenses for cost-effective access to the report.
13. Are there any additional resources or data provided in the Taxi Industry Australia report?
While the report offers comprehensive insights, it's advisable to review the specific contents or supplementary materials provided to ascertain if additional resources or data are available.
14. How can I stay updated on further developments or reports in the Taxi Industry Australia?
To stay informed about further developments, trends, and reports in the Taxi Industry Australia, consider subscribing to industry newsletters, following relevant companies and organizations, or regularly checking reputable industry news sources and publications.
Methodology
Step 1 - Identification of Relevant Samples Size from Population Database


Step 2 - Approaches for Defining Global Market Size (Value, Volume* & Price*)

Note*: In applicable scenarios
Step 3 - Data Sources
Primary Research
- Web Analytics
- Survey Reports
- Research Institute
- Latest Research Reports
- Opinion Leaders
Secondary Research
- Annual Reports
- White Paper
- Latest Press Release
- Industry Association
- Paid Database
- Investor Presentations

Step 4 - Data Triangulation
Involves using different sources of information in order to increase the validity of a study
These sources are likely to be stakeholders in a program - participants, other researchers, program staff, other community members, and so on.
Then we put all data in single framework & apply various statistical tools to find out the dynamic on the market.
During the analysis stage, feedback from the stakeholder groups would be compared to determine areas of agreement as well as areas of divergence