

Key Insights
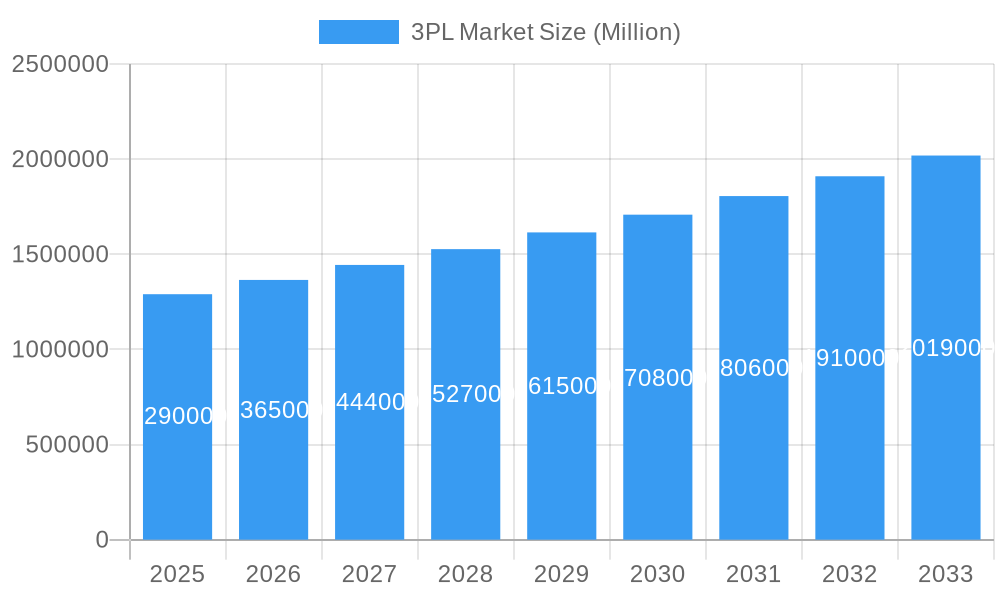
The global third-party logistics (3PL) market is experiencing robust growth, projected to reach $1.29 trillion in 2025 and maintain a Compound Annual Growth Rate (CAGR) of 5.48% from 2025 to 2033. This expansion is driven by several key factors. E-commerce proliferation necessitates efficient and scalable logistics solutions, fueling demand for 3PL services. Simultaneously, businesses are increasingly outsourcing non-core functions like warehousing and transportation to focus on their core competencies, leading to increased reliance on 3PL providers. The rising complexity of global supply chains, particularly in sectors like manufacturing and healthcare, also necessitates specialized 3PL expertise for efficient inventory management and timely delivery. Technological advancements, such as automation, data analytics, and the Internet of Things (IoT), are improving 3PL efficiency, transparency, and cost-effectiveness, further stimulating market growth. The market is segmented by service type (domestic and international transportation management, value-added warehousing and distribution) and end-user industry (automobile, energy, manufacturing, life sciences and healthcare, retail technology, and others). Key players, including DB Schenker, DHL, Ceva Logistics, FedEx, and Kuehne+Nagel, are continually innovating and expanding their service offerings to capitalize on the burgeoning market opportunities. Geographical expansion into emerging markets with growing infrastructure and e-commerce penetration further contributes to this growth trajectory.
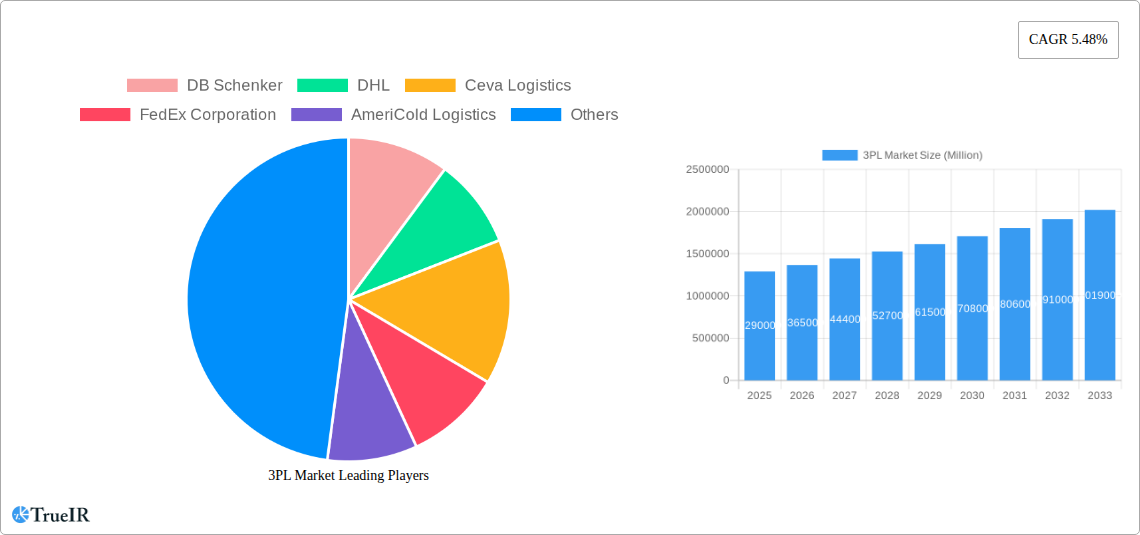
3PL Market Market Size (In Million)
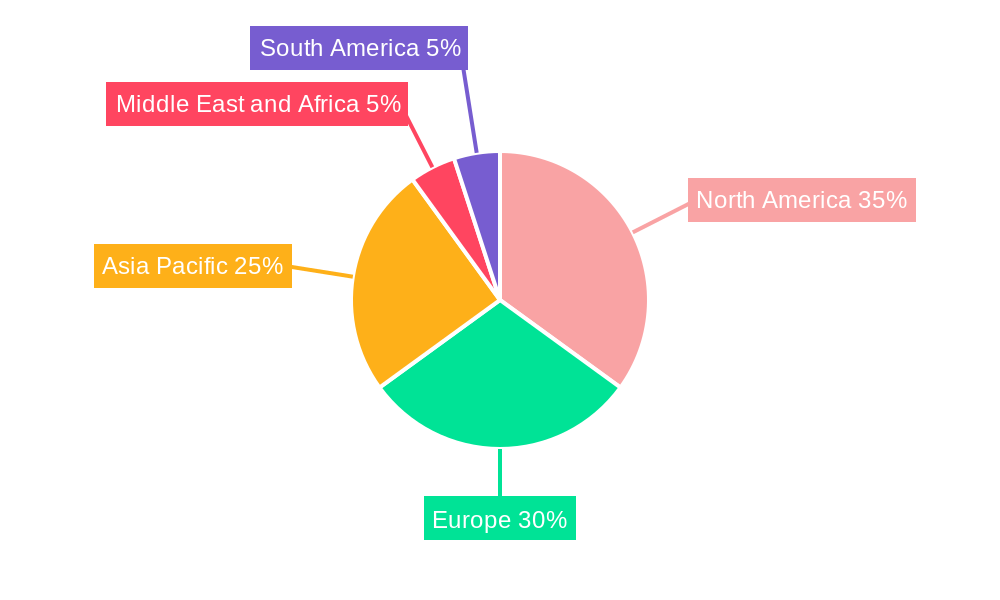
The competitive landscape is characterized by both established multinational corporations and regional players. Consolidation through mergers and acquisitions is expected to continue, resulting in a more concentrated market. While challenges like fluctuating fuel prices and geopolitical uncertainties can create headwinds, the overall outlook remains positive, driven by the persistent need for efficient and reliable supply chain solutions in a globalized economy. The continued growth of e-commerce and the increasing focus on supply chain resilience suggest this upward trend will endure throughout the forecast period. Regional variations exist, with North America and Europe currently dominating the market, but rapid growth is expected in Asia-Pacific and other emerging economies as infrastructure develops and consumer demand rises.
3PL Market Company Market Share
Dynamic 3PL Market Report: 2019-2033 Forecast
This comprehensive report provides an in-depth analysis of the global 3PL market, offering invaluable insights for industry professionals, investors, and strategic decision-makers. Leveraging extensive data from 2019-2024 (historical period), with a base year of 2025 and a forecast extending to 2033, this report unveils the market's dynamic landscape, highlighting key trends, growth drivers, and challenges. The market is projected to reach xx Million by 2033, exhibiting a robust CAGR of xx%.
3PL Market Market Structure & Competitive Landscape
The 3PL market is characterized by a moderately concentrated structure, with several multinational giants holding significant market share. Leading players such as DB Schenker, DHL, FedEx Corporation, Kuehne+Nagel Inc, and DSV compete fiercely, driving innovation and shaping market dynamics. The Herfindahl-Hirschman Index (HHI) for the global market in 2024 is estimated to be xx, indicating a moderately consolidated market.
- Market Concentration: The top 10 players account for approximately xx% of the global market revenue.
- Innovation Drivers: Technological advancements, particularly in automation, AI, and data analytics, are key drivers of innovation, enabling improved efficiency and supply chain visibility.
- Regulatory Impacts: Fluctuating global trade policies and regulations significantly impact cross-border logistics operations. Regional variations in regulations add complexity to market operations.
- Product Substitutes: While the core services remain relatively stable, the increasing adoption of in-house logistics solutions within certain industries provides a competitive pressure.
- End-User Segmentation: The market is widely diversified across various end-user industries, with automotive, manufacturing, and retail sectors representing significant segments.
- M&A Trends: The 3PL sector witnesses continuous M&A activity, with larger players strategically acquiring smaller companies to enhance their service portfolios and geographic reach. The total deal value in 2024 is estimated at xx Million.
3PL Market Market Trends & Opportunities
The 3PL market is experiencing exponential growth, fueled by the expanding e-commerce sector, globalization of supply chains, and increasing demand for efficient logistics solutions. The market size is projected to expand significantly, reaching xx Million by 2033. This growth is driven by technological advancements and changing consumer expectations in terms of faster delivery times and increased transparency.
- Market Size Growth: The market is expected to grow at a CAGR of xx% during the forecast period (2025-2033), significantly exceeding the growth rate of the global economy.
- Technological Shifts: The integration of AI, blockchain, IoT, and automation is revolutionizing warehouse management and transportation operations, improving efficiency and reducing costs. This also leads to enhanced visibility across the entire supply chain.
- Consumer Preferences: Consumers demand faster and more reliable deliveries, pushing 3PL providers to adopt agile and flexible solutions. Real-time tracking and personalized delivery options are becoming increasingly vital.
- Competitive Dynamics: Intense competition among 3PL providers forces continuous improvement in service offerings, pricing strategies, and technological investments.
Dominant Markets & Segments in 3PL Market
The Asia-Pacific region is anticipated to dominate the 3PL market throughout the forecast period, driven by rapid industrialization, economic growth, and significant e-commerce expansion. Within the service segments, value-added warehousing and distribution exhibit strong growth potential due to increased demand for specialized inventory management solutions. The automotive and manufacturing sectors remain the largest end-user segments, exhibiting strong demand for robust and reliable 3PL services.
- Key Growth Drivers (Asia-Pacific):
- Rapid economic growth and expanding manufacturing bases.
- Significant investments in infrastructure development.
- Booming e-commerce market and increasing consumer demand for faster deliveries.
- Dominant Segments:
- Value-added warehousing and distribution, driven by increasing demand for customized inventory management and fulfillment solutions.
- Automotive and manufacturing sectors, requiring extensive logistics capabilities for raw materials, finished goods, and spare parts management.
3PL Market Product Analysis
The 3PL market's product offerings are increasingly diversified, encompassing a broad spectrum of logistics solutions, from basic transportation and warehousing services to complex, value-added services like inventory management, order fulfillment, and reverse logistics. Recent technological advances, such as the integration of robotics and AI in warehousing, significantly improve operational efficiency and optimize cost management. The adaptability of service offerings, according to the changing needs of clients, is a crucial factor defining competitive advantage.
Key Drivers, Barriers & Challenges in 3PL Market
Key Drivers: The expansion of global e-commerce, technological advancements (automation, AI, IoT), and growing demand for efficient supply chain solutions are major growth drivers. Government initiatives promoting infrastructure development and facilitating cross-border trade further stimulate market growth.
Challenges: Fluctuating fuel prices, labor shortages, geopolitical instability, and increasing regulatory complexities pose significant challenges. Supply chain disruptions caused by global events can severely impact the industry's operational efficiency. The competitive landscape demands significant investment in technology and operational excellence to stay ahead of the curve.
Growth Drivers in the 3PL Market Market
Technological innovation, especially AI, automation, and real-time tracking systems, enhances efficiency and visibility. The ongoing growth of e-commerce, with its demand for fast and reliable delivery, significantly drives the market. Favorable government regulations supporting logistics infrastructure and easing trade policies contribute positively.
Challenges Impacting 3PL Market Growth
Supply chain disruptions remain a major obstacle, impacting timely delivery and increasing costs. Labor shortages and rising fuel costs increase operational expenses and reduce profitability. Stricter environmental regulations and increased scrutiny of sustainability practices create operational complexities.
Key Players Shaping the 3PL Market Market
Significant 3PL Market Industry Milestones
- Dec 2022: SEKO Logistics partners with GreyOrange to deploy 50 Ranger Assist Bots in its UK warehouse, with plans for further expansion.
- Sept 2022: AI LOGISTIX partners with SUN Mobility to deploy 500 electric vehicles for last-mile delivery in India.
Future Outlook for 3PL Market Market
The 3PL market is poised for sustained growth, driven by ongoing technological advancements, the expansion of e-commerce, and increasing globalization. Strategic partnerships, investments in automation, and the focus on sustainable logistics practices will shape the future of the industry. The market's future potential is considerable, with opportunities for innovation and expansion across diverse sectors and geographic regions.
3PL Market Segmentation
-
1. Service
- 1.1. Domestic Transportation Management
- 1.2. International Transportation Management
- 1.3. Value-added Warehousing and Distribution
-
2. End User
- 2.1. Automobile
- 2.2. Energy
- 2.3. Manufacturing
- 2.4. Life Science and Healthcare
- 2.5. Retail Technology
- 2.6. Other End Users
3PL Market Segmentation By Geography
-
1. North America
- 1.1. United States
- 1.2. Canada
- 1.3. Mexico
-
2. South America
- 2.1. Brazil
- 2.2. Argentina
- 2.3. Rest of South America
-
3. Asia Pacific
- 3.1. India
- 3.2. China
- 3.3. Singapore
- 3.4. Japan
- 3.5. South Korea
- 3.6. Vietnam
- 3.7. Australia
- 3.8. Rest of Asia Pacific
-
4. Middle East and Africa
- 4.1. South Africa
- 4.2. United Arab Emirates
- 4.3. Saudi Arabia
- 4.4. Egypt
- 4.5. Rest of Middle East and Africa
-
5. Europe
- 5.1. Germany
- 5.2. Spain
- 5.3. France
- 5.4. Russia
- 5.5. United Kingdom
- 5.6. Rest of Europe
3PL Market Regional Market Share
Geographic Coverage of 3PL Market
3PL Market REPORT HIGHLIGHTS
| Aspects | Details |
|---|---|
| Study Period | 2020-2034 |
| Base Year | 2025 |
| Estimated Year | 2026 |
| Forecast Period | 2026-2034 |
| Historical Period | 2020-2025 |
| Growth Rate | CAGR of 5.48% from 2020-2034 |
| Segmentation |
|
Table of Contents
- 1. Introduction
- 1.1. Research Scope
- 1.2. Market Segmentation
- 1.3. Research Objective
- 1.4. Definitions and Assumptions
- 2. Executive Summary
- 2.1. Market Snapshot
- 3. Market Dynamics
- 3.1. Market Drivers
- 3.2. Market Restrains
- 3.3. Market Trends
- 3.4. Market Opportunities
- 4. Market Factor Analysis
- 4.1. Porters Five Forces
- 4.1.1. Bargaining Power of Suppliers
- 4.1.2. Bargaining Power of Buyers
- 4.1.3. Threat of New Entrants
- 4.1.4. Threat of Substitutes
- 4.1.5. Competitive Rivalry
- 4.2. PESTEL analysis
- 4.3. BCG Analysis
- 4.3.1. Stars (High Growth, High Market Share)
- 4.3.2. Cash Cows (Low Growth, High Market Share)
- 4.3.3. Question Mark (High Growth, Low Market Share)
- 4.3.4. Dogs (Low Growth, Low Market Share)
- 4.4. Ansoff Matrix Analysis
- 4.5. Supply Chain Analysis
- 4.6. Regulatory Landscape
- 4.7. Current Market Potential and Opportunity Assessment (TAM–SAM–SOM Framework)
- 4.8. TIR Analyst Note
- 4.1. Porters Five Forces
- 5. Market Analysis, Insights and Forecast 2021-2033
- 5.1. Market Analysis, Insights and Forecast - by Service
- 5.1.1. Domestic Transportation Management
- 5.1.2. International Transportation Management
- 5.1.3. Value-added Warehousing and Distribution
- 5.2. Market Analysis, Insights and Forecast - by End User
- 5.2.1. Automobile
- 5.2.2. Energy
- 5.2.3. Manufacturing
- 5.2.4. Life Science and Healthcare
- 5.2.5. Retail Technology
- 5.2.6. Other End Users
- 5.3. Market Analysis, Insights and Forecast - by Region
- 5.3.1. North America
- 5.3.2. South America
- 5.3.3. Asia Pacific
- 5.3.4. Middle East and Africa
- 5.3.5. Europe
- 5.1. Market Analysis, Insights and Forecast - by Service
- 6. 3PL Market Analysis, Insights and Forecast, 2021-2033
- 6.1. Market Analysis, Insights and Forecast - by Service
- 6.1.1. Domestic Transportation Management
- 6.1.2. International Transportation Management
- 6.1.3. Value-added Warehousing and Distribution
- 6.2. Market Analysis, Insights and Forecast - by End User
- 6.2.1. Automobile
- 6.2.2. Energy
- 6.2.3. Manufacturing
- 6.2.4. Life Science and Healthcare
- 6.2.5. Retail Technology
- 6.2.6. Other End Users
- 6.1. Market Analysis, Insights and Forecast - by Service
- 7. North America 3PL Market Analysis, Insights and Forecast, 2020-2032
- 7.1. Market Analysis, Insights and Forecast - by Service
- 7.1.1. Domestic Transportation Management
- 7.1.2. International Transportation Management
- 7.1.3. Value-added Warehousing and Distribution
- 7.2. Market Analysis, Insights and Forecast - by End User
- 7.2.1. Automobile
- 7.2.2. Energy
- 7.2.3. Manufacturing
- 7.2.4. Life Science and Healthcare
- 7.2.5. Retail Technology
- 7.2.6. Other End Users
- 7.1. Market Analysis, Insights and Forecast - by Service
- 8. South America 3PL Market Analysis, Insights and Forecast, 2020-2032
- 8.1. Market Analysis, Insights and Forecast - by Service
- 8.1.1. Domestic Transportation Management
- 8.1.2. International Transportation Management
- 8.1.3. Value-added Warehousing and Distribution
- 8.2. Market Analysis, Insights and Forecast - by End User
- 8.2.1. Automobile
- 8.2.2. Energy
- 8.2.3. Manufacturing
- 8.2.4. Life Science and Healthcare
- 8.2.5. Retail Technology
- 8.2.6. Other End Users
- 8.1. Market Analysis, Insights and Forecast - by Service
- 9. Asia Pacific 3PL Market Analysis, Insights and Forecast, 2020-2032
- 9.1. Market Analysis, Insights and Forecast - by Service
- 9.1.1. Domestic Transportation Management
- 9.1.2. International Transportation Management
- 9.1.3. Value-added Warehousing and Distribution
- 9.2. Market Analysis, Insights and Forecast - by End User
- 9.2.1. Automobile
- 9.2.2. Energy
- 9.2.3. Manufacturing
- 9.2.4. Life Science and Healthcare
- 9.2.5. Retail Technology
- 9.2.6. Other End Users
- 9.1. Market Analysis, Insights and Forecast - by Service
- 10. Middle East and Africa 3PL Market Analysis, Insights and Forecast, 2020-2032
- 10.1. Market Analysis, Insights and Forecast - by Service
- 10.1.1. Domestic Transportation Management
- 10.1.2. International Transportation Management
- 10.1.3. Value-added Warehousing and Distribution
- 10.2. Market Analysis, Insights and Forecast - by End User
- 10.2.1. Automobile
- 10.2.2. Energy
- 10.2.3. Manufacturing
- 10.2.4. Life Science and Healthcare
- 10.2.5. Retail Technology
- 10.2.6. Other End Users
- 10.1. Market Analysis, Insights and Forecast - by Service
- 11. Europe 3PL Market Analysis, Insights and Forecast, 2020-2032
- 11.1. Market Analysis, Insights and Forecast - by Service
- 11.1.1. Domestic Transportation Management
- 11.1.2. International Transportation Management
- 11.1.3. Value-added Warehousing and Distribution
- 11.2. Market Analysis, Insights and Forecast - by End User
- 11.2.1. Automobile
- 11.2.2. Energy
- 11.2.3. Manufacturing
- 11.2.4. Life Science and Healthcare
- 11.2.5. Retail Technology
- 11.2.6. Other End Users
- 11.1. Market Analysis, Insights and Forecast - by Service
- 12. Competitive Analysis
- 12.1. Company Profiles
- 12.1.1 DB Schenker
- 12.1.1.1. Company Overview
- 12.1.1.2. Products
- 12.1.1.3. Company Financials
- 12.1.1.4. SWOT Analysis
- 12.1.2 DHL
- 12.1.2.1. Company Overview
- 12.1.2.2. Products
- 12.1.2.3. Company Financials
- 12.1.2.4. SWOT Analysis
- 12.1.3 Ceva Logistics
- 12.1.3.1. Company Overview
- 12.1.3.2. Products
- 12.1.3.3. Company Financials
- 12.1.3.4. SWOT Analysis
- 12.1.4 FedEx Corporation
- 12.1.4.1. Company Overview
- 12.1.4.2. Products
- 12.1.4.3. Company Financials
- 12.1.4.4. SWOT Analysis
- 12.1.5 AmeriCold Logistics
- 12.1.5.1. Company Overview
- 12.1.5.2. Products
- 12.1.5.3. Company Financials
- 12.1.5.4. SWOT Analysis
- 12.1.6 Nippon Express
- 12.1.6.1. Company Overview
- 12.1.6.2. Products
- 12.1.6.3. Company Financials
- 12.1.6.4. SWOT Analysis
- 12.1.7 Yusen Logistics
- 12.1.7.1. Company Overview
- 12.1.7.2. Products
- 12.1.7.3. Company Financials
- 12.1.7.4. SWOT Analysis
- 12.1.8 CH Robinson
- 12.1.8.1. Company Overview
- 12.1.8.2. Products
- 12.1.8.3. Company Financials
- 12.1.8.4. SWOT Analysis
- 12.1.9 Agility Logistics
- 12.1.9.1. Company Overview
- 12.1.9.2. Products
- 12.1.9.3. Company Financials
- 12.1.9.4. SWOT Analysis
- 12.1.10 Kuehne+Nagel Inc
- 12.1.10.1. Company Overview
- 12.1.10.2. Products
- 12.1.10.3. Company Financials
- 12.1.10.4. SWOT Analysis
- 12.1.11 Kerry Logistics
- 12.1.11.1. Company Overview
- 12.1.11.2. Products
- 12.1.11.3. Company Financials
- 12.1.11.4. SWOT Analysis
- 12.1.12 Panalpina
- 12.1.12.1. Company Overview
- 12.1.12.2. Products
- 12.1.12.3. Company Financials
- 12.1.12.4. SWOT Analysis
- 12.1.13 MAERSK
- 12.1.13.1. Company Overview
- 12.1.13.2. Products
- 12.1.13.3. Company Financials
- 12.1.13.4. SWOT Analysis
- 12.1.14 Geodis**List Not Exhaustive
- 12.1.14.1. Company Overview
- 12.1.14.2. Products
- 12.1.14.3. Company Financials
- 12.1.14.4. SWOT Analysis
- 12.1.15 DSV
- 12.1.15.1. Company Overview
- 12.1.15.2. Products
- 12.1.15.3. Company Financials
- 12.1.15.4. SWOT Analysis
- 12.1.1 DB Schenker
- 12.2. Market Entropy
- 12.2.1 Company's Key Areas Served
- 12.2.2 Recent Developments
- 12.3. Company Market Share Analysis 2025
- 12.3.1 Top 5 Companies Market Share Analysis
- 12.3.2 Top 3 Companies Market Share Analysis
- 12.4. List of Potential Customers
- 13. Research Methodology
List of Figures
- Figure 1: 3PL Market Revenue Breakdown (Million, %) by Product 2025 & 2033
- Figure 2: 3PL Market Share (%) by Company 2025
List of Tables
- Table 1: 3PL Market Revenue Million Forecast, by Service 2020 & 2033
- Table 2: 3PL Market Revenue Million Forecast, by End User 2020 & 2033
- Table 3: 3PL Market Revenue Million Forecast, by Region 2020 & 2033
- Table 4: 3PL Market Revenue Million Forecast, by Service 2020 & 2033
- Table 5: 3PL Market Revenue Million Forecast, by End User 2020 & 2033
- Table 6: 3PL Market Revenue Million Forecast, by Country 2020 & 2033
- Table 7: United States 3PL Market Revenue (Million) Forecast, by Application 2020 & 2033
- Table 8: Canada 3PL Market Revenue (Million) Forecast, by Application 2020 & 2033
- Table 9: Mexico 3PL Market Revenue (Million) Forecast, by Application 2020 & 2033
- Table 10: 3PL Market Revenue Million Forecast, by Service 2020 & 2033
- Table 11: 3PL Market Revenue Million Forecast, by End User 2020 & 2033
- Table 12: 3PL Market Revenue Million Forecast, by Country 2020 & 2033
- Table 13: Brazil 3PL Market Revenue (Million) Forecast, by Application 2020 & 2033
- Table 14: Argentina 3PL Market Revenue (Million) Forecast, by Application 2020 & 2033
- Table 15: Rest of South America 3PL Market Revenue (Million) Forecast, by Application 2020 & 2033
- Table 16: 3PL Market Revenue Million Forecast, by Service 2020 & 2033
- Table 17: 3PL Market Revenue Million Forecast, by End User 2020 & 2033
- Table 18: 3PL Market Revenue Million Forecast, by Country 2020 & 2033
- Table 19: India 3PL Market Revenue (Million) Forecast, by Application 2020 & 2033
- Table 20: China 3PL Market Revenue (Million) Forecast, by Application 2020 & 2033
- Table 21: Singapore 3PL Market Revenue (Million) Forecast, by Application 2020 & 2033
- Table 22: Japan 3PL Market Revenue (Million) Forecast, by Application 2020 & 2033
- Table 23: South Korea 3PL Market Revenue (Million) Forecast, by Application 2020 & 2033
- Table 24: Vietnam 3PL Market Revenue (Million) Forecast, by Application 2020 & 2033
- Table 25: Australia 3PL Market Revenue (Million) Forecast, by Application 2020 & 2033
- Table 26: Rest of Asia Pacific 3PL Market Revenue (Million) Forecast, by Application 2020 & 2033
- Table 27: 3PL Market Revenue Million Forecast, by Service 2020 & 2033
- Table 28: 3PL Market Revenue Million Forecast, by End User 2020 & 2033
- Table 29: 3PL Market Revenue Million Forecast, by Country 2020 & 2033
- Table 30: South Africa 3PL Market Revenue (Million) Forecast, by Application 2020 & 2033
- Table 31: United Arab Emirates 3PL Market Revenue (Million) Forecast, by Application 2020 & 2033
- Table 32: Saudi Arabia 3PL Market Revenue (Million) Forecast, by Application 2020 & 2033
- Table 33: Egypt 3PL Market Revenue (Million) Forecast, by Application 2020 & 2033
- Table 34: Rest of Middle East and Africa 3PL Market Revenue (Million) Forecast, by Application 2020 & 2033
- Table 35: 3PL Market Revenue Million Forecast, by Service 2020 & 2033
- Table 36: 3PL Market Revenue Million Forecast, by End User 2020 & 2033
- Table 37: 3PL Market Revenue Million Forecast, by Country 2020 & 2033
- Table 38: Germany 3PL Market Revenue (Million) Forecast, by Application 2020 & 2033
- Table 39: Spain 3PL Market Revenue (Million) Forecast, by Application 2020 & 2033
- Table 40: France 3PL Market Revenue (Million) Forecast, by Application 2020 & 2033
- Table 41: Russia 3PL Market Revenue (Million) Forecast, by Application 2020 & 2033
- Table 42: United Kingdom 3PL Market Revenue (Million) Forecast, by Application 2020 & 2033
- Table 43: Rest of Europe 3PL Market Revenue (Million) Forecast, by Application 2020 & 2033
Frequently Asked Questions
1. What is the projected Compound Annual Growth Rate (CAGR) of the 3PL Market?
The projected CAGR is approximately 5.48%.
2. Which companies are prominent players in the 3PL Market?
Key companies in the market include DB Schenker, DHL, Ceva Logistics, FedEx Corporation, AmeriCold Logistics, Nippon Express, Yusen Logistics, CH Robinson, Agility Logistics, Kuehne+Nagel Inc, Kerry Logistics, Panalpina, MAERSK, Geodis**List Not Exhaustive, DSV.
3. What are the main segments of the 3PL Market?
The market segments include Service, End User.
4. Can you provide details about the market size?
The market size is estimated to be USD 1.29 Million as of 2022.
5. What are some drivers contributing to market growth?
4.; Increasing volume of international trade4.; The rise of trade agreements between nations.
6. What are the notable trends driving market growth?
Growth in E-commerce Sales Driving the Market.
7. Are there any restraints impacting market growth?
4.; Surge in fuel costs affecting the market4.; Increasing trade tension.
8. Can you provide examples of recent developments in the market?
Dec 2022: SEKO Logistics established its first robotics partnership, with plans to "scale up" warehouse operations with GreyOrange's Ranger Assist Bots. SEKO will deploy 15 bots in one of its Milton Keynes, UK, during the first stage of the plan. Another 35 robots will be installed early next year. The logistics company intends to expand the bot initiative beyond the UK next year, with the Netherlands as the first location.
9. What pricing options are available for accessing the report?
Pricing options include single-user, multi-user, and enterprise licenses priced at USD 3800, USD 4500, and USD 5800 respectively.
10. Is the market size provided in terms of value or volume?
The market size is provided in terms of value, measured in Million.
11. Are there any specific market keywords associated with the report?
Yes, the market keyword associated with the report is "3PL Market," which aids in identifying and referencing the specific market segment covered.
12. How do I determine which pricing option suits my needs best?
The pricing options vary based on user requirements and access needs. Individual users may opt for single-user licenses, while businesses requiring broader access may choose multi-user or enterprise licenses for cost-effective access to the report.
13. Are there any additional resources or data provided in the 3PL Market report?
While the report offers comprehensive insights, it's advisable to review the specific contents or supplementary materials provided to ascertain if additional resources or data are available.
14. How can I stay updated on further developments or reports in the 3PL Market?
To stay informed about further developments, trends, and reports in the 3PL Market, consider subscribing to industry newsletters, following relevant companies and organizations, or regularly checking reputable industry news sources and publications.
Methodology
Step 1 - Identification of Relevant Samples Size from Population Database


Step 2 - Approaches for Defining Global Market Size (Value, Volume* & Price*)

Note*: In applicable scenarios
Step 3 - Data Sources
Primary Research
- Web Analytics
- Survey Reports
- Research Institute
- Latest Research Reports
- Opinion Leaders
Secondary Research
- Annual Reports
- White Paper
- Latest Press Release
- Industry Association
- Paid Database
- Investor Presentations

Step 4 - Data Triangulation
Involves using different sources of information in order to increase the validity of a study
These sources are likely to be stakeholders in a program - participants, other researchers, program staff, other community members, and so on.
Then we put all data in single framework & apply various statistical tools to find out the dynamic on the market.
During the analysis stage, feedback from the stakeholder groups would be compared to determine areas of agreement as well as areas of divergence