

Key Insights
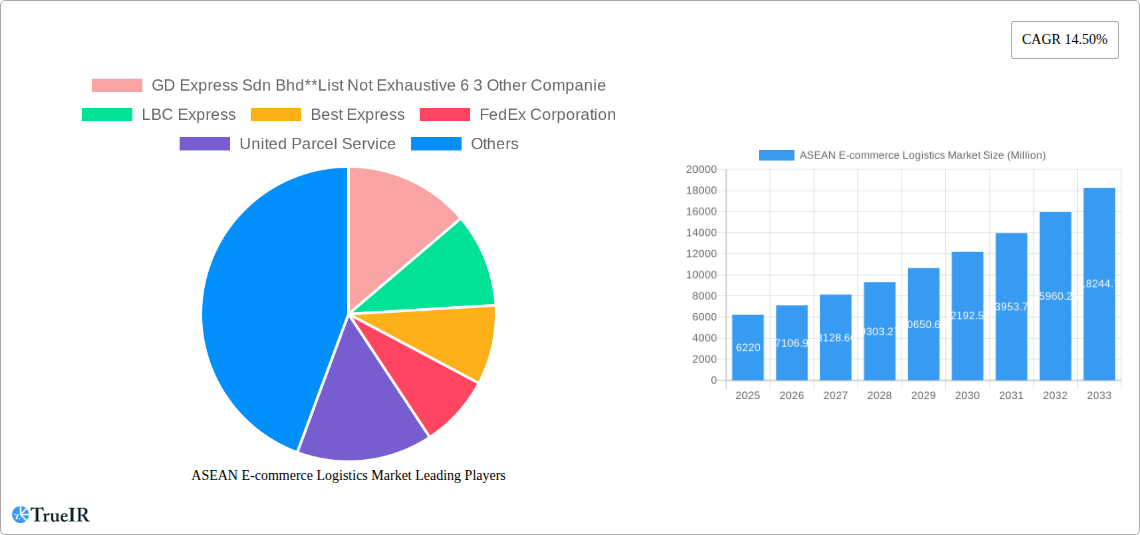
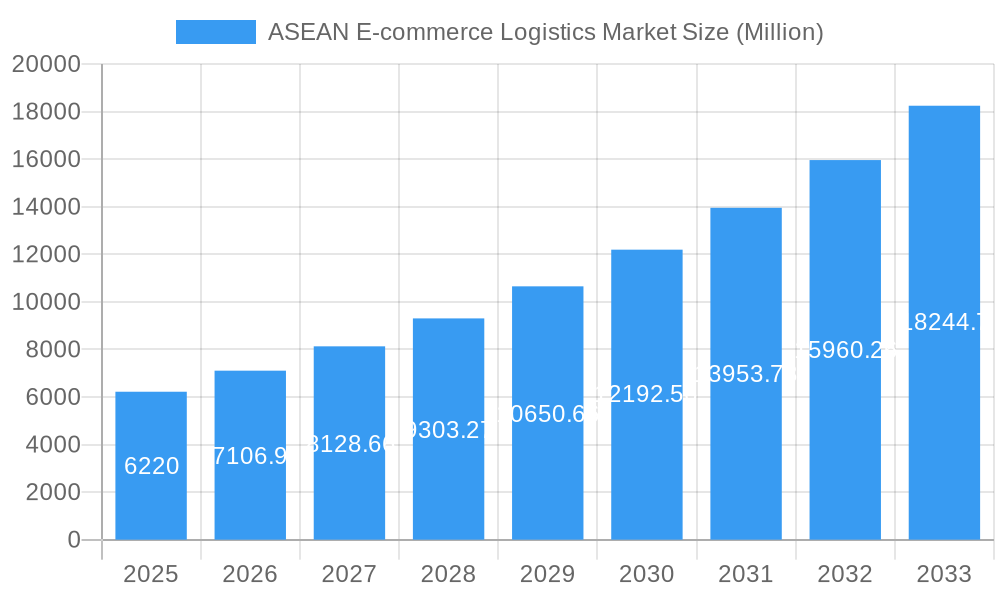
The ASEAN e-commerce logistics market, valued at $6.22 billion in 2025, is experiencing robust growth, projected to expand at a compound annual growth rate (CAGR) of 14.50% from 2025 to 2033. This surge is driven by several key factors. The burgeoning e-commerce sector across the region, fueled by rising internet and smartphone penetration, coupled with a growing middle class and increased consumer spending, is a significant catalyst. Furthermore, the increasing adoption of advanced technologies, such as artificial intelligence (AI) and machine learning (ML) in logistics and supply chain management, is streamlining operations and enhancing efficiency. Improved infrastructure, including better transportation networks and warehousing facilities, also plays a crucial role in supporting the market's expansion. While challenges remain, such as geographical limitations and varying regulatory environments across different ASEAN countries, the overall market outlook remains strongly positive. The dominance of B2C transactions underscores the significant consumer-driven nature of the growth. Product categories like fashion and apparel, consumer electronics, and home appliances contribute significantly to the market volume. Key players like GD Express, LBC Express, and J&T Express are well-positioned to capitalize on this growth, facing competition from international giants like FedEx and DHL. The market segmentation by service (transportation, warehousing, value-added services) and destination (domestic, international) further reveals opportunities for specialized logistics providers catering to specific needs.
ASEAN E-commerce Logistics Market Market Size (In Billion)
The continued growth of the ASEAN e-commerce logistics market hinges on several key factors. Sustained investment in infrastructure development across the region will be critical to facilitate efficient movement of goods. Government initiatives promoting digitalization and e-commerce adoption will further stimulate market growth. Furthermore, the ongoing evolution of logistics technologies, including the integration of blockchain for enhanced transparency and security, promises to optimize supply chains and improve overall efficiency. Competition will likely intensify as both regional and international players vie for market share, leading to innovation and further price optimization for consumers. A strategic focus on addressing the logistical challenges specific to the diverse geographical landscape and regulatory frameworks of the ASEAN region will be key to maximizing market potential. The increasing emphasis on sustainability within the logistics sector, driving demand for eco-friendly solutions, also presents a growing market opportunity for businesses willing to adapt.
ASEAN E-commerce Logistics Market Company Market Share
ASEAN E-commerce Logistics Market: A Comprehensive Report (2019-2033)
This dynamic report provides an in-depth analysis of the burgeoning ASEAN e-commerce logistics market, projecting robust growth from 2025 to 2033. Leveraging extensive data from 2019-2024, this study offers invaluable insights for businesses seeking to capitalize on this rapidly expanding sector. The report delves into market segmentation, competitive dynamics, key players, and future trends, providing a complete picture of this critical industry. Expect detailed analysis across all major ASEAN countries, encompassing domestic and cross-border logistics, and across various product categories.
ASEAN E-commerce Logistics Market Structure & Competitive Landscape
The ASEAN e-commerce logistics market exhibits a moderately concentrated structure, with a few dominant players and numerous smaller, specialized firms. The market's Herfindahl-Hirschman Index (HHI) in 2024 was estimated at xx, indicating a xx level of concentration. This is driven by significant investments from both established international players like FedEx Corporation and United Parcel Service and rapidly expanding regional players such as J&T Express and Ninja Van. Innovation is a key driver, with companies constantly investing in technological advancements such as automated warehousing and AI-powered route optimization. Government regulations, varying across ASEAN nations, impact operational costs and efficiency. Substitutes include individual delivery services, though these lack the scale and reliability of established logistics providers. The market showcases substantial end-user segmentation, catering to both B2B and B2C businesses, with a notable shift towards B2C driven by the explosive growth of online shopping. M&A activity is prevalent, with xx Million in transactions recorded between 2020 and 2024, primarily focused on expanding geographic reach and enhancing service offerings.
- Market Concentration: HHI of xx in 2024, indicating a xx level of concentration.
- Innovation Drivers: Automation, AI-powered route optimization, and advanced tracking systems.
- Regulatory Impact: Varies across ASEAN countries, impacting operational costs and compliance.
- Product Substitutes: Individual delivery services, though less efficient and scalable.
- End-User Segmentation: B2B and B2C, with significant growth in B2C.
- M&A Trends: xx Million in transactions (2020-2024), focused on expansion and service enhancement.
ASEAN E-commerce Logistics Market Trends & Opportunities
The ASEAN e-commerce logistics market is experiencing phenomenal growth, with a projected Compound Annual Growth Rate (CAGR) of xx% from 2025 to 2033. The market size is expected to reach xx Million by 2033, driven by rising internet and smartphone penetration, increased consumer spending power, and government initiatives promoting digitalization. Technological advancements, including the widespread adoption of e-commerce platforms, mobile payments, and sophisticated logistics technologies, are significantly accelerating market expansion. Changing consumer preferences towards convenience and speed fuel the demand for faster and more reliable delivery options. Intense competition among logistics providers fosters innovation and drives down prices, ultimately benefitting consumers. Market penetration rates vary significantly across ASEAN countries, with more mature e-commerce markets like Singapore and Thailand exhibiting higher penetration than others.
Dominant Markets & Segments in ASEAN E-commerce Logistics Market
Indonesia currently holds the largest market share within the ASEAN region, driven by its substantial population and rapidly expanding e-commerce sector. The B2C segment dominates overall market volume, propelled by the surge in online shopping. The transportation segment holds the largest share within the services category, highlighting the vital role of efficient delivery networks. Domestic logistics currently outweighs international/cross-border shipments, although the latter is expected to experience significant growth. High-growth product categories include fashion and apparel, consumer electronics, and beauty and personal care products.
- Leading Region/Country: Indonesia
- Dominant Segment (Business): B2C
- Dominant Segment (Service): Transportation
- Dominant Segment (Destination): Domestic
- High-Growth Product Categories: Fashion & Apparel, Consumer Electronics, Beauty & Personal Care
Key Growth Drivers:
- Indonesia: Rising middle class, increasing smartphone penetration, supportive government policies.
- B2C: Growing preference for online shopping, convenience, and wider product selection.
- Transportation: Essential for delivering goods to consumers, driving market demand.
- Domestic: Lower costs, faster delivery times compared to international shipping.
- Specific Products: High demand fueled by affordability, convenience, and trend-driven purchases.
ASEAN E-commerce Logistics Market Product Analysis
Product innovation within ASEAN e-commerce logistics centers around technological advancements in tracking, automated warehousing, and last-mile delivery solutions. Companies are investing heavily in route optimization software, using AI and machine learning to improve efficiency. The market shows a strong preference for integrated solutions, combining transportation, warehousing, and value-added services (packaging, labeling) to create seamless end-to-end delivery experiences. The success of these products depends on scalability, reliability, cost-effectiveness, and integration with existing e-commerce platforms.
Key Drivers, Barriers & Challenges in ASEAN E-commerce Logistics Market
Key Drivers: Rapid growth of e-commerce, increasing internet penetration, rising disposable incomes, supportive government policies, and technological advancements. The implementation of digital payment systems further enhances ease and speed of transactions.
Challenges and Restraints: Inadequate infrastructure in some regions hampers efficient delivery, particularly in remote areas. Regulatory inconsistencies across different ASEAN countries pose operational complexities. Competition among established and emerging players intensifies pricing pressure, impacting profit margins. Supply chain disruptions (e.g., port congestion, natural disasters) can cause significant delays and cost increases. The average cost increase due to supply chain disruptions in 2024 was estimated at xx Million.
Growth Drivers in the ASEAN E-commerce Logistics Market
The key drivers are expanding e-commerce adoption, rising internet and smartphone penetration, increasing middle-class populations, and government support for digital economies. Technological advancements, such as improved tracking systems and AI-powered logistics solutions, are also crucial. The emergence of cross-border e-commerce further fuels this growth.
Challenges Impacting ASEAN E-commerce Logistics Market Growth
Challenges include infrastructure limitations in certain areas, regulatory fragmentation across ASEAN countries, and intense competition. Supply chain vulnerabilities and cybersecurity concerns also pose significant risks. The lack of skilled workforce in some countries hampers efficient operations.
Key Players Shaping the ASEAN E-commerce Logistics Market
- GD Express Sdn Bhd
- LBC Express
- Best Express
- FedEx Corporation (FedEx)
- United Parcel Service (UPS)
- J&T Express
- PT Global Jet Express (J&T Express)
- Giao Hang Nhanh
- PT Citra Van Titipan Kilat (TIKI)
- PT Jalur Nugraha Ekakurir (JNE Express)
- Deutsche Post DHL Group (DHL)
- Kerry Express
- Ninja Van
- Flash Express
- Pos Indonesia
Significant ASEAN E-commerce Logistics Market Industry Milestones
- 2020: Significant surge in e-commerce during the COVID-19 pandemic.
- 2021: Increased investment in logistics technology and infrastructure.
- 2022: Launch of several new e-commerce platforms.
- 2023: Several mergers and acquisitions within the industry to expand market share.
- 2024: Government initiatives in several ASEAN countries to improve logistics efficiency.
Future Outlook for ASEAN E-commerce Logistics Market
The ASEAN e-commerce logistics market is poised for sustained growth, driven by continued e-commerce expansion, technological innovations, and rising consumer expectations. Strategic opportunities lie in investing in advanced logistics technology, developing robust cross-border delivery solutions, and expanding into underserved markets. The market's potential is vast, particularly in smaller ASEAN countries with less developed e-commerce infrastructure. This presents significant opportunities for both established and emerging logistics players to capture market share and drive innovation in the years to come.
ASEAN E-commerce Logistics Market Segmentation
-
1. Service
- 1.1. Transportation
- 1.2. Warehousing and Inventory Management
- 1.3. Value-added Services (Labeling, Packaging, etc.)
-
2. Business
- 2.1. B2B (Business-to-Business)
- 2.2. B2C (Business-to-Consumer)
-
3. Destination
- 3.1. Domestic
- 3.2. International/Cross-border
-
4. Product
- 4.1. Fashion and Apparel
- 4.2. Consumer Electronics
- 4.3. Home Appliances
- 4.4. Furniture
- 4.5. Beauty and Personal Care Products
- 4.6. Other Products (Toys, Food Products, etc.)
ASEAN E-commerce Logistics Market Segmentation By Geography
-
1. North America
- 1.1. United States
- 1.2. Canada
- 1.3. Mexico
-
2. South America
- 2.1. Brazil
- 2.2. Argentina
- 2.3. Rest of South America
-
3. Europe
- 3.1. United Kingdom
- 3.2. Germany
- 3.3. France
- 3.4. Italy
- 3.5. Spain
- 3.6. Russia
- 3.7. Benelux
- 3.8. Nordics
- 3.9. Rest of Europe
-
4. Middle East & Africa
- 4.1. Turkey
- 4.2. Israel
- 4.3. GCC
- 4.4. North Africa
- 4.5. South Africa
- 4.6. Rest of Middle East & Africa
-
5. Asia Pacific
- 5.1. China
- 5.2. India
- 5.3. Japan
- 5.4. South Korea
- 5.5. ASEAN
- 5.6. Oceania
- 5.7. Rest of Asia Pacific
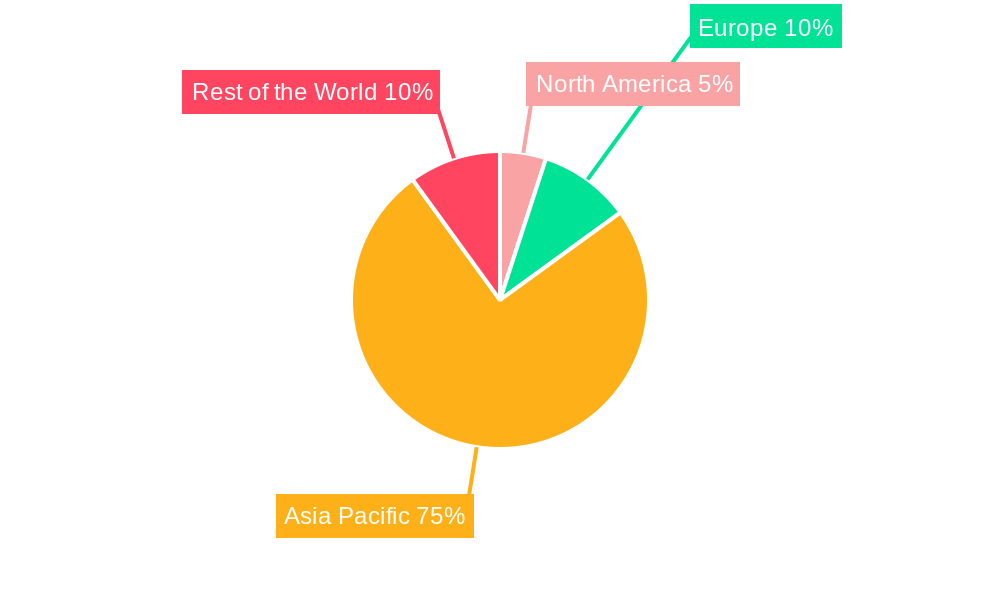
ASEAN E-commerce Logistics Market Regional Market Share
Geographic Coverage of ASEAN E-commerce Logistics Market
ASEAN E-commerce Logistics Market REPORT HIGHLIGHTS
| Aspects | Details |
|---|---|
| Study Period | 2020-2034 |
| Base Year | 2025 |
| Estimated Year | 2026 |
| Forecast Period | 2026-2034 |
| Historical Period | 2020-2025 |
| Growth Rate | CAGR of 14.50% from 2020-2034 |
| Segmentation |
|
Table of Contents
- 1. Introduction
- 1.1. Research Scope
- 1.2. Market Segmentation
- 1.3. Research Objective
- 1.4. Definitions and Assumptions
- 2. Executive Summary
- 2.1. Market Snapshot
- 3. Market Dynamics
- 3.1. Market Drivers
- 3.2. Market Restrains
- 3.3. Market Trends
- 3.4. Market Opportunities
- 4. Market Factor Analysis
- 4.1. Porters Five Forces
- 4.1.1. Bargaining Power of Suppliers
- 4.1.2. Bargaining Power of Buyers
- 4.1.3. Threat of New Entrants
- 4.1.4. Threat of Substitutes
- 4.1.5. Competitive Rivalry
- 4.2. PESTEL analysis
- 4.3. BCG Analysis
- 4.3.1. Stars (High Growth, High Market Share)
- 4.3.2. Cash Cows (Low Growth, High Market Share)
- 4.3.3. Question Mark (High Growth, Low Market Share)
- 4.3.4. Dogs (Low Growth, Low Market Share)
- 4.4. Ansoff Matrix Analysis
- 4.5. Supply Chain Analysis
- 4.6. Regulatory Landscape
- 4.7. Current Market Potential and Opportunity Assessment (TAM–SAM–SOM Framework)
- 4.8. TIR Analyst Note
- 4.1. Porters Five Forces
- 5. Market Analysis, Insights and Forecast 2021-2033
- 5.1. Market Analysis, Insights and Forecast - by Service
- 5.1.1. Transportation
- 5.1.2. Warehousing and Inventory Management
- 5.1.3. Value-added Services (Labeling, Packaging, etc.)
- 5.2. Market Analysis, Insights and Forecast - by Business
- 5.2.1. B2B (Business-to-Business)
- 5.2.2. B2C (Business-to-Consumer)
- 5.3. Market Analysis, Insights and Forecast - by Destination
- 5.3.1. Domestic
- 5.3.2. International/Cross-border
- 5.4. Market Analysis, Insights and Forecast - by Product
- 5.4.1. Fashion and Apparel
- 5.4.2. Consumer Electronics
- 5.4.3. Home Appliances
- 5.4.4. Furniture
- 5.4.5. Beauty and Personal Care Products
- 5.4.6. Other Products (Toys, Food Products, etc.)
- 5.5. Market Analysis, Insights and Forecast - by Region
- 5.5.1. North America
- 5.5.2. South America
- 5.5.3. Europe
- 5.5.4. Middle East & Africa
- 5.5.5. Asia Pacific
- 5.1. Market Analysis, Insights and Forecast - by Service
- 6. Global ASEAN E-commerce Logistics Market Analysis, Insights and Forecast, 2021-2033
- 6.1. Market Analysis, Insights and Forecast - by Service
- 6.1.1. Transportation
- 6.1.2. Warehousing and Inventory Management
- 6.1.3. Value-added Services (Labeling, Packaging, etc.)
- 6.2. Market Analysis, Insights and Forecast - by Business
- 6.2.1. B2B (Business-to-Business)
- 6.2.2. B2C (Business-to-Consumer)
- 6.3. Market Analysis, Insights and Forecast - by Destination
- 6.3.1. Domestic
- 6.3.2. International/Cross-border
- 6.4. Market Analysis, Insights and Forecast - by Product
- 6.4.1. Fashion and Apparel
- 6.4.2. Consumer Electronics
- 6.4.3. Home Appliances
- 6.4.4. Furniture
- 6.4.5. Beauty and Personal Care Products
- 6.4.6. Other Products (Toys, Food Products, etc.)
- 6.1. Market Analysis, Insights and Forecast - by Service
- 7. North America ASEAN E-commerce Logistics Market Analysis, Insights and Forecast, 2020-2032
- 7.1. Market Analysis, Insights and Forecast - by Service
- 7.1.1. Transportation
- 7.1.2. Warehousing and Inventory Management
- 7.1.3. Value-added Services (Labeling, Packaging, etc.)
- 7.2. Market Analysis, Insights and Forecast - by Business
- 7.2.1. B2B (Business-to-Business)
- 7.2.2. B2C (Business-to-Consumer)
- 7.3. Market Analysis, Insights and Forecast - by Destination
- 7.3.1. Domestic
- 7.3.2. International/Cross-border
- 7.4. Market Analysis, Insights and Forecast - by Product
- 7.4.1. Fashion and Apparel
- 7.4.2. Consumer Electronics
- 7.4.3. Home Appliances
- 7.4.4. Furniture
- 7.4.5. Beauty and Personal Care Products
- 7.4.6. Other Products (Toys, Food Products, etc.)
- 7.1. Market Analysis, Insights and Forecast - by Service
- 8. South America ASEAN E-commerce Logistics Market Analysis, Insights and Forecast, 2020-2032
- 8.1. Market Analysis, Insights and Forecast - by Service
- 8.1.1. Transportation
- 8.1.2. Warehousing and Inventory Management
- 8.1.3. Value-added Services (Labeling, Packaging, etc.)
- 8.2. Market Analysis, Insights and Forecast - by Business
- 8.2.1. B2B (Business-to-Business)
- 8.2.2. B2C (Business-to-Consumer)
- 8.3. Market Analysis, Insights and Forecast - by Destination
- 8.3.1. Domestic
- 8.3.2. International/Cross-border
- 8.4. Market Analysis, Insights and Forecast - by Product
- 8.4.1. Fashion and Apparel
- 8.4.2. Consumer Electronics
- 8.4.3. Home Appliances
- 8.4.4. Furniture
- 8.4.5. Beauty and Personal Care Products
- 8.4.6. Other Products (Toys, Food Products, etc.)
- 8.1. Market Analysis, Insights and Forecast - by Service
- 9. Europe ASEAN E-commerce Logistics Market Analysis, Insights and Forecast, 2020-2032
- 9.1. Market Analysis, Insights and Forecast - by Service
- 9.1.1. Transportation
- 9.1.2. Warehousing and Inventory Management
- 9.1.3. Value-added Services (Labeling, Packaging, etc.)
- 9.2. Market Analysis, Insights and Forecast - by Business
- 9.2.1. B2B (Business-to-Business)
- 9.2.2. B2C (Business-to-Consumer)
- 9.3. Market Analysis, Insights and Forecast - by Destination
- 9.3.1. Domestic
- 9.3.2. International/Cross-border
- 9.4. Market Analysis, Insights and Forecast - by Product
- 9.4.1. Fashion and Apparel
- 9.4.2. Consumer Electronics
- 9.4.3. Home Appliances
- 9.4.4. Furniture
- 9.4.5. Beauty and Personal Care Products
- 9.4.6. Other Products (Toys, Food Products, etc.)
- 9.1. Market Analysis, Insights and Forecast - by Service
- 10. Middle East & Africa ASEAN E-commerce Logistics Market Analysis, Insights and Forecast, 2020-2032
- 10.1. Market Analysis, Insights and Forecast - by Service
- 10.1.1. Transportation
- 10.1.2. Warehousing and Inventory Management
- 10.1.3. Value-added Services (Labeling, Packaging, etc.)
- 10.2. Market Analysis, Insights and Forecast - by Business
- 10.2.1. B2B (Business-to-Business)
- 10.2.2. B2C (Business-to-Consumer)
- 10.3. Market Analysis, Insights and Forecast - by Destination
- 10.3.1. Domestic
- 10.3.2. International/Cross-border
- 10.4. Market Analysis, Insights and Forecast - by Product
- 10.4.1. Fashion and Apparel
- 10.4.2. Consumer Electronics
- 10.4.3. Home Appliances
- 10.4.4. Furniture
- 10.4.5. Beauty and Personal Care Products
- 10.4.6. Other Products (Toys, Food Products, etc.)
- 10.1. Market Analysis, Insights and Forecast - by Service
- 11. Asia Pacific ASEAN E-commerce Logistics Market Analysis, Insights and Forecast, 2020-2032
- 11.1. Market Analysis, Insights and Forecast - by Service
- 11.1.1. Transportation
- 11.1.2. Warehousing and Inventory Management
- 11.1.3. Value-added Services (Labeling, Packaging, etc.)
- 11.2. Market Analysis, Insights and Forecast - by Business
- 11.2.1. B2B (Business-to-Business)
- 11.2.2. B2C (Business-to-Consumer)
- 11.3. Market Analysis, Insights and Forecast - by Destination
- 11.3.1. Domestic
- 11.3.2. International/Cross-border
- 11.4. Market Analysis, Insights and Forecast - by Product
- 11.4.1. Fashion and Apparel
- 11.4.2. Consumer Electronics
- 11.4.3. Home Appliances
- 11.4.4. Furniture
- 11.4.5. Beauty and Personal Care Products
- 11.4.6. Other Products (Toys, Food Products, etc.)
- 11.1. Market Analysis, Insights and Forecast - by Service
- 12. Competitive Analysis
- 12.1. Company Profiles
- 12.1.1 GD Express Sdn Bhd**List Not Exhaustive 6 3 Other Companie
- 12.1.1.1. Company Overview
- 12.1.1.2. Products
- 12.1.1.3. Company Financials
- 12.1.1.4. SWOT Analysis
- 12.1.2 LBC Express
- 12.1.2.1. Company Overview
- 12.1.2.2. Products
- 12.1.2.3. Company Financials
- 12.1.2.4. SWOT Analysis
- 12.1.3 Best Express
- 12.1.3.1. Company Overview
- 12.1.3.2. Products
- 12.1.3.3. Company Financials
- 12.1.3.4. SWOT Analysis
- 12.1.4 FedEx Corporation
- 12.1.4.1. Company Overview
- 12.1.4.2. Products
- 12.1.4.3. Company Financials
- 12.1.4.4. SWOT Analysis
- 12.1.5 United Parcel Service
- 12.1.5.1. Company Overview
- 12.1.5.2. Products
- 12.1.5.3. Company Financials
- 12.1.5.4. SWOT Analysis
- 12.1.6 J&T Express
- 12.1.6.1. Company Overview
- 12.1.6.2. Products
- 12.1.6.3. Company Financials
- 12.1.6.4. SWOT Analysis
- 12.1.7 PT Global Jet Express (J&T Express)
- 12.1.7.1. Company Overview
- 12.1.7.2. Products
- 12.1.7.3. Company Financials
- 12.1.7.4. SWOT Analysis
- 12.1.8 Giao Hang Nhanh
- 12.1.8.1. Company Overview
- 12.1.8.2. Products
- 12.1.8.3. Company Financials
- 12.1.8.4. SWOT Analysis
- 12.1.9 PT Citra Van Titipan Kilat (TIKI)
- 12.1.9.1. Company Overview
- 12.1.9.2. Products
- 12.1.9.3. Company Financials
- 12.1.9.4. SWOT Analysis
- 12.1.10 PT Jalur Nugraha Ekakurir (JNE Express)
- 12.1.10.1. Company Overview
- 12.1.10.2. Products
- 12.1.10.3. Company Financials
- 12.1.10.4. SWOT Analysis
- 12.1.11 Deutsche Post DHL Group
- 12.1.11.1. Company Overview
- 12.1.11.2. Products
- 12.1.11.3. Company Financials
- 12.1.11.4. SWOT Analysis
- 12.1.12 Kerry Express
- 12.1.12.1. Company Overview
- 12.1.12.2. Products
- 12.1.12.3. Company Financials
- 12.1.12.4. SWOT Analysis
- 12.1.13 Ninja Van
- 12.1.13.1. Company Overview
- 12.1.13.2. Products
- 12.1.13.3. Company Financials
- 12.1.13.4. SWOT Analysis
- 12.1.14 Flash Express
- 12.1.14.1. Company Overview
- 12.1.14.2. Products
- 12.1.14.3. Company Financials
- 12.1.14.4. SWOT Analysis
- 12.1.15 Pos Indonesia
- 12.1.15.1. Company Overview
- 12.1.15.2. Products
- 12.1.15.3. Company Financials
- 12.1.15.4. SWOT Analysis
- 12.1.1 GD Express Sdn Bhd**List Not Exhaustive 6 3 Other Companie
- 12.2. Market Entropy
- 12.2.1 Company's Key Areas Served
- 12.2.2 Recent Developments
- 12.3. Company Market Share Analysis 2025
- 12.3.1 Top 5 Companies Market Share Analysis
- 12.3.2 Top 3 Companies Market Share Analysis
- 12.4. List of Potential Customers
- 13. Research Methodology
List of Figures
- Figure 1: Global ASEAN E-commerce Logistics Market Revenue Breakdown (Million, %) by Region 2025 & 2033
- Figure 2: North America ASEAN E-commerce Logistics Market Revenue (Million), by Service 2025 & 2033
- Figure 3: North America ASEAN E-commerce Logistics Market Revenue Share (%), by Service 2025 & 2033
- Figure 4: North America ASEAN E-commerce Logistics Market Revenue (Million), by Business 2025 & 2033
- Figure 5: North America ASEAN E-commerce Logistics Market Revenue Share (%), by Business 2025 & 2033
- Figure 6: North America ASEAN E-commerce Logistics Market Revenue (Million), by Destination 2025 & 2033
- Figure 7: North America ASEAN E-commerce Logistics Market Revenue Share (%), by Destination 2025 & 2033
- Figure 8: North America ASEAN E-commerce Logistics Market Revenue (Million), by Product 2025 & 2033
- Figure 9: North America ASEAN E-commerce Logistics Market Revenue Share (%), by Product 2025 & 2033
- Figure 10: North America ASEAN E-commerce Logistics Market Revenue (Million), by Country 2025 & 2033
- Figure 11: North America ASEAN E-commerce Logistics Market Revenue Share (%), by Country 2025 & 2033
- Figure 12: South America ASEAN E-commerce Logistics Market Revenue (Million), by Service 2025 & 2033
- Figure 13: South America ASEAN E-commerce Logistics Market Revenue Share (%), by Service 2025 & 2033
- Figure 14: South America ASEAN E-commerce Logistics Market Revenue (Million), by Business 2025 & 2033
- Figure 15: South America ASEAN E-commerce Logistics Market Revenue Share (%), by Business 2025 & 2033
- Figure 16: South America ASEAN E-commerce Logistics Market Revenue (Million), by Destination 2025 & 2033
- Figure 17: South America ASEAN E-commerce Logistics Market Revenue Share (%), by Destination 2025 & 2033
- Figure 18: South America ASEAN E-commerce Logistics Market Revenue (Million), by Product 2025 & 2033
- Figure 19: South America ASEAN E-commerce Logistics Market Revenue Share (%), by Product 2025 & 2033
- Figure 20: South America ASEAN E-commerce Logistics Market Revenue (Million), by Country 2025 & 2033
- Figure 21: South America ASEAN E-commerce Logistics Market Revenue Share (%), by Country 2025 & 2033
- Figure 22: Europe ASEAN E-commerce Logistics Market Revenue (Million), by Service 2025 & 2033
- Figure 23: Europe ASEAN E-commerce Logistics Market Revenue Share (%), by Service 2025 & 2033
- Figure 24: Europe ASEAN E-commerce Logistics Market Revenue (Million), by Business 2025 & 2033
- Figure 25: Europe ASEAN E-commerce Logistics Market Revenue Share (%), by Business 2025 & 2033
- Figure 26: Europe ASEAN E-commerce Logistics Market Revenue (Million), by Destination 2025 & 2033
- Figure 27: Europe ASEAN E-commerce Logistics Market Revenue Share (%), by Destination 2025 & 2033
- Figure 28: Europe ASEAN E-commerce Logistics Market Revenue (Million), by Product 2025 & 2033
- Figure 29: Europe ASEAN E-commerce Logistics Market Revenue Share (%), by Product 2025 & 2033
- Figure 30: Europe ASEAN E-commerce Logistics Market Revenue (Million), by Country 2025 & 2033
- Figure 31: Europe ASEAN E-commerce Logistics Market Revenue Share (%), by Country 2025 & 2033
- Figure 32: Middle East & Africa ASEAN E-commerce Logistics Market Revenue (Million), by Service 2025 & 2033
- Figure 33: Middle East & Africa ASEAN E-commerce Logistics Market Revenue Share (%), by Service 2025 & 2033
- Figure 34: Middle East & Africa ASEAN E-commerce Logistics Market Revenue (Million), by Business 2025 & 2033
- Figure 35: Middle East & Africa ASEAN E-commerce Logistics Market Revenue Share (%), by Business 2025 & 2033
- Figure 36: Middle East & Africa ASEAN E-commerce Logistics Market Revenue (Million), by Destination 2025 & 2033
- Figure 37: Middle East & Africa ASEAN E-commerce Logistics Market Revenue Share (%), by Destination 2025 & 2033
- Figure 38: Middle East & Africa ASEAN E-commerce Logistics Market Revenue (Million), by Product 2025 & 2033
- Figure 39: Middle East & Africa ASEAN E-commerce Logistics Market Revenue Share (%), by Product 2025 & 2033
- Figure 40: Middle East & Africa ASEAN E-commerce Logistics Market Revenue (Million), by Country 2025 & 2033
- Figure 41: Middle East & Africa ASEAN E-commerce Logistics Market Revenue Share (%), by Country 2025 & 2033
- Figure 42: Asia Pacific ASEAN E-commerce Logistics Market Revenue (Million), by Service 2025 & 2033
- Figure 43: Asia Pacific ASEAN E-commerce Logistics Market Revenue Share (%), by Service 2025 & 2033
- Figure 44: Asia Pacific ASEAN E-commerce Logistics Market Revenue (Million), by Business 2025 & 2033
- Figure 45: Asia Pacific ASEAN E-commerce Logistics Market Revenue Share (%), by Business 2025 & 2033
- Figure 46: Asia Pacific ASEAN E-commerce Logistics Market Revenue (Million), by Destination 2025 & 2033
- Figure 47: Asia Pacific ASEAN E-commerce Logistics Market Revenue Share (%), by Destination 2025 & 2033
- Figure 48: Asia Pacific ASEAN E-commerce Logistics Market Revenue (Million), by Product 2025 & 2033
- Figure 49: Asia Pacific ASEAN E-commerce Logistics Market Revenue Share (%), by Product 2025 & 2033
- Figure 50: Asia Pacific ASEAN E-commerce Logistics Market Revenue (Million), by Country 2025 & 2033
- Figure 51: Asia Pacific ASEAN E-commerce Logistics Market Revenue Share (%), by Country 2025 & 2033
List of Tables
- Table 1: Global ASEAN E-commerce Logistics Market Revenue Million Forecast, by Service 2020 & 2033
- Table 2: Global ASEAN E-commerce Logistics Market Revenue Million Forecast, by Business 2020 & 2033
- Table 3: Global ASEAN E-commerce Logistics Market Revenue Million Forecast, by Destination 2020 & 2033
- Table 4: Global ASEAN E-commerce Logistics Market Revenue Million Forecast, by Product 2020 & 2033
- Table 5: Global ASEAN E-commerce Logistics Market Revenue Million Forecast, by Region 2020 & 2033
- Table 6: Global ASEAN E-commerce Logistics Market Revenue Million Forecast, by Service 2020 & 2033
- Table 7: Global ASEAN E-commerce Logistics Market Revenue Million Forecast, by Business 2020 & 2033
- Table 8: Global ASEAN E-commerce Logistics Market Revenue Million Forecast, by Destination 2020 & 2033
- Table 9: Global ASEAN E-commerce Logistics Market Revenue Million Forecast, by Product 2020 & 2033
- Table 10: Global ASEAN E-commerce Logistics Market Revenue Million Forecast, by Country 2020 & 2033
- Table 11: United States ASEAN E-commerce Logistics Market Revenue (Million) Forecast, by Application 2020 & 2033
- Table 12: Canada ASEAN E-commerce Logistics Market Revenue (Million) Forecast, by Application 2020 & 2033
- Table 13: Mexico ASEAN E-commerce Logistics Market Revenue (Million) Forecast, by Application 2020 & 2033
- Table 14: Global ASEAN E-commerce Logistics Market Revenue Million Forecast, by Service 2020 & 2033
- Table 15: Global ASEAN E-commerce Logistics Market Revenue Million Forecast, by Business 2020 & 2033
- Table 16: Global ASEAN E-commerce Logistics Market Revenue Million Forecast, by Destination 2020 & 2033
- Table 17: Global ASEAN E-commerce Logistics Market Revenue Million Forecast, by Product 2020 & 2033
- Table 18: Global ASEAN E-commerce Logistics Market Revenue Million Forecast, by Country 2020 & 2033
- Table 19: Brazil ASEAN E-commerce Logistics Market Revenue (Million) Forecast, by Application 2020 & 2033
- Table 20: Argentina ASEAN E-commerce Logistics Market Revenue (Million) Forecast, by Application 2020 & 2033
- Table 21: Rest of South America ASEAN E-commerce Logistics Market Revenue (Million) Forecast, by Application 2020 & 2033
- Table 22: Global ASEAN E-commerce Logistics Market Revenue Million Forecast, by Service 2020 & 2033
- Table 23: Global ASEAN E-commerce Logistics Market Revenue Million Forecast, by Business 2020 & 2033
- Table 24: Global ASEAN E-commerce Logistics Market Revenue Million Forecast, by Destination 2020 & 2033
- Table 25: Global ASEAN E-commerce Logistics Market Revenue Million Forecast, by Product 2020 & 2033
- Table 26: Global ASEAN E-commerce Logistics Market Revenue Million Forecast, by Country 2020 & 2033
- Table 27: United Kingdom ASEAN E-commerce Logistics Market Revenue (Million) Forecast, by Application 2020 & 2033
- Table 28: Germany ASEAN E-commerce Logistics Market Revenue (Million) Forecast, by Application 2020 & 2033
- Table 29: France ASEAN E-commerce Logistics Market Revenue (Million) Forecast, by Application 2020 & 2033
- Table 30: Italy ASEAN E-commerce Logistics Market Revenue (Million) Forecast, by Application 2020 & 2033
- Table 31: Spain ASEAN E-commerce Logistics Market Revenue (Million) Forecast, by Application 2020 & 2033
- Table 32: Russia ASEAN E-commerce Logistics Market Revenue (Million) Forecast, by Application 2020 & 2033
- Table 33: Benelux ASEAN E-commerce Logistics Market Revenue (Million) Forecast, by Application 2020 & 2033
- Table 34: Nordics ASEAN E-commerce Logistics Market Revenue (Million) Forecast, by Application 2020 & 2033
- Table 35: Rest of Europe ASEAN E-commerce Logistics Market Revenue (Million) Forecast, by Application 2020 & 2033
- Table 36: Global ASEAN E-commerce Logistics Market Revenue Million Forecast, by Service 2020 & 2033
- Table 37: Global ASEAN E-commerce Logistics Market Revenue Million Forecast, by Business 2020 & 2033
- Table 38: Global ASEAN E-commerce Logistics Market Revenue Million Forecast, by Destination 2020 & 2033
- Table 39: Global ASEAN E-commerce Logistics Market Revenue Million Forecast, by Product 2020 & 2033
- Table 40: Global ASEAN E-commerce Logistics Market Revenue Million Forecast, by Country 2020 & 2033
- Table 41: Turkey ASEAN E-commerce Logistics Market Revenue (Million) Forecast, by Application 2020 & 2033
- Table 42: Israel ASEAN E-commerce Logistics Market Revenue (Million) Forecast, by Application 2020 & 2033
- Table 43: GCC ASEAN E-commerce Logistics Market Revenue (Million) Forecast, by Application 2020 & 2033
- Table 44: North Africa ASEAN E-commerce Logistics Market Revenue (Million) Forecast, by Application 2020 & 2033
- Table 45: South Africa ASEAN E-commerce Logistics Market Revenue (Million) Forecast, by Application 2020 & 2033
- Table 46: Rest of Middle East & Africa ASEAN E-commerce Logistics Market Revenue (Million) Forecast, by Application 2020 & 2033
- Table 47: Global ASEAN E-commerce Logistics Market Revenue Million Forecast, by Service 2020 & 2033
- Table 48: Global ASEAN E-commerce Logistics Market Revenue Million Forecast, by Business 2020 & 2033
- Table 49: Global ASEAN E-commerce Logistics Market Revenue Million Forecast, by Destination 2020 & 2033
- Table 50: Global ASEAN E-commerce Logistics Market Revenue Million Forecast, by Product 2020 & 2033
- Table 51: Global ASEAN E-commerce Logistics Market Revenue Million Forecast, by Country 2020 & 2033
- Table 52: China ASEAN E-commerce Logistics Market Revenue (Million) Forecast, by Application 2020 & 2033
- Table 53: India ASEAN E-commerce Logistics Market Revenue (Million) Forecast, by Application 2020 & 2033
- Table 54: Japan ASEAN E-commerce Logistics Market Revenue (Million) Forecast, by Application 2020 & 2033
- Table 55: South Korea ASEAN E-commerce Logistics Market Revenue (Million) Forecast, by Application 2020 & 2033
- Table 56: ASEAN ASEAN E-commerce Logistics Market Revenue (Million) Forecast, by Application 2020 & 2033
- Table 57: Oceania ASEAN E-commerce Logistics Market Revenue (Million) Forecast, by Application 2020 & 2033
- Table 58: Rest of Asia Pacific ASEAN E-commerce Logistics Market Revenue (Million) Forecast, by Application 2020 & 2033
Frequently Asked Questions
1. What is the projected Compound Annual Growth Rate (CAGR) of the ASEAN E-commerce Logistics Market?
The projected CAGR is approximately 14.50%.
2. Which companies are prominent players in the ASEAN E-commerce Logistics Market?
Key companies in the market include GD Express Sdn Bhd**List Not Exhaustive 6 3 Other Companie, LBC Express, Best Express, FedEx Corporation, United Parcel Service, J&T Express, PT Global Jet Express (J&T Express), Giao Hang Nhanh, PT Citra Van Titipan Kilat (TIKI), PT Jalur Nugraha Ekakurir (JNE Express), Deutsche Post DHL Group, Kerry Express, Ninja Van, Flash Express, Pos Indonesia.
3. What are the main segments of the ASEAN E-commerce Logistics Market?
The market segments include Service, Business, Destination, Product.
4. Can you provide details about the market size?
The market size is estimated to be USD 6.22 Million as of 2022.
5. What are some drivers contributing to market growth?
4.; Growing E-commerce Sector.
6. What are the notable trends driving market growth?
E-commerce growth is driving the market.
7. Are there any restraints impacting market growth?
4.; Complicated Product Returns.
8. Can you provide examples of recent developments in the market?
N/A
9. What pricing options are available for accessing the report?
Pricing options include single-user, multi-user, and enterprise licenses priced at USD 3800, USD 4500, and USD 5800 respectively.
10. Is the market size provided in terms of value or volume?
The market size is provided in terms of value, measured in Million.
11. Are there any specific market keywords associated with the report?
Yes, the market keyword associated with the report is "ASEAN E-commerce Logistics Market," which aids in identifying and referencing the specific market segment covered.
12. How do I determine which pricing option suits my needs best?
The pricing options vary based on user requirements and access needs. Individual users may opt for single-user licenses, while businesses requiring broader access may choose multi-user or enterprise licenses for cost-effective access to the report.
13. Are there any additional resources or data provided in the ASEAN E-commerce Logistics Market report?
While the report offers comprehensive insights, it's advisable to review the specific contents or supplementary materials provided to ascertain if additional resources or data are available.
14. How can I stay updated on further developments or reports in the ASEAN E-commerce Logistics Market?
To stay informed about further developments, trends, and reports in the ASEAN E-commerce Logistics Market, consider subscribing to industry newsletters, following relevant companies and organizations, or regularly checking reputable industry news sources and publications.
Methodology
Step 1 - Identification of Relevant Samples Size from Population Database


Step 2 - Approaches for Defining Global Market Size (Value, Volume* & Price*)

Note*: In applicable scenarios
Step 3 - Data Sources
Primary Research
- Web Analytics
- Survey Reports
- Research Institute
- Latest Research Reports
- Opinion Leaders
Secondary Research
- Annual Reports
- White Paper
- Latest Press Release
- Industry Association
- Paid Database
- Investor Presentations

Step 4 - Data Triangulation
Involves using different sources of information in order to increase the validity of a study
These sources are likely to be stakeholders in a program - participants, other researchers, program staff, other community members, and so on.
Then we put all data in single framework & apply various statistical tools to find out the dynamic on the market.
During the analysis stage, feedback from the stakeholder groups would be compared to determine areas of agreement as well as areas of divergence