

Key Insights
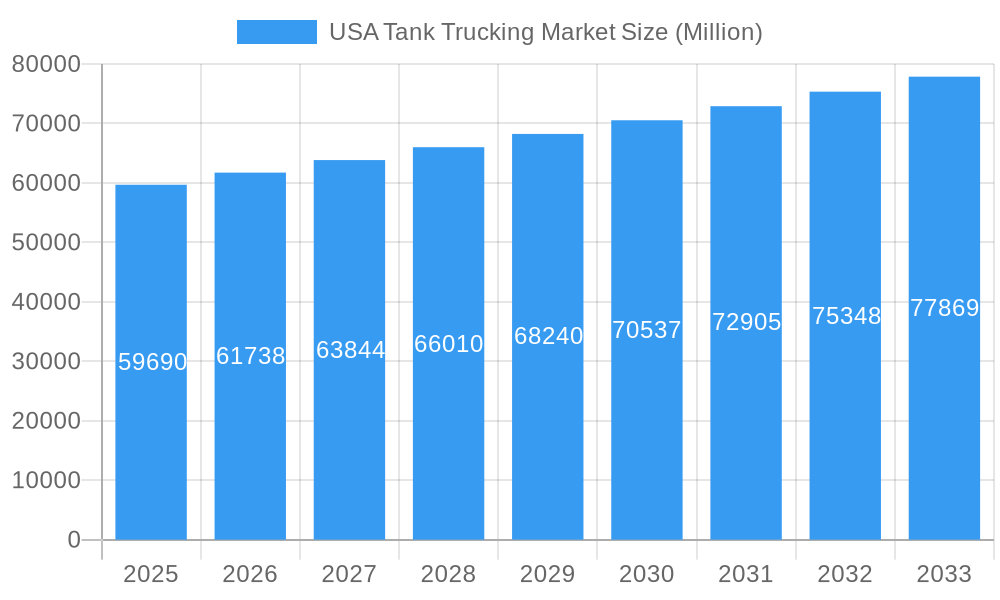
The US tank trucking market, valued at $59.69 billion in 2025, is projected to experience steady growth, driven by increasing demand for the transportation of petroleum products, chemicals, and food and beverages. A compound annual growth rate (CAGR) of 3.42% from 2025 to 2033 indicates a robust market outlook. This growth is fueled by several key factors: the expansion of the e-commerce sector necessitating efficient last-mile delivery solutions, increasing industrial production and manufacturing activities requiring bulk transportation, and the ongoing development of infrastructure projects dependent on timely material delivery. The market is segmented by fleet type (for-hire and private), capacity (light, medium, and heavy duty), and product category (crude petroleum, petroleum products, chemicals, food and beverages, fertilizers, and others). Major players like Trimac Transportation Inc., Foodliner/Quest Liner Inc., and Tankstar USA are prominent, but a competitive landscape exists with many regional and specialized carriers. Growth challenges include fluctuations in fuel prices, stringent environmental regulations, and driver shortages, impacting operational costs and efficiency. The regional distribution across the United States (Northeast, Southeast, Midwest, Southwest, and West) reflects varying industrial activity and demand patterns. The forecast period reveals a promising trajectory, but careful navigation of industry challenges is crucial for sustained success.
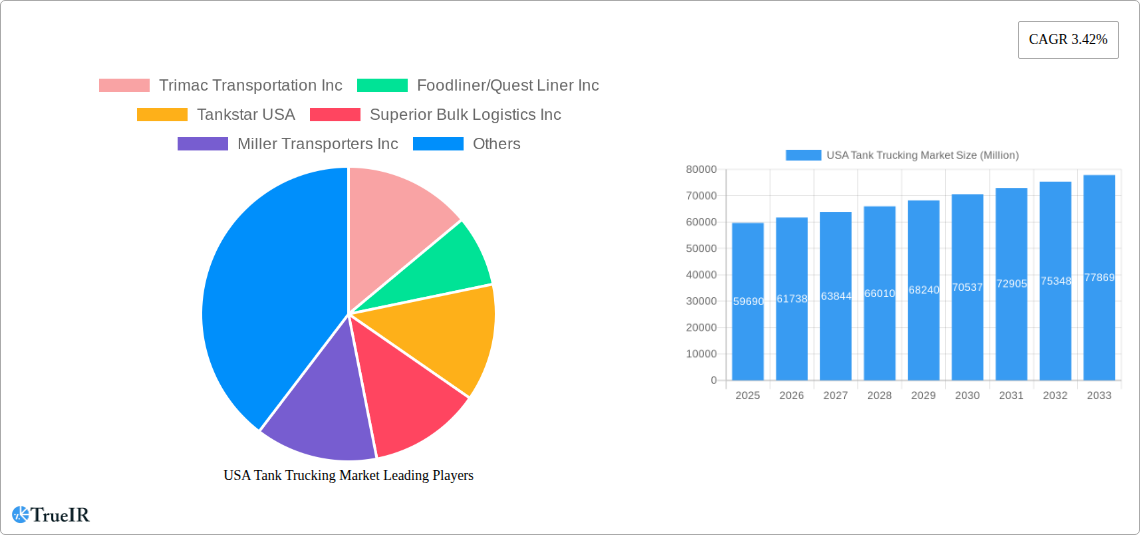
USA Tank Trucking Market Market Size (In Billion)
The market's segmentation reveals key opportunities. The heavy-duty segment, vital for transporting bulk goods, is expected to witness significant growth due to increased demand in the manufacturing and energy sectors. The petroleum products sub-segment will continue to be a major driver, although diversification into chemicals, food and beverages, and fertilizers presents significant opportunities for market expansion. Technological advancements, such as improved fleet management systems and driver assistance technologies, will likely play a crucial role in enhancing operational efficiency and safety, further boosting market growth. Addressing driver shortages through improved compensation and working conditions, along with investments in automation and driver training programs, will be crucial for long-term market stability.
USA Tank Trucking Market Company Market Share
This comprehensive report provides a detailed analysis of the USA Tank Trucking Market, covering market size, segmentation, competitive landscape, key players, and future outlook. The study period spans from 2019 to 2033, with 2025 serving as the base and estimated year. This report is crucial for businesses operating in or planning to enter this dynamic sector.
USA Tank Trucking Market Market Structure & Competitive Landscape
The USA tank trucking market is characterized by a moderately concentrated structure, with a few large players holding significant market share alongside numerous smaller, regional operators. The Herfindahl-Hirschman Index (HHI) for 2024 is estimated at xx, indicating a moderately concentrated market. Key innovation drivers include the adoption of telematics, advanced driver-assistance systems (ADAS), and fuel-efficient technologies. Stringent environmental regulations, primarily related to emissions and safety standards, significantly impact market operations. Product substitutes, such as rail and pipeline transport, present competitive challenges, particularly for long-haul movements of specific commodities.
End-user segmentation is diverse, encompassing various industries such as energy, chemicals, food and beverage, and agriculture. The market exhibits considerable M&A activity, driven by consolidation efforts, expansion into new geographical areas, and the acquisition of specialized capabilities. The total value of M&A transactions in the sector between 2019 and 2024 is estimated at $xx Million.
- Market Concentration: Moderately concentrated, with an estimated HHI of xx in 2024.
- Innovation Drivers: Telematics, ADAS, fuel-efficient technologies.
- Regulatory Impacts: Stringent environmental and safety regulations.
- Product Substitutes: Rail, pipeline transport.
- End-User Segmentation: Energy, chemicals, food & beverage, agriculture, etc.
- M&A Trends: Significant activity driven by consolidation and expansion.
USA Tank Trucking Market Market Trends & Opportunities
The USA tank trucking market is projected to experience substantial growth throughout the forecast period (2025-2033). The market size is estimated at $xx Million in 2025 and is anticipated to reach $xx Million by 2033, exhibiting a Compound Annual Growth Rate (CAGR) of xx%. This growth is fueled by several factors, including increasing demand for efficient logistics solutions across various industries, expanding e-commerce and related last-mile delivery needs, and ongoing infrastructure development. Technological advancements, such as the integration of IoT devices and AI-powered route optimization software, are transforming operational efficiency and reducing costs. Consumer preferences are shifting towards faster, more reliable, and environmentally sustainable transportation solutions, creating opportunities for innovative service offerings. Intense competition among existing players and the emergence of new entrants are shaping market dynamics and driving innovation. Market penetration rates for advanced technologies vary across segments, with higher adoption among larger fleets.
Dominant Markets & Segments in USA Tank Trucking Market
The dominant segment within the USA tank trucking market is currently the Heavy Duty category, driven by the high demand for transporting bulk commodities over long distances. The For-hire fleet type also holds a significant market share, reflecting the prevalent outsourcing of transportation needs by various industries. Within product categories, Petroleum Products (Gasoline, Diesel, and Aviation Fuels) and Chemicals represent the largest segments, owing to high transportation volumes. The South-Central region of the US is a particularly dominant market due to its extensive energy and chemical production infrastructure.
- Leading Region: South-Central US
- Dominant Fleet Type: For-hire
- Dominant Capacity: Heavy Duty
- Dominant Product Category: Petroleum Products and Chemicals
Key Growth Drivers:
- Robust infrastructure development facilitates efficient transportation networks.
- Favorable government policies supporting the logistics sector contribute to market expansion.
- High demand from diverse industries fuels consistent growth across segments.
USA Tank Trucking Market Product Analysis
Technological advancements are continuously shaping product offerings in the USA tank trucking market. Innovations focus on enhancing safety, efficiency, and environmental sustainability. This includes the implementation of telematics systems for real-time tracking and monitoring, aerodynamic improvements for fuel efficiency, and the use of alternative fuels to reduce emissions. These advancements are improving operational efficiency and enhancing competitive advantage, attracting new customers with tailored services.
Key Drivers, Barriers & Challenges in USA Tank Trucking Market
Key Drivers:
- Growing demand for efficient logistics: Expanding e-commerce and industrial production require robust transportation networks.
- Technological advancements: Telematics, AI, and alternative fuels improve efficiency and reduce costs.
- Government initiatives: Infrastructure investment and regulatory reforms support market growth.
Key Challenges:
- Driver shortage: A persistent lack of qualified drivers constrains capacity and increases costs. The estimated driver shortage is xx thousand.
- Fluctuating fuel prices: Volatile fuel costs significantly impact profitability and operational planning.
- Stringent regulations: Compliance with environmental and safety standards requires substantial investment.
Growth Drivers in the USA Tank Trucking Market Market
The USA tank trucking market's growth is primarily propelled by increasing industrial output, robust e-commerce growth, and government investments in infrastructure development. Technological innovations, such as advanced telematics and route optimization software, further enhance efficiency and reduce operational costs, driving market expansion. Moreover, favorable regulatory environments in some states encourage market participation and innovation.
Challenges Impacting USA Tank Trucking Market Growth
The industry faces significant challenges including a severe driver shortage, leading to increased operational costs and capacity constraints. Stricter emission regulations and rising fuel costs also impact profitability. Furthermore, intense competition and supply chain disruptions create uncertainties within the market.
Key Players Shaping the USA Tank Trucking Market Market
- Trimac Transportation Inc
- Foodliner/Quest Liner Inc
- Tankstar USA
- Superior Bulk Logistics Inc
- Miller Transporters Inc
- Groendyke Transport Inc
- Martin Transport Inc
- Florida Rock & Tank Lines Inc
- Slay Transportation Co Inc
- Apex Logistics LLC
- Mission Petroleum Carriers
- Genox Transportation Inc
- J&M Tank Lines Inc
- CLI Transport LP
- Tidewater Transit Co Inc
- Herman R Ewell Inc
- Service Transport Company
- Schilli Bulk Carriers Group
- Andrews Logistics and CTL Transportation LLC
- Eagle Transport Corp
- Ruan Transportation Management Systems
- Kenan Advantage Group
- Dupre Logistics LLC
Significant USA Tank Trucking Market Industry Milestones
- April 2023: Trimac Transportation acquired American Industrial Partners (AIP) Logistics, expanding its bulk terminal services, transportation, and warehousing capabilities.
- February 2024: Kenan Advantage Group acquired Northern Dry Bulk, strengthening its position in the plastic resin transportation market.
Future Outlook for USA Tank Trucking Market Market
The future of the USA tank trucking market appears promising, driven by continued industrial growth, technological advancements, and infrastructure investments. Strategic partnerships and acquisitions will likely shape the competitive landscape, while a focus on sustainability and driver retention will be crucial for long-term success. The market presents significant opportunities for companies that can effectively address the challenges of driver shortages and evolving regulatory requirements.
USA Tank Trucking Market Segmentation
-
1. Fleet Type
- 1.1. For-hire
- 1.2. Private
-
2. Capacity
- 2.1. Light Duty
- 2.2. Medium Duty
- 2.3. Heavy Duty
-
3. Product Category
- 3.1. Crude Petroleum
- 3.2. Petroleu
- 3.3. Chemicals
- 3.4. Food and Beverages
- 3.5. Fertilizers
- 3.6. Other Product Categories
USA Tank Trucking Market Segmentation By Geography
-
1. North America
- 1.1. United States
- 1.2. Canada
- 1.3. Mexico
-
2. South America
- 2.1. Brazil
- 2.2. Argentina
- 2.3. Rest of South America
-
3. Europe
- 3.1. United Kingdom
- 3.2. Germany
- 3.3. France
- 3.4. Italy
- 3.5. Spain
- 3.6. Russia
- 3.7. Benelux
- 3.8. Nordics
- 3.9. Rest of Europe
-
4. Middle East & Africa
- 4.1. Turkey
- 4.2. Israel
- 4.3. GCC
- 4.4. North Africa
- 4.5. South Africa
- 4.6. Rest of Middle East & Africa
-
5. Asia Pacific
- 5.1. China
- 5.2. India
- 5.3. Japan
- 5.4. South Korea
- 5.5. ASEAN
- 5.6. Oceania
- 5.7. Rest of Asia Pacific
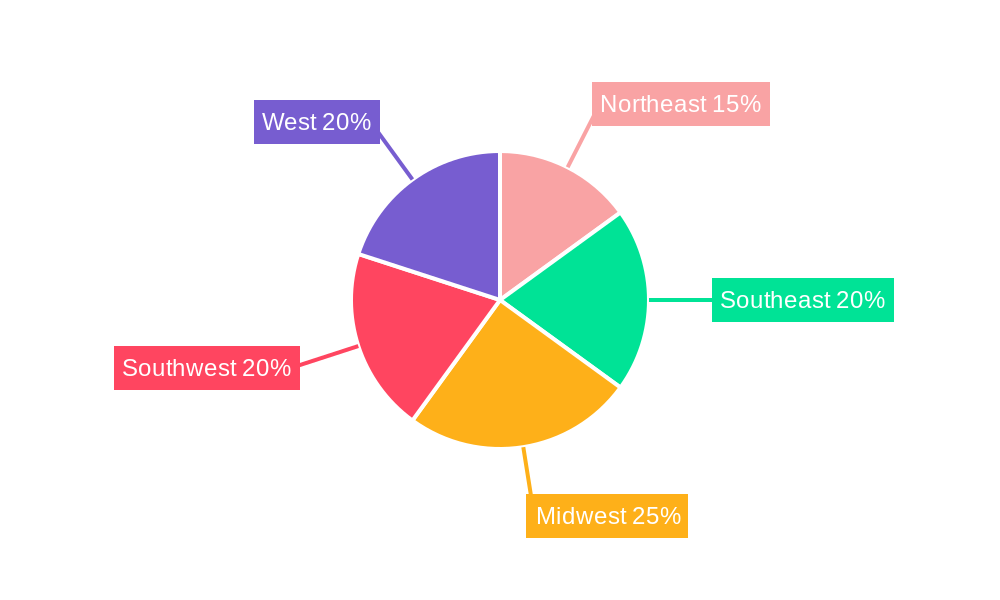
USA Tank Trucking Market Regional Market Share
Geographic Coverage of USA Tank Trucking Market
USA Tank Trucking Market REPORT HIGHLIGHTS
| Aspects | Details |
|---|---|
| Study Period | 2020-2034 |
| Base Year | 2025 |
| Estimated Year | 2026 |
| Forecast Period | 2026-2034 |
| Historical Period | 2020-2025 |
| Growth Rate | CAGR of 3.42% from 2020-2034 |
| Segmentation |
|
Table of Contents
- 1. Introduction
- 1.1. Research Scope
- 1.2. Market Segmentation
- 1.3. Research Objective
- 1.4. Definitions and Assumptions
- 2. Executive Summary
- 2.1. Market Snapshot
- 3. Market Dynamics
- 3.1. Market Drivers
- 3.2. Market Restrains
- 3.3. Market Trends
- 3.4. Market Opportunities
- 4. Market Factor Analysis
- 4.1. Porters Five Forces
- 4.1.1. Bargaining Power of Suppliers
- 4.1.2. Bargaining Power of Buyers
- 4.1.3. Threat of New Entrants
- 4.1.4. Threat of Substitutes
- 4.1.5. Competitive Rivalry
- 4.2. PESTEL analysis
- 4.3. BCG Analysis
- 4.3.1. Stars (High Growth, High Market Share)
- 4.3.2. Cash Cows (Low Growth, High Market Share)
- 4.3.3. Question Mark (High Growth, Low Market Share)
- 4.3.4. Dogs (Low Growth, Low Market Share)
- 4.4. Ansoff Matrix Analysis
- 4.5. Supply Chain Analysis
- 4.6. Regulatory Landscape
- 4.7. Current Market Potential and Opportunity Assessment (TAM–SAM–SOM Framework)
- 4.8. TIR Analyst Note
- 4.1. Porters Five Forces
- 5. Market Analysis, Insights and Forecast 2021-2033
- 5.1. Market Analysis, Insights and Forecast - by Fleet Type
- 5.1.1. For-hire
- 5.1.2. Private
- 5.2. Market Analysis, Insights and Forecast - by Capacity
- 5.2.1. Light Duty
- 5.2.2. Medium Duty
- 5.2.3. Heavy Duty
- 5.3. Market Analysis, Insights and Forecast - by Product Category
- 5.3.1. Crude Petroleum
- 5.3.2. Petroleu
- 5.3.3. Chemicals
- 5.3.4. Food and Beverages
- 5.3.5. Fertilizers
- 5.3.6. Other Product Categories
- 5.4. Market Analysis, Insights and Forecast - by Region
- 5.4.1. North America
- 5.4.2. South America
- 5.4.3. Europe
- 5.4.4. Middle East & Africa
- 5.4.5. Asia Pacific
- 5.1. Market Analysis, Insights and Forecast - by Fleet Type
- 6. Global USA Tank Trucking Market Analysis, Insights and Forecast, 2021-2033
- 6.1. Market Analysis, Insights and Forecast - by Fleet Type
- 6.1.1. For-hire
- 6.1.2. Private
- 6.2. Market Analysis, Insights and Forecast - by Capacity
- 6.2.1. Light Duty
- 6.2.2. Medium Duty
- 6.2.3. Heavy Duty
- 6.3. Market Analysis, Insights and Forecast - by Product Category
- 6.3.1. Crude Petroleum
- 6.3.2. Petroleu
- 6.3.3. Chemicals
- 6.3.4. Food and Beverages
- 6.3.5. Fertilizers
- 6.3.6. Other Product Categories
- 6.1. Market Analysis, Insights and Forecast - by Fleet Type
- 7. North America USA Tank Trucking Market Analysis, Insights and Forecast, 2020-2032
- 7.1. Market Analysis, Insights and Forecast - by Fleet Type
- 7.1.1. For-hire
- 7.1.2. Private
- 7.2. Market Analysis, Insights and Forecast - by Capacity
- 7.2.1. Light Duty
- 7.2.2. Medium Duty
- 7.2.3. Heavy Duty
- 7.3. Market Analysis, Insights and Forecast - by Product Category
- 7.3.1. Crude Petroleum
- 7.3.2. Petroleu
- 7.3.3. Chemicals
- 7.3.4. Food and Beverages
- 7.3.5. Fertilizers
- 7.3.6. Other Product Categories
- 7.1. Market Analysis, Insights and Forecast - by Fleet Type
- 8. South America USA Tank Trucking Market Analysis, Insights and Forecast, 2020-2032
- 8.1. Market Analysis, Insights and Forecast - by Fleet Type
- 8.1.1. For-hire
- 8.1.2. Private
- 8.2. Market Analysis, Insights and Forecast - by Capacity
- 8.2.1. Light Duty
- 8.2.2. Medium Duty
- 8.2.3. Heavy Duty
- 8.3. Market Analysis, Insights and Forecast - by Product Category
- 8.3.1. Crude Petroleum
- 8.3.2. Petroleu
- 8.3.3. Chemicals
- 8.3.4. Food and Beverages
- 8.3.5. Fertilizers
- 8.3.6. Other Product Categories
- 8.1. Market Analysis, Insights and Forecast - by Fleet Type
- 9. Europe USA Tank Trucking Market Analysis, Insights and Forecast, 2020-2032
- 9.1. Market Analysis, Insights and Forecast - by Fleet Type
- 9.1.1. For-hire
- 9.1.2. Private
- 9.2. Market Analysis, Insights and Forecast - by Capacity
- 9.2.1. Light Duty
- 9.2.2. Medium Duty
- 9.2.3. Heavy Duty
- 9.3. Market Analysis, Insights and Forecast - by Product Category
- 9.3.1. Crude Petroleum
- 9.3.2. Petroleu
- 9.3.3. Chemicals
- 9.3.4. Food and Beverages
- 9.3.5. Fertilizers
- 9.3.6. Other Product Categories
- 9.1. Market Analysis, Insights and Forecast - by Fleet Type
- 10. Middle East & Africa USA Tank Trucking Market Analysis, Insights and Forecast, 2020-2032
- 10.1. Market Analysis, Insights and Forecast - by Fleet Type
- 10.1.1. For-hire
- 10.1.2. Private
- 10.2. Market Analysis, Insights and Forecast - by Capacity
- 10.2.1. Light Duty
- 10.2.2. Medium Duty
- 10.2.3. Heavy Duty
- 10.3. Market Analysis, Insights and Forecast - by Product Category
- 10.3.1. Crude Petroleum
- 10.3.2. Petroleu
- 10.3.3. Chemicals
- 10.3.4. Food and Beverages
- 10.3.5. Fertilizers
- 10.3.6. Other Product Categories
- 10.1. Market Analysis, Insights and Forecast - by Fleet Type
- 11. Asia Pacific USA Tank Trucking Market Analysis, Insights and Forecast, 2020-2032
- 11.1. Market Analysis, Insights and Forecast - by Fleet Type
- 11.1.1. For-hire
- 11.1.2. Private
- 11.2. Market Analysis, Insights and Forecast - by Capacity
- 11.2.1. Light Duty
- 11.2.2. Medium Duty
- 11.2.3. Heavy Duty
- 11.3. Market Analysis, Insights and Forecast - by Product Category
- 11.3.1. Crude Petroleum
- 11.3.2. Petroleu
- 11.3.3. Chemicals
- 11.3.4. Food and Beverages
- 11.3.5. Fertilizers
- 11.3.6. Other Product Categories
- 11.1. Market Analysis, Insights and Forecast - by Fleet Type
- 12. Competitive Analysis
- 12.1. Company Profiles
- 12.1.1 Trimac Transportation Inc
- 12.1.1.1. Company Overview
- 12.1.1.2. Products
- 12.1.1.3. Company Financials
- 12.1.1.4. SWOT Analysis
- 12.1.2 Foodliner/Quest Liner Inc
- 12.1.2.1. Company Overview
- 12.1.2.2. Products
- 12.1.2.3. Company Financials
- 12.1.2.4. SWOT Analysis
- 12.1.3 Tankstar USA
- 12.1.3.1. Company Overview
- 12.1.3.2. Products
- 12.1.3.3. Company Financials
- 12.1.3.4. SWOT Analysis
- 12.1.4 Superior Bulk Logistics Inc
- 12.1.4.1. Company Overview
- 12.1.4.2. Products
- 12.1.4.3. Company Financials
- 12.1.4.4. SWOT Analysis
- 12.1.5 Miller Transporters Inc
- 12.1.5.1. Company Overview
- 12.1.5.2. Products
- 12.1.5.3. Company Financials
- 12.1.5.4. SWOT Analysis
- 12.1.6 Groendyke Transport Inc
- 12.1.6.1. Company Overview
- 12.1.6.2. Products
- 12.1.6.3. Company Financials
- 12.1.6.4. SWOT Analysis
- 12.1.7 Martin Transport Inc
- 12.1.7.1. Company Overview
- 12.1.7.2. Products
- 12.1.7.3. Company Financials
- 12.1.7.4. SWOT Analysis
- 12.1.8 Florida Rock & Tank Lines Inc **List Not Exhaustive 7 3 Other Companies (Slay Transportation Co Inc Apex Logistics LLC Mission Petroleum Carriers Genox Transportation Inc J&M Tank Lines Inc CLI Transport LP Tidewater Transit Co Inc Herman R Ewell Inc Service Transport Company Schilli Bulk Carriers Group Andrews Logistics and CTL Transportation LLC
- 12.1.8.1. Company Overview
- 12.1.8.2. Products
- 12.1.8.3. Company Financials
- 12.1.8.4. SWOT Analysis
- 12.1.9 Eagle Transport Corp
- 12.1.9.1. Company Overview
- 12.1.9.2. Products
- 12.1.9.3. Company Financials
- 12.1.9.4. SWOT Analysis
- 12.1.10 Ruan Transportation Management Systems
- 12.1.10.1. Company Overview
- 12.1.10.2. Products
- 12.1.10.3. Company Financials
- 12.1.10.4. SWOT Analysis
- 12.1.11 Kenan Advantage Group
- 12.1.11.1. Company Overview
- 12.1.11.2. Products
- 12.1.11.3. Company Financials
- 12.1.11.4. SWOT Analysis
- 12.1.12 Dupre Logistics LLC
- 12.1.12.1. Company Overview
- 12.1.12.2. Products
- 12.1.12.3. Company Financials
- 12.1.12.4. SWOT Analysis
- 12.1.1 Trimac Transportation Inc
- 12.2. Market Entropy
- 12.2.1 Company's Key Areas Served
- 12.2.2 Recent Developments
- 12.3. Company Market Share Analysis 2025
- 12.3.1 Top 5 Companies Market Share Analysis
- 12.3.2 Top 3 Companies Market Share Analysis
- 12.4. List of Potential Customers
- 13. Research Methodology
List of Figures
- Figure 1: Global USA Tank Trucking Market Revenue Breakdown (Million, %) by Region 2025 & 2033
- Figure 2: North America USA Tank Trucking Market Revenue (Million), by Fleet Type 2025 & 2033
- Figure 3: North America USA Tank Trucking Market Revenue Share (%), by Fleet Type 2025 & 2033
- Figure 4: North America USA Tank Trucking Market Revenue (Million), by Capacity 2025 & 2033
- Figure 5: North America USA Tank Trucking Market Revenue Share (%), by Capacity 2025 & 2033
- Figure 6: North America USA Tank Trucking Market Revenue (Million), by Product Category 2025 & 2033
- Figure 7: North America USA Tank Trucking Market Revenue Share (%), by Product Category 2025 & 2033
- Figure 8: North America USA Tank Trucking Market Revenue (Million), by Country 2025 & 2033
- Figure 9: North America USA Tank Trucking Market Revenue Share (%), by Country 2025 & 2033
- Figure 10: South America USA Tank Trucking Market Revenue (Million), by Fleet Type 2025 & 2033
- Figure 11: South America USA Tank Trucking Market Revenue Share (%), by Fleet Type 2025 & 2033
- Figure 12: South America USA Tank Trucking Market Revenue (Million), by Capacity 2025 & 2033
- Figure 13: South America USA Tank Trucking Market Revenue Share (%), by Capacity 2025 & 2033
- Figure 14: South America USA Tank Trucking Market Revenue (Million), by Product Category 2025 & 2033
- Figure 15: South America USA Tank Trucking Market Revenue Share (%), by Product Category 2025 & 2033
- Figure 16: South America USA Tank Trucking Market Revenue (Million), by Country 2025 & 2033
- Figure 17: South America USA Tank Trucking Market Revenue Share (%), by Country 2025 & 2033
- Figure 18: Europe USA Tank Trucking Market Revenue (Million), by Fleet Type 2025 & 2033
- Figure 19: Europe USA Tank Trucking Market Revenue Share (%), by Fleet Type 2025 & 2033
- Figure 20: Europe USA Tank Trucking Market Revenue (Million), by Capacity 2025 & 2033
- Figure 21: Europe USA Tank Trucking Market Revenue Share (%), by Capacity 2025 & 2033
- Figure 22: Europe USA Tank Trucking Market Revenue (Million), by Product Category 2025 & 2033
- Figure 23: Europe USA Tank Trucking Market Revenue Share (%), by Product Category 2025 & 2033
- Figure 24: Europe USA Tank Trucking Market Revenue (Million), by Country 2025 & 2033
- Figure 25: Europe USA Tank Trucking Market Revenue Share (%), by Country 2025 & 2033
- Figure 26: Middle East & Africa USA Tank Trucking Market Revenue (Million), by Fleet Type 2025 & 2033
- Figure 27: Middle East & Africa USA Tank Trucking Market Revenue Share (%), by Fleet Type 2025 & 2033
- Figure 28: Middle East & Africa USA Tank Trucking Market Revenue (Million), by Capacity 2025 & 2033
- Figure 29: Middle East & Africa USA Tank Trucking Market Revenue Share (%), by Capacity 2025 & 2033
- Figure 30: Middle East & Africa USA Tank Trucking Market Revenue (Million), by Product Category 2025 & 2033
- Figure 31: Middle East & Africa USA Tank Trucking Market Revenue Share (%), by Product Category 2025 & 2033
- Figure 32: Middle East & Africa USA Tank Trucking Market Revenue (Million), by Country 2025 & 2033
- Figure 33: Middle East & Africa USA Tank Trucking Market Revenue Share (%), by Country 2025 & 2033
- Figure 34: Asia Pacific USA Tank Trucking Market Revenue (Million), by Fleet Type 2025 & 2033
- Figure 35: Asia Pacific USA Tank Trucking Market Revenue Share (%), by Fleet Type 2025 & 2033
- Figure 36: Asia Pacific USA Tank Trucking Market Revenue (Million), by Capacity 2025 & 2033
- Figure 37: Asia Pacific USA Tank Trucking Market Revenue Share (%), by Capacity 2025 & 2033
- Figure 38: Asia Pacific USA Tank Trucking Market Revenue (Million), by Product Category 2025 & 2033
- Figure 39: Asia Pacific USA Tank Trucking Market Revenue Share (%), by Product Category 2025 & 2033
- Figure 40: Asia Pacific USA Tank Trucking Market Revenue (Million), by Country 2025 & 2033
- Figure 41: Asia Pacific USA Tank Trucking Market Revenue Share (%), by Country 2025 & 2033
List of Tables
- Table 1: Global USA Tank Trucking Market Revenue Million Forecast, by Fleet Type 2020 & 2033
- Table 2: Global USA Tank Trucking Market Revenue Million Forecast, by Capacity 2020 & 2033
- Table 3: Global USA Tank Trucking Market Revenue Million Forecast, by Product Category 2020 & 2033
- Table 4: Global USA Tank Trucking Market Revenue Million Forecast, by Region 2020 & 2033
- Table 5: Global USA Tank Trucking Market Revenue Million Forecast, by Fleet Type 2020 & 2033
- Table 6: Global USA Tank Trucking Market Revenue Million Forecast, by Capacity 2020 & 2033
- Table 7: Global USA Tank Trucking Market Revenue Million Forecast, by Product Category 2020 & 2033
- Table 8: Global USA Tank Trucking Market Revenue Million Forecast, by Country 2020 & 2033
- Table 9: United States USA Tank Trucking Market Revenue (Million) Forecast, by Application 2020 & 2033
- Table 10: Canada USA Tank Trucking Market Revenue (Million) Forecast, by Application 2020 & 2033
- Table 11: Mexico USA Tank Trucking Market Revenue (Million) Forecast, by Application 2020 & 2033
- Table 12: Global USA Tank Trucking Market Revenue Million Forecast, by Fleet Type 2020 & 2033
- Table 13: Global USA Tank Trucking Market Revenue Million Forecast, by Capacity 2020 & 2033
- Table 14: Global USA Tank Trucking Market Revenue Million Forecast, by Product Category 2020 & 2033
- Table 15: Global USA Tank Trucking Market Revenue Million Forecast, by Country 2020 & 2033
- Table 16: Brazil USA Tank Trucking Market Revenue (Million) Forecast, by Application 2020 & 2033
- Table 17: Argentina USA Tank Trucking Market Revenue (Million) Forecast, by Application 2020 & 2033
- Table 18: Rest of South America USA Tank Trucking Market Revenue (Million) Forecast, by Application 2020 & 2033
- Table 19: Global USA Tank Trucking Market Revenue Million Forecast, by Fleet Type 2020 & 2033
- Table 20: Global USA Tank Trucking Market Revenue Million Forecast, by Capacity 2020 & 2033
- Table 21: Global USA Tank Trucking Market Revenue Million Forecast, by Product Category 2020 & 2033
- Table 22: Global USA Tank Trucking Market Revenue Million Forecast, by Country 2020 & 2033
- Table 23: United Kingdom USA Tank Trucking Market Revenue (Million) Forecast, by Application 2020 & 2033
- Table 24: Germany USA Tank Trucking Market Revenue (Million) Forecast, by Application 2020 & 2033
- Table 25: France USA Tank Trucking Market Revenue (Million) Forecast, by Application 2020 & 2033
- Table 26: Italy USA Tank Trucking Market Revenue (Million) Forecast, by Application 2020 & 2033
- Table 27: Spain USA Tank Trucking Market Revenue (Million) Forecast, by Application 2020 & 2033
- Table 28: Russia USA Tank Trucking Market Revenue (Million) Forecast, by Application 2020 & 2033
- Table 29: Benelux USA Tank Trucking Market Revenue (Million) Forecast, by Application 2020 & 2033
- Table 30: Nordics USA Tank Trucking Market Revenue (Million) Forecast, by Application 2020 & 2033
- Table 31: Rest of Europe USA Tank Trucking Market Revenue (Million) Forecast, by Application 2020 & 2033
- Table 32: Global USA Tank Trucking Market Revenue Million Forecast, by Fleet Type 2020 & 2033
- Table 33: Global USA Tank Trucking Market Revenue Million Forecast, by Capacity 2020 & 2033
- Table 34: Global USA Tank Trucking Market Revenue Million Forecast, by Product Category 2020 & 2033
- Table 35: Global USA Tank Trucking Market Revenue Million Forecast, by Country 2020 & 2033
- Table 36: Turkey USA Tank Trucking Market Revenue (Million) Forecast, by Application 2020 & 2033
- Table 37: Israel USA Tank Trucking Market Revenue (Million) Forecast, by Application 2020 & 2033
- Table 38: GCC USA Tank Trucking Market Revenue (Million) Forecast, by Application 2020 & 2033
- Table 39: North Africa USA Tank Trucking Market Revenue (Million) Forecast, by Application 2020 & 2033
- Table 40: South Africa USA Tank Trucking Market Revenue (Million) Forecast, by Application 2020 & 2033
- Table 41: Rest of Middle East & Africa USA Tank Trucking Market Revenue (Million) Forecast, by Application 2020 & 2033
- Table 42: Global USA Tank Trucking Market Revenue Million Forecast, by Fleet Type 2020 & 2033
- Table 43: Global USA Tank Trucking Market Revenue Million Forecast, by Capacity 2020 & 2033
- Table 44: Global USA Tank Trucking Market Revenue Million Forecast, by Product Category 2020 & 2033
- Table 45: Global USA Tank Trucking Market Revenue Million Forecast, by Country 2020 & 2033
- Table 46: China USA Tank Trucking Market Revenue (Million) Forecast, by Application 2020 & 2033
- Table 47: India USA Tank Trucking Market Revenue (Million) Forecast, by Application 2020 & 2033
- Table 48: Japan USA Tank Trucking Market Revenue (Million) Forecast, by Application 2020 & 2033
- Table 49: South Korea USA Tank Trucking Market Revenue (Million) Forecast, by Application 2020 & 2033
- Table 50: ASEAN USA Tank Trucking Market Revenue (Million) Forecast, by Application 2020 & 2033
- Table 51: Oceania USA Tank Trucking Market Revenue (Million) Forecast, by Application 2020 & 2033
- Table 52: Rest of Asia Pacific USA Tank Trucking Market Revenue (Million) Forecast, by Application 2020 & 2033
Frequently Asked Questions
1. What is the projected Compound Annual Growth Rate (CAGR) of the USA Tank Trucking Market?
The projected CAGR is approximately 3.42%.
2. Which companies are prominent players in the USA Tank Trucking Market?
Key companies in the market include Trimac Transportation Inc, Foodliner/Quest Liner Inc, Tankstar USA, Superior Bulk Logistics Inc, Miller Transporters Inc, Groendyke Transport Inc, Martin Transport Inc, Florida Rock & Tank Lines Inc **List Not Exhaustive 7 3 Other Companies (Slay Transportation Co Inc Apex Logistics LLC Mission Petroleum Carriers Genox Transportation Inc J&M Tank Lines Inc CLI Transport LP Tidewater Transit Co Inc Herman R Ewell Inc Service Transport Company Schilli Bulk Carriers Group Andrews Logistics and CTL Transportation LLC, Eagle Transport Corp, Ruan Transportation Management Systems, Kenan Advantage Group, Dupre Logistics LLC.
3. What are the main segments of the USA Tank Trucking Market?
The market segments include Fleet Type, Capacity, Product Category.
4. Can you provide details about the market size?
The market size is estimated to be USD 59.69 Million as of 2022.
5. What are some drivers contributing to market growth?
Rise in Demand for Oil and Natural Gas; Technological Advancements.
6. What are the notable trends driving market growth?
Fuel Tank Trailers as Petroleum Carriers are Boosting the Market's Growth in the United States.
7. Are there any restraints impacting market growth?
Increasing Regulatory Burden and Compliance Costs; Volatility of Fuel Prices.
8. Can you provide examples of recent developments in the market?
February 2024: Kenan Advantage Group, the largest tank truck transporter and logistics provider in North America, acquired Northern Dry Bulk, a company specializing in the transportation and storage of plastic resins for clients in the automotive, packaging, and electronics sectors across the United States and Canada. This acquisition brought 36 tractors, 91 trailers, and two terminals with two maintenance bays, along with warehouse space and trans-loading capabilities, into the KAG portfolio.
9. What pricing options are available for accessing the report?
Pricing options include single-user, multi-user, and enterprise licenses priced at USD 3800, USD 4500, and USD 5800 respectively.
10. Is the market size provided in terms of value or volume?
The market size is provided in terms of value, measured in Million.
11. Are there any specific market keywords associated with the report?
Yes, the market keyword associated with the report is "USA Tank Trucking Market," which aids in identifying and referencing the specific market segment covered.
12. How do I determine which pricing option suits my needs best?
The pricing options vary based on user requirements and access needs. Individual users may opt for single-user licenses, while businesses requiring broader access may choose multi-user or enterprise licenses for cost-effective access to the report.
13. Are there any additional resources or data provided in the USA Tank Trucking Market report?
While the report offers comprehensive insights, it's advisable to review the specific contents or supplementary materials provided to ascertain if additional resources or data are available.
14. How can I stay updated on further developments or reports in the USA Tank Trucking Market?
To stay informed about further developments, trends, and reports in the USA Tank Trucking Market, consider subscribing to industry newsletters, following relevant companies and organizations, or regularly checking reputable industry news sources and publications.
Methodology
Step 1 - Identification of Relevant Samples Size from Population Database


Step 2 - Approaches for Defining Global Market Size (Value, Volume* & Price*)

Note*: In applicable scenarios
Step 3 - Data Sources
Primary Research
- Web Analytics
- Survey Reports
- Research Institute
- Latest Research Reports
- Opinion Leaders
Secondary Research
- Annual Reports
- White Paper
- Latest Press Release
- Industry Association
- Paid Database
- Investor Presentations

Step 4 - Data Triangulation
Involves using different sources of information in order to increase the validity of a study
These sources are likely to be stakeholders in a program - participants, other researchers, program staff, other community members, and so on.
Then we put all data in single framework & apply various statistical tools to find out the dynamic on the market.
During the analysis stage, feedback from the stakeholder groups would be compared to determine areas of agreement as well as areas of divergence