

Key Insights
The Asia-Pacific (APAC) Courier, Express, and Parcel (CEP) market is experiencing robust growth, driven by the expansion of e-commerce, the rise of digitalization across various industries, and increasing cross-border trade. A compound annual growth rate (CAGR) of 6.64% indicates a significant upward trajectory, projected to continue through 2033. This expansion is fueled by several key factors. The burgeoning e-commerce sector in countries like China, India, and Indonesia is a primary driver, demanding efficient and reliable delivery solutions. Furthermore, the increasing adoption of express delivery services across diverse end-user industries, including healthcare, manufacturing, and financial services, contributes significantly to market growth. The shift towards faster delivery speeds, with express services gaining popularity, also fuels market expansion. While the market faces challenges like infrastructure limitations in certain regions and fluctuating fuel prices, the overall positive growth outlook is undeniable. The diverse range of service models, including B2B, B2C, and C2C, caters to a broad spectrum of customer needs, further contributing to the market's dynamism. Competition among established players like DHL, FedEx, and UPS, alongside rapidly expanding regional carriers, ensures continuous innovation and service improvement.
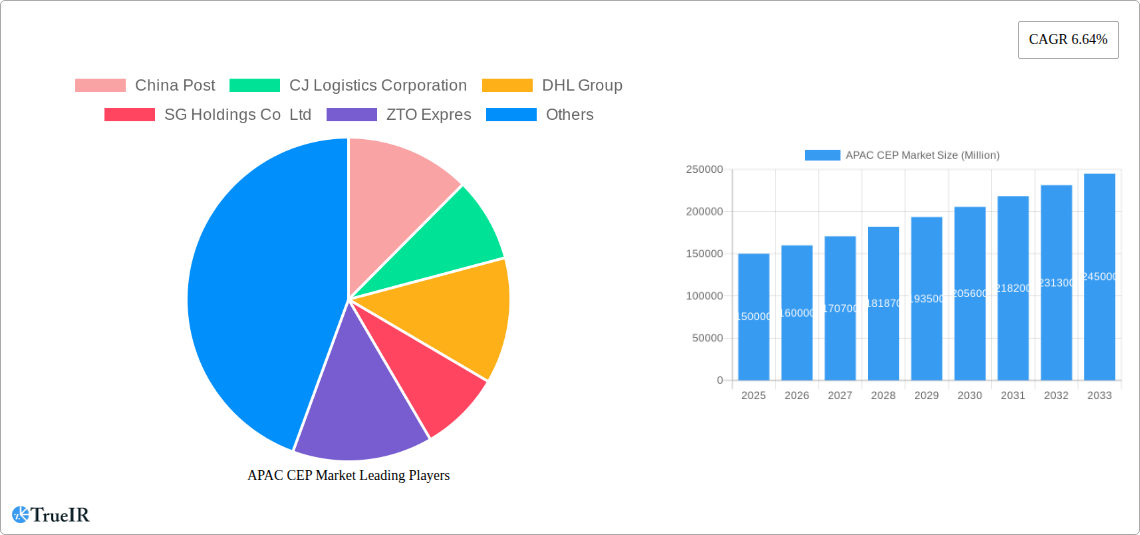
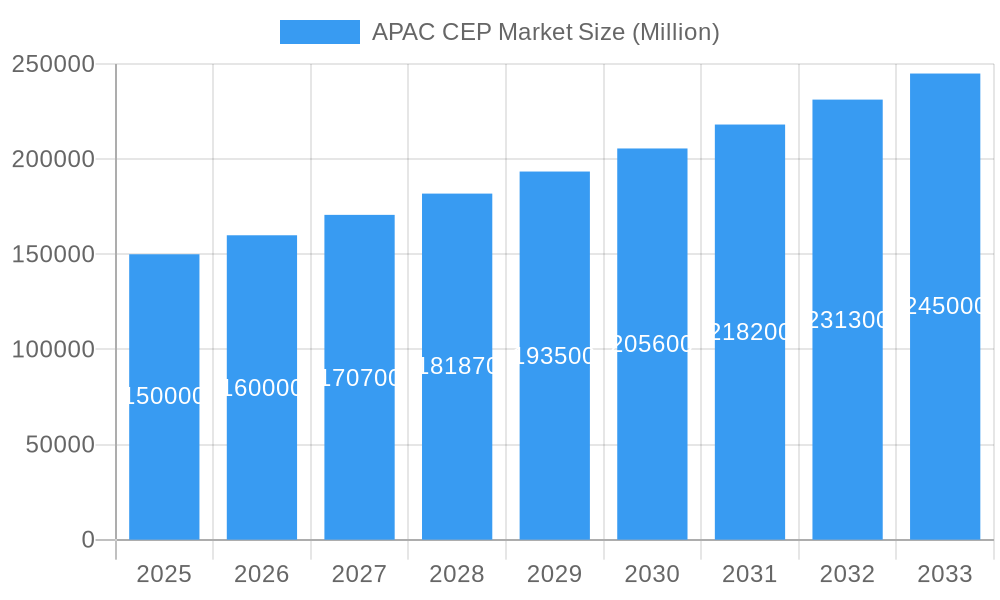
APAC CEP Market Market Size (In Billion)
The market segmentation reveals interesting dynamics. While air transport dominates express deliveries due to speed, road transport remains crucial for cost-effective non-express shipments, especially for heavier packages. The geographical spread is vast, with China and India representing major markets, followed by other rapidly developing economies in Southeast Asia. The domestic market generally exhibits higher volume than international shipments, although cross-border e-commerce is rapidly expanding. The heavier weight segment will likely see slower growth than lighter weight shipments due to higher costs, though both segments are vital to the overall market health. Future market growth will hinge on technological advancements (like automation and improved tracking), increased infrastructure investments, and sustained economic growth across the APAC region. Government regulations and policies also play a critical role in shaping market access and competitive landscape.
APAC CEP Market Company Market Share
Comprehensive APAC CEP Market Report: 2019-2033
This dynamic report provides a detailed analysis of the burgeoning Asia-Pacific Courier, Express, and Parcel (CEP) market, projecting significant growth from 2025 to 2033. The report leverages extensive data analysis from 2019-2024, establishing a robust baseline for forecasting market trends and identifying lucrative opportunities for investors and industry stakeholders. Benefit from in-depth insights into market segmentation, competitive dynamics, and future growth potential across various APAC nations.
APAC CEP Market Market Structure & Competitive Landscape
The APAC CEP market exhibits a moderately concentrated structure, with a few dominant players and a multitude of smaller regional operators. The market's concentration ratio (CR4) is estimated at xx%, indicating a level of competition that incentivizes innovation and efficiency. Key drivers of innovation include the rising adoption of e-commerce, the increasing demand for faster delivery speeds, and the continuous advancements in logistics technologies.
Regulatory landscapes vary across APAC countries, impacting operational costs and market access. Differing regulations on cross-border shipments and data privacy pose both opportunities and challenges. Product substitutes, such as postal services and dedicated freight forwarding, present limited competition due to the CEP market's unique speed and reliability attributes.
End-user segmentation is crucial to understand market dynamics. E-commerce is the dominant driver, followed by wholesale and retail trade (offline), and BFSI, with manufacturing and healthcare sectors showing promising growth. M&A activity has been moderate, with a total estimated volume of xx Million deals over the past five years, driven primarily by strategies of expansion into new markets and technological capabilities. The landscape is characterized by a constant shift of power through strategic alliances and mergers.
APAC CEP Market Market Trends & Opportunities
The APAC CEP market is poised for substantial growth, with a projected Compound Annual Growth Rate (CAGR) of xx% from 2025 to 2033, reaching a market size of xx Million by 2033. This robust growth is fueled by several factors, including the rapid expansion of e-commerce across the region, particularly in developing economies, and the escalating consumer preference for fast and reliable delivery options. Technological advancements, such as automation, AI-powered route optimization, and drone delivery, are transforming the sector's efficiency and capabilities. Market penetration rates are increasing steadily, particularly in emerging markets where traditional delivery systems are being disrupted by CEP providers. The dynamic competitive landscape, characterized by a mix of global giants and regional players, keeps innovation at the forefront.
Dominant Markets & Segments in APAC CEP Market
The APAC CEP market shows diverse growth across countries and segments.
Leading Countries:
- China: Dominates the market due to its enormous e-commerce sector and robust infrastructure, with a market share of xx%.
- India: Shows exponential growth driven by burgeoning e-commerce and a large, young population.
- Japan: Shows steady growth, driven by sophisticated logistics networks and a high level of consumer spending.
Leading Segments:
- Mode of Transport: Road transport holds the largest share, owing to its cost-effectiveness and widespread accessibility. Air freight is rapidly growing, driven by the need for faster delivery of high-value and time-sensitive goods.
- End User Industry: E-commerce continues to be the dominant driver, exceeding xx% of the market. Wholesale and retail trade (offline) follows closely, reflecting the increasing demand for efficient delivery across all sectors.
- Destination: Domestic shipments currently constitute the largest segment. However, International shipments are exhibiting a higher growth rate, driven by cross-border e-commerce.
- Speed of Delivery: Express delivery dominates due to rising customer expectations and the competitive landscape. Non-express services cater to cost-sensitive businesses and less time-critical shipments.
- Model: B2C accounts for the significant portion, mirroring the growth of online shopping. B2B remains vital, with significant contributions from businesses relying on efficient supply chains.
- Shipment Weight: The market is diversified across shipment weight categories, with a significant share across medium weight shipments, driven by the growth of e-commerce with a mix of products.
Key Growth Drivers:
- Rapid expansion of e-commerce
- Rising disposable incomes and consumer spending
- Government initiatives to improve infrastructure
- Technological advancements, such as automation and AI
APAC CEP Market Product Analysis
The APAC CEP market offers a diverse range of products tailored to the specific needs of various industries and customer segments. These range from standard express delivery services to specialized solutions such as temperature-controlled shipments for pharmaceuticals and high-value goods. Continuous technological advancements have led to the development of more efficient delivery networks and integrated supply chain solutions. The market is characterized by a strong focus on enhancing speed, reliability, and tracking capabilities to meet rising customer expectations. The key to competitiveness lies in offering customized, cost-effective, and technologically advanced services.
Key Drivers, Barriers & Challenges in APAC CEP Market
Key Drivers:
The APAC CEP market is propelled by several factors: booming e-commerce, increasing urbanization, rising disposable incomes, and government investment in infrastructure development, leading to significant advancements in logistics technologies.
Challenges and Restraints:
The market faces considerable challenges: infrastructure limitations in certain areas, varying regulatory environments across countries, escalating fuel costs, and fierce competition from both established and new entrants. These restraints can lead to increased operational costs and delayed deliveries. Supply chain disruptions are amplified by geopolitical uncertainties, impacting the availability of transportation resources and the overall efficiency of delivery networks. The quantifiable impact of these constraints can vary considerably across regions.
Growth Drivers in the APAC CEP Market Market
The APAC CEP market thrives on robust e-commerce growth, favorable government policies promoting logistics modernization, and the integration of advanced technologies, like AI-powered route optimization and automated sorting facilities. The rising disposable incomes within the region further fuels this expansion. These factors collectively drive efficiency, speed, and service quality improvements.
Challenges Impacting APAC CEP Market Growth
Significant challenges include infrastructural gaps in certain regions, particularly the last-mile delivery segment, along with the complexities of diverse regulatory landscapes across APAC. Increased fuel prices and fierce competition for market share also present obstacles for growth.
Key Players Shaping the APAC CEP Market Market
- China Post
- CJ Logistics Corporation
- DHL Group
- SG Holdings Co Ltd
- ZTO Expres
- FedEx
- United Parcel Service of America Inc (UPS)
- YTO Express
- Yamato Holdings
- SF Express (KEX-SF)
- Blue Dart Express
- DTDC Express Limited
- Toll Group
- JWD Group
Significant APAC CEP Market Industry Milestones
- June 2023: China Post launched its first integrated indoor and outdoor “Robot Plus” AI delivery solution, significantly enhancing last-mile efficiency.
- April 2023: China Post partnered with Ping An Bank to launch an intelligent archives service center, integrating auto finance and logistics services.
- March 2023: Colowide MD Co. Ltd and Yamato Transport Co. Ltd agreed to optimize the Colowide Group's supply chain, signifying enhanced supply chain collaboration.
Future Outlook for APAC CEP Market Market
The APAC CEP market is projected to experience continued robust growth, driven by sustained e-commerce expansion, technological innovations, and favorable regulatory environments. Strategic investments in infrastructure and the adoption of sustainable practices will be pivotal in maintaining this trajectory. The potential for market expansion remains substantial, with opportunities in less-penetrated markets and the development of niche services.
APAC CEP Market Segmentation
-
1. Destination
- 1.1. Domestic
- 1.2. International
-
2. Speed Of Delivery
- 2.1. Express
- 2.2. Non-Express
-
3. Model
- 3.1. Business-to-Business (B2B)
- 3.2. Business-to-Consumer (B2C)
- 3.3. Consumer-to-Consumer (C2C)
-
4. Shipment Weight
- 4.1. Heavy Weight Shipments
- 4.2. Light Weight Shipments
- 4.3. Medium Weight Shipments
-
5. Mode Of Transport
- 5.1. Air
- 5.2. Road
- 5.3. Others
-
6. End User Industry
- 6.1. E-Commerce
- 6.2. Financial Services (BFSI)
- 6.3. Healthcare
- 6.4. Manufacturing
- 6.5. Primary Industry
- 6.6. Wholesale and Retail Trade (Offline)
- 6.7. Others
APAC CEP Market Segmentation By Geography
-
1. North America
- 1.1. United States
- 1.2. Canada
- 1.3. Mexico
-
2. South America
- 2.1. Brazil
- 2.2. Argentina
- 2.3. Rest of South America
-
3. Europe
- 3.1. United Kingdom
- 3.2. Germany
- 3.3. France
- 3.4. Italy
- 3.5. Spain
- 3.6. Russia
- 3.7. Benelux
- 3.8. Nordics
- 3.9. Rest of Europe
-
4. Middle East & Africa
- 4.1. Turkey
- 4.2. Israel
- 4.3. GCC
- 4.4. North Africa
- 4.5. South Africa
- 4.6. Rest of Middle East & Africa
-
5. Asia Pacific
- 5.1. China
- 5.2. India
- 5.3. Japan
- 5.4. South Korea
- 5.5. ASEAN
- 5.6. Oceania
- 5.7. Rest of Asia Pacific
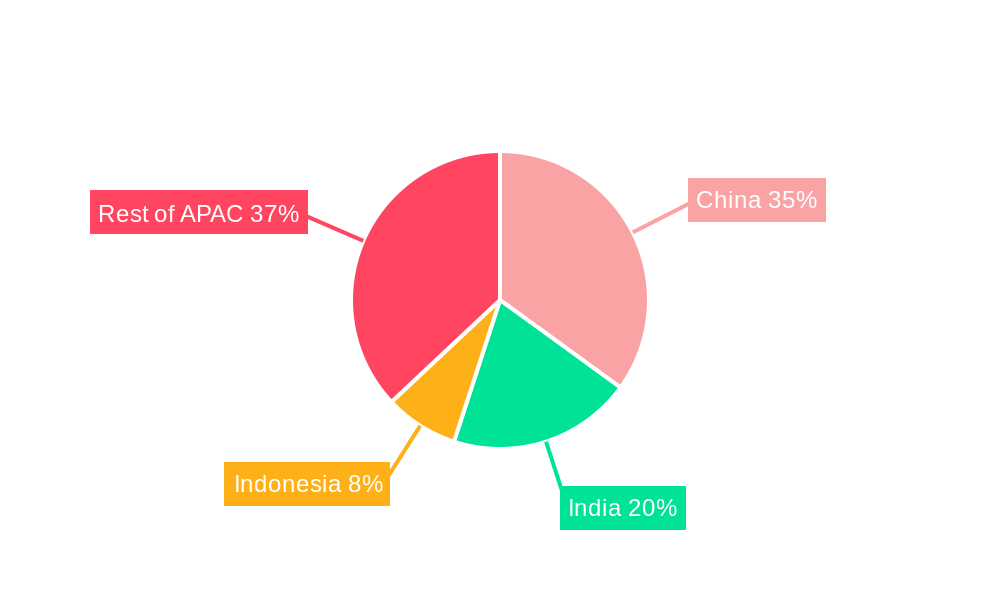
APAC CEP Market Regional Market Share
Geographic Coverage of APAC CEP Market
APAC CEP Market REPORT HIGHLIGHTS
| Aspects | Details |
|---|---|
| Study Period | 2020-2034 |
| Base Year | 2025 |
| Estimated Year | 2026 |
| Forecast Period | 2026-2034 |
| Historical Period | 2020-2025 |
| Growth Rate | CAGR of 6.64% from 2020-2034 |
| Segmentation |
|
Table of Contents
- 1. Introduction
- 1.1. Research Scope
- 1.2. Market Segmentation
- 1.3. Research Objective
- 1.4. Definitions and Assumptions
- 2. Executive Summary
- 2.1. Market Snapshot
- 3. Market Dynamics
- 3.1. Market Drivers
- 3.2. Market Restrains
- 3.3. Market Trends
- 3.4. Market Opportunities
- 4. Market Factor Analysis
- 4.1. Porters Five Forces
- 4.1.1. Bargaining Power of Suppliers
- 4.1.2. Bargaining Power of Buyers
- 4.1.3. Threat of New Entrants
- 4.1.4. Threat of Substitutes
- 4.1.5. Competitive Rivalry
- 4.2. PESTEL analysis
- 4.3. BCG Analysis
- 4.3.1. Stars (High Growth, High Market Share)
- 4.3.2. Cash Cows (Low Growth, High Market Share)
- 4.3.3. Question Mark (High Growth, Low Market Share)
- 4.3.4. Dogs (Low Growth, Low Market Share)
- 4.4. Ansoff Matrix Analysis
- 4.5. Supply Chain Analysis
- 4.6. Regulatory Landscape
- 4.7. Current Market Potential and Opportunity Assessment (TAM–SAM–SOM Framework)
- 4.8. TIR Analyst Note
- 4.1. Porters Five Forces
- 5. Market Analysis, Insights and Forecast 2021-2033
- 5.1. Market Analysis, Insights and Forecast - by Destination
- 5.1.1. Domestic
- 5.1.2. International
- 5.2. Market Analysis, Insights and Forecast - by Speed Of Delivery
- 5.2.1. Express
- 5.2.2. Non-Express
- 5.3. Market Analysis, Insights and Forecast - by Model
- 5.3.1. Business-to-Business (B2B)
- 5.3.2. Business-to-Consumer (B2C)
- 5.3.3. Consumer-to-Consumer (C2C)
- 5.4. Market Analysis, Insights and Forecast - by Shipment Weight
- 5.4.1. Heavy Weight Shipments
- 5.4.2. Light Weight Shipments
- 5.4.3. Medium Weight Shipments
- 5.5. Market Analysis, Insights and Forecast - by Mode Of Transport
- 5.5.1. Air
- 5.5.2. Road
- 5.5.3. Others
- 5.6. Market Analysis, Insights and Forecast - by End User Industry
- 5.6.1. E-Commerce
- 5.6.2. Financial Services (BFSI)
- 5.6.3. Healthcare
- 5.6.4. Manufacturing
- 5.6.5. Primary Industry
- 5.6.6. Wholesale and Retail Trade (Offline)
- 5.6.7. Others
- 5.7. Market Analysis, Insights and Forecast - by Region
- 5.7.1. North America
- 5.7.2. South America
- 5.7.3. Europe
- 5.7.4. Middle East & Africa
- 5.7.5. Asia Pacific
- 5.1. Market Analysis, Insights and Forecast - by Destination
- 6. Global APAC CEP Market Analysis, Insights and Forecast, 2021-2033
- 6.1. Market Analysis, Insights and Forecast - by Destination
- 6.1.1. Domestic
- 6.1.2. International
- 6.2. Market Analysis, Insights and Forecast - by Speed Of Delivery
- 6.2.1. Express
- 6.2.2. Non-Express
- 6.3. Market Analysis, Insights and Forecast - by Model
- 6.3.1. Business-to-Business (B2B)
- 6.3.2. Business-to-Consumer (B2C)
- 6.3.3. Consumer-to-Consumer (C2C)
- 6.4. Market Analysis, Insights and Forecast - by Shipment Weight
- 6.4.1. Heavy Weight Shipments
- 6.4.2. Light Weight Shipments
- 6.4.3. Medium Weight Shipments
- 6.5. Market Analysis, Insights and Forecast - by Mode Of Transport
- 6.5.1. Air
- 6.5.2. Road
- 6.5.3. Others
- 6.6. Market Analysis, Insights and Forecast - by End User Industry
- 6.6.1. E-Commerce
- 6.6.2. Financial Services (BFSI)
- 6.6.3. Healthcare
- 6.6.4. Manufacturing
- 6.6.5. Primary Industry
- 6.6.6. Wholesale and Retail Trade (Offline)
- 6.6.7. Others
- 6.1. Market Analysis, Insights and Forecast - by Destination
- 7. North America APAC CEP Market Analysis, Insights and Forecast, 2020-2032
- 7.1. Market Analysis, Insights and Forecast - by Destination
- 7.1.1. Domestic
- 7.1.2. International
- 7.2. Market Analysis, Insights and Forecast - by Speed Of Delivery
- 7.2.1. Express
- 7.2.2. Non-Express
- 7.3. Market Analysis, Insights and Forecast - by Model
- 7.3.1. Business-to-Business (B2B)
- 7.3.2. Business-to-Consumer (B2C)
- 7.3.3. Consumer-to-Consumer (C2C)
- 7.4. Market Analysis, Insights and Forecast - by Shipment Weight
- 7.4.1. Heavy Weight Shipments
- 7.4.2. Light Weight Shipments
- 7.4.3. Medium Weight Shipments
- 7.5. Market Analysis, Insights and Forecast - by Mode Of Transport
- 7.5.1. Air
- 7.5.2. Road
- 7.5.3. Others
- 7.6. Market Analysis, Insights and Forecast - by End User Industry
- 7.6.1. E-Commerce
- 7.6.2. Financial Services (BFSI)
- 7.6.3. Healthcare
- 7.6.4. Manufacturing
- 7.6.5. Primary Industry
- 7.6.6. Wholesale and Retail Trade (Offline)
- 7.6.7. Others
- 7.1. Market Analysis, Insights and Forecast - by Destination
- 8. South America APAC CEP Market Analysis, Insights and Forecast, 2020-2032
- 8.1. Market Analysis, Insights and Forecast - by Destination
- 8.1.1. Domestic
- 8.1.2. International
- 8.2. Market Analysis, Insights and Forecast - by Speed Of Delivery
- 8.2.1. Express
- 8.2.2. Non-Express
- 8.3. Market Analysis, Insights and Forecast - by Model
- 8.3.1. Business-to-Business (B2B)
- 8.3.2. Business-to-Consumer (B2C)
- 8.3.3. Consumer-to-Consumer (C2C)
- 8.4. Market Analysis, Insights and Forecast - by Shipment Weight
- 8.4.1. Heavy Weight Shipments
- 8.4.2. Light Weight Shipments
- 8.4.3. Medium Weight Shipments
- 8.5. Market Analysis, Insights and Forecast - by Mode Of Transport
- 8.5.1. Air
- 8.5.2. Road
- 8.5.3. Others
- 8.6. Market Analysis, Insights and Forecast - by End User Industry
- 8.6.1. E-Commerce
- 8.6.2. Financial Services (BFSI)
- 8.6.3. Healthcare
- 8.6.4. Manufacturing
- 8.6.5. Primary Industry
- 8.6.6. Wholesale and Retail Trade (Offline)
- 8.6.7. Others
- 8.1. Market Analysis, Insights and Forecast - by Destination
- 9. Europe APAC CEP Market Analysis, Insights and Forecast, 2020-2032
- 9.1. Market Analysis, Insights and Forecast - by Destination
- 9.1.1. Domestic
- 9.1.2. International
- 9.2. Market Analysis, Insights and Forecast - by Speed Of Delivery
- 9.2.1. Express
- 9.2.2. Non-Express
- 9.3. Market Analysis, Insights and Forecast - by Model
- 9.3.1. Business-to-Business (B2B)
- 9.3.2. Business-to-Consumer (B2C)
- 9.3.3. Consumer-to-Consumer (C2C)
- 9.4. Market Analysis, Insights and Forecast - by Shipment Weight
- 9.4.1. Heavy Weight Shipments
- 9.4.2. Light Weight Shipments
- 9.4.3. Medium Weight Shipments
- 9.5. Market Analysis, Insights and Forecast - by Mode Of Transport
- 9.5.1. Air
- 9.5.2. Road
- 9.5.3. Others
- 9.6. Market Analysis, Insights and Forecast - by End User Industry
- 9.6.1. E-Commerce
- 9.6.2. Financial Services (BFSI)
- 9.6.3. Healthcare
- 9.6.4. Manufacturing
- 9.6.5. Primary Industry
- 9.6.6. Wholesale and Retail Trade (Offline)
- 9.6.7. Others
- 9.1. Market Analysis, Insights and Forecast - by Destination
- 10. Middle East & Africa APAC CEP Market Analysis, Insights and Forecast, 2020-2032
- 10.1. Market Analysis, Insights and Forecast - by Destination
- 10.1.1. Domestic
- 10.1.2. International
- 10.2. Market Analysis, Insights and Forecast - by Speed Of Delivery
- 10.2.1. Express
- 10.2.2. Non-Express
- 10.3. Market Analysis, Insights and Forecast - by Model
- 10.3.1. Business-to-Business (B2B)
- 10.3.2. Business-to-Consumer (B2C)
- 10.3.3. Consumer-to-Consumer (C2C)
- 10.4. Market Analysis, Insights and Forecast - by Shipment Weight
- 10.4.1. Heavy Weight Shipments
- 10.4.2. Light Weight Shipments
- 10.4.3. Medium Weight Shipments
- 10.5. Market Analysis, Insights and Forecast - by Mode Of Transport
- 10.5.1. Air
- 10.5.2. Road
- 10.5.3. Others
- 10.6. Market Analysis, Insights and Forecast - by End User Industry
- 10.6.1. E-Commerce
- 10.6.2. Financial Services (BFSI)
- 10.6.3. Healthcare
- 10.6.4. Manufacturing
- 10.6.5. Primary Industry
- 10.6.6. Wholesale and Retail Trade (Offline)
- 10.6.7. Others
- 10.1. Market Analysis, Insights and Forecast - by Destination
- 11. Asia Pacific APAC CEP Market Analysis, Insights and Forecast, 2020-2032
- 11.1. Market Analysis, Insights and Forecast - by Destination
- 11.1.1. Domestic
- 11.1.2. International
- 11.2. Market Analysis, Insights and Forecast - by Speed Of Delivery
- 11.2.1. Express
- 11.2.2. Non-Express
- 11.3. Market Analysis, Insights and Forecast - by Model
- 11.3.1. Business-to-Business (B2B)
- 11.3.2. Business-to-Consumer (B2C)
- 11.3.3. Consumer-to-Consumer (C2C)
- 11.4. Market Analysis, Insights and Forecast - by Shipment Weight
- 11.4.1. Heavy Weight Shipments
- 11.4.2. Light Weight Shipments
- 11.4.3. Medium Weight Shipments
- 11.5. Market Analysis, Insights and Forecast - by Mode Of Transport
- 11.5.1. Air
- 11.5.2. Road
- 11.5.3. Others
- 11.6. Market Analysis, Insights and Forecast - by End User Industry
- 11.6.1. E-Commerce
- 11.6.2. Financial Services (BFSI)
- 11.6.3. Healthcare
- 11.6.4. Manufacturing
- 11.6.5. Primary Industry
- 11.6.6. Wholesale and Retail Trade (Offline)
- 11.6.7. Others
- 11.1. Market Analysis, Insights and Forecast - by Destination
- 12. Competitive Analysis
- 12.1. Company Profiles
- 12.1.1 China Post
- 12.1.1.1. Company Overview
- 12.1.1.2. Products
- 12.1.1.3. Company Financials
- 12.1.1.4. SWOT Analysis
- 12.1.2 CJ Logistics Corporation
- 12.1.2.1. Company Overview
- 12.1.2.2. Products
- 12.1.2.3. Company Financials
- 12.1.2.4. SWOT Analysis
- 12.1.3 DHL Group
- 12.1.3.1. Company Overview
- 12.1.3.2. Products
- 12.1.3.3. Company Financials
- 12.1.3.4. SWOT Analysis
- 12.1.4 SG Holdings Co Ltd
- 12.1.4.1. Company Overview
- 12.1.4.2. Products
- 12.1.4.3. Company Financials
- 12.1.4.4. SWOT Analysis
- 12.1.5 ZTO Expres
- 12.1.5.1. Company Overview
- 12.1.5.2. Products
- 12.1.5.3. Company Financials
- 12.1.5.4. SWOT Analysis
- 12.1.6 FedEx
- 12.1.6.1. Company Overview
- 12.1.6.2. Products
- 12.1.6.3. Company Financials
- 12.1.6.4. SWOT Analysis
- 12.1.7 United Parcel Service of America Inc (UPS)
- 12.1.7.1. Company Overview
- 12.1.7.2. Products
- 12.1.7.3. Company Financials
- 12.1.7.4. SWOT Analysis
- 12.1.8 YTO Express
- 12.1.8.1. Company Overview
- 12.1.8.2. Products
- 12.1.8.3. Company Financials
- 12.1.8.4. SWOT Analysis
- 12.1.9 Yamato Holdings
- 12.1.9.1. Company Overview
- 12.1.9.2. Products
- 12.1.9.3. Company Financials
- 12.1.9.4. SWOT Analysis
- 12.1.10 SF Express (KEX-SF)
- 12.1.10.1. Company Overview
- 12.1.10.2. Products
- 12.1.10.3. Company Financials
- 12.1.10.4. SWOT Analysis
- 12.1.11 Blue Dart Express
- 12.1.11.1. Company Overview
- 12.1.11.2. Products
- 12.1.11.3. Company Financials
- 12.1.11.4. SWOT Analysis
- 12.1.12 DTDC Express Limited
- 12.1.12.1. Company Overview
- 12.1.12.2. Products
- 12.1.12.3. Company Financials
- 12.1.12.4. SWOT Analysis
- 12.1.13 Toll Group
- 12.1.13.1. Company Overview
- 12.1.13.2. Products
- 12.1.13.3. Company Financials
- 12.1.13.4. SWOT Analysis
- 12.1.14 JWD Group
- 12.1.14.1. Company Overview
- 12.1.14.2. Products
- 12.1.14.3. Company Financials
- 12.1.14.4. SWOT Analysis
- 12.1.1 China Post
- 12.2. Market Entropy
- 12.2.1 Company's Key Areas Served
- 12.2.2 Recent Developments
- 12.3. Company Market Share Analysis 2025
- 12.3.1 Top 5 Companies Market Share Analysis
- 12.3.2 Top 3 Companies Market Share Analysis
- 12.4. List of Potential Customers
- 13. Research Methodology
List of Figures
- Figure 1: Global APAC CEP Market Revenue Breakdown (Million, %) by Region 2025 & 2033
- Figure 2: North America APAC CEP Market Revenue (Million), by Destination 2025 & 2033
- Figure 3: North America APAC CEP Market Revenue Share (%), by Destination 2025 & 2033
- Figure 4: North America APAC CEP Market Revenue (Million), by Speed Of Delivery 2025 & 2033
- Figure 5: North America APAC CEP Market Revenue Share (%), by Speed Of Delivery 2025 & 2033
- Figure 6: North America APAC CEP Market Revenue (Million), by Model 2025 & 2033
- Figure 7: North America APAC CEP Market Revenue Share (%), by Model 2025 & 2033
- Figure 8: North America APAC CEP Market Revenue (Million), by Shipment Weight 2025 & 2033
- Figure 9: North America APAC CEP Market Revenue Share (%), by Shipment Weight 2025 & 2033
- Figure 10: North America APAC CEP Market Revenue (Million), by Mode Of Transport 2025 & 2033
- Figure 11: North America APAC CEP Market Revenue Share (%), by Mode Of Transport 2025 & 2033
- Figure 12: North America APAC CEP Market Revenue (Million), by End User Industry 2025 & 2033
- Figure 13: North America APAC CEP Market Revenue Share (%), by End User Industry 2025 & 2033
- Figure 14: North America APAC CEP Market Revenue (Million), by Country 2025 & 2033
- Figure 15: North America APAC CEP Market Revenue Share (%), by Country 2025 & 2033
- Figure 16: South America APAC CEP Market Revenue (Million), by Destination 2025 & 2033
- Figure 17: South America APAC CEP Market Revenue Share (%), by Destination 2025 & 2033
- Figure 18: South America APAC CEP Market Revenue (Million), by Speed Of Delivery 2025 & 2033
- Figure 19: South America APAC CEP Market Revenue Share (%), by Speed Of Delivery 2025 & 2033
- Figure 20: South America APAC CEP Market Revenue (Million), by Model 2025 & 2033
- Figure 21: South America APAC CEP Market Revenue Share (%), by Model 2025 & 2033
- Figure 22: South America APAC CEP Market Revenue (Million), by Shipment Weight 2025 & 2033
- Figure 23: South America APAC CEP Market Revenue Share (%), by Shipment Weight 2025 & 2033
- Figure 24: South America APAC CEP Market Revenue (Million), by Mode Of Transport 2025 & 2033
- Figure 25: South America APAC CEP Market Revenue Share (%), by Mode Of Transport 2025 & 2033
- Figure 26: South America APAC CEP Market Revenue (Million), by End User Industry 2025 & 2033
- Figure 27: South America APAC CEP Market Revenue Share (%), by End User Industry 2025 & 2033
- Figure 28: South America APAC CEP Market Revenue (Million), by Country 2025 & 2033
- Figure 29: South America APAC CEP Market Revenue Share (%), by Country 2025 & 2033
- Figure 30: Europe APAC CEP Market Revenue (Million), by Destination 2025 & 2033
- Figure 31: Europe APAC CEP Market Revenue Share (%), by Destination 2025 & 2033
- Figure 32: Europe APAC CEP Market Revenue (Million), by Speed Of Delivery 2025 & 2033
- Figure 33: Europe APAC CEP Market Revenue Share (%), by Speed Of Delivery 2025 & 2033
- Figure 34: Europe APAC CEP Market Revenue (Million), by Model 2025 & 2033
- Figure 35: Europe APAC CEP Market Revenue Share (%), by Model 2025 & 2033
- Figure 36: Europe APAC CEP Market Revenue (Million), by Shipment Weight 2025 & 2033
- Figure 37: Europe APAC CEP Market Revenue Share (%), by Shipment Weight 2025 & 2033
- Figure 38: Europe APAC CEP Market Revenue (Million), by Mode Of Transport 2025 & 2033
- Figure 39: Europe APAC CEP Market Revenue Share (%), by Mode Of Transport 2025 & 2033
- Figure 40: Europe APAC CEP Market Revenue (Million), by End User Industry 2025 & 2033
- Figure 41: Europe APAC CEP Market Revenue Share (%), by End User Industry 2025 & 2033
- Figure 42: Europe APAC CEP Market Revenue (Million), by Country 2025 & 2033
- Figure 43: Europe APAC CEP Market Revenue Share (%), by Country 2025 & 2033
- Figure 44: Middle East & Africa APAC CEP Market Revenue (Million), by Destination 2025 & 2033
- Figure 45: Middle East & Africa APAC CEP Market Revenue Share (%), by Destination 2025 & 2033
- Figure 46: Middle East & Africa APAC CEP Market Revenue (Million), by Speed Of Delivery 2025 & 2033
- Figure 47: Middle East & Africa APAC CEP Market Revenue Share (%), by Speed Of Delivery 2025 & 2033
- Figure 48: Middle East & Africa APAC CEP Market Revenue (Million), by Model 2025 & 2033
- Figure 49: Middle East & Africa APAC CEP Market Revenue Share (%), by Model 2025 & 2033
- Figure 50: Middle East & Africa APAC CEP Market Revenue (Million), by Shipment Weight 2025 & 2033
- Figure 51: Middle East & Africa APAC CEP Market Revenue Share (%), by Shipment Weight 2025 & 2033
- Figure 52: Middle East & Africa APAC CEP Market Revenue (Million), by Mode Of Transport 2025 & 2033
- Figure 53: Middle East & Africa APAC CEP Market Revenue Share (%), by Mode Of Transport 2025 & 2033
- Figure 54: Middle East & Africa APAC CEP Market Revenue (Million), by End User Industry 2025 & 2033
- Figure 55: Middle East & Africa APAC CEP Market Revenue Share (%), by End User Industry 2025 & 2033
- Figure 56: Middle East & Africa APAC CEP Market Revenue (Million), by Country 2025 & 2033
- Figure 57: Middle East & Africa APAC CEP Market Revenue Share (%), by Country 2025 & 2033
- Figure 58: Asia Pacific APAC CEP Market Revenue (Million), by Destination 2025 & 2033
- Figure 59: Asia Pacific APAC CEP Market Revenue Share (%), by Destination 2025 & 2033
- Figure 60: Asia Pacific APAC CEP Market Revenue (Million), by Speed Of Delivery 2025 & 2033
- Figure 61: Asia Pacific APAC CEP Market Revenue Share (%), by Speed Of Delivery 2025 & 2033
- Figure 62: Asia Pacific APAC CEP Market Revenue (Million), by Model 2025 & 2033
- Figure 63: Asia Pacific APAC CEP Market Revenue Share (%), by Model 2025 & 2033
- Figure 64: Asia Pacific APAC CEP Market Revenue (Million), by Shipment Weight 2025 & 2033
- Figure 65: Asia Pacific APAC CEP Market Revenue Share (%), by Shipment Weight 2025 & 2033
- Figure 66: Asia Pacific APAC CEP Market Revenue (Million), by Mode Of Transport 2025 & 2033
- Figure 67: Asia Pacific APAC CEP Market Revenue Share (%), by Mode Of Transport 2025 & 2033
- Figure 68: Asia Pacific APAC CEP Market Revenue (Million), by End User Industry 2025 & 2033
- Figure 69: Asia Pacific APAC CEP Market Revenue Share (%), by End User Industry 2025 & 2033
- Figure 70: Asia Pacific APAC CEP Market Revenue (Million), by Country 2025 & 2033
- Figure 71: Asia Pacific APAC CEP Market Revenue Share (%), by Country 2025 & 2033
List of Tables
- Table 1: Global APAC CEP Market Revenue Million Forecast, by Destination 2020 & 2033
- Table 2: Global APAC CEP Market Revenue Million Forecast, by Speed Of Delivery 2020 & 2033
- Table 3: Global APAC CEP Market Revenue Million Forecast, by Model 2020 & 2033
- Table 4: Global APAC CEP Market Revenue Million Forecast, by Shipment Weight 2020 & 2033
- Table 5: Global APAC CEP Market Revenue Million Forecast, by Mode Of Transport 2020 & 2033
- Table 6: Global APAC CEP Market Revenue Million Forecast, by End User Industry 2020 & 2033
- Table 7: Global APAC CEP Market Revenue Million Forecast, by Region 2020 & 2033
- Table 8: Global APAC CEP Market Revenue Million Forecast, by Destination 2020 & 2033
- Table 9: Global APAC CEP Market Revenue Million Forecast, by Speed Of Delivery 2020 & 2033
- Table 10: Global APAC CEP Market Revenue Million Forecast, by Model 2020 & 2033
- Table 11: Global APAC CEP Market Revenue Million Forecast, by Shipment Weight 2020 & 2033
- Table 12: Global APAC CEP Market Revenue Million Forecast, by Mode Of Transport 2020 & 2033
- Table 13: Global APAC CEP Market Revenue Million Forecast, by End User Industry 2020 & 2033
- Table 14: Global APAC CEP Market Revenue Million Forecast, by Country 2020 & 2033
- Table 15: United States APAC CEP Market Revenue (Million) Forecast, by Application 2020 & 2033
- Table 16: Canada APAC CEP Market Revenue (Million) Forecast, by Application 2020 & 2033
- Table 17: Mexico APAC CEP Market Revenue (Million) Forecast, by Application 2020 & 2033
- Table 18: Global APAC CEP Market Revenue Million Forecast, by Destination 2020 & 2033
- Table 19: Global APAC CEP Market Revenue Million Forecast, by Speed Of Delivery 2020 & 2033
- Table 20: Global APAC CEP Market Revenue Million Forecast, by Model 2020 & 2033
- Table 21: Global APAC CEP Market Revenue Million Forecast, by Shipment Weight 2020 & 2033
- Table 22: Global APAC CEP Market Revenue Million Forecast, by Mode Of Transport 2020 & 2033
- Table 23: Global APAC CEP Market Revenue Million Forecast, by End User Industry 2020 & 2033
- Table 24: Global APAC CEP Market Revenue Million Forecast, by Country 2020 & 2033
- Table 25: Brazil APAC CEP Market Revenue (Million) Forecast, by Application 2020 & 2033
- Table 26: Argentina APAC CEP Market Revenue (Million) Forecast, by Application 2020 & 2033
- Table 27: Rest of South America APAC CEP Market Revenue (Million) Forecast, by Application 2020 & 2033
- Table 28: Global APAC CEP Market Revenue Million Forecast, by Destination 2020 & 2033
- Table 29: Global APAC CEP Market Revenue Million Forecast, by Speed Of Delivery 2020 & 2033
- Table 30: Global APAC CEP Market Revenue Million Forecast, by Model 2020 & 2033
- Table 31: Global APAC CEP Market Revenue Million Forecast, by Shipment Weight 2020 & 2033
- Table 32: Global APAC CEP Market Revenue Million Forecast, by Mode Of Transport 2020 & 2033
- Table 33: Global APAC CEP Market Revenue Million Forecast, by End User Industry 2020 & 2033
- Table 34: Global APAC CEP Market Revenue Million Forecast, by Country 2020 & 2033
- Table 35: United Kingdom APAC CEP Market Revenue (Million) Forecast, by Application 2020 & 2033
- Table 36: Germany APAC CEP Market Revenue (Million) Forecast, by Application 2020 & 2033
- Table 37: France APAC CEP Market Revenue (Million) Forecast, by Application 2020 & 2033
- Table 38: Italy APAC CEP Market Revenue (Million) Forecast, by Application 2020 & 2033
- Table 39: Spain APAC CEP Market Revenue (Million) Forecast, by Application 2020 & 2033
- Table 40: Russia APAC CEP Market Revenue (Million) Forecast, by Application 2020 & 2033
- Table 41: Benelux APAC CEP Market Revenue (Million) Forecast, by Application 2020 & 2033
- Table 42: Nordics APAC CEP Market Revenue (Million) Forecast, by Application 2020 & 2033
- Table 43: Rest of Europe APAC CEP Market Revenue (Million) Forecast, by Application 2020 & 2033
- Table 44: Global APAC CEP Market Revenue Million Forecast, by Destination 2020 & 2033
- Table 45: Global APAC CEP Market Revenue Million Forecast, by Speed Of Delivery 2020 & 2033
- Table 46: Global APAC CEP Market Revenue Million Forecast, by Model 2020 & 2033
- Table 47: Global APAC CEP Market Revenue Million Forecast, by Shipment Weight 2020 & 2033
- Table 48: Global APAC CEP Market Revenue Million Forecast, by Mode Of Transport 2020 & 2033
- Table 49: Global APAC CEP Market Revenue Million Forecast, by End User Industry 2020 & 2033
- Table 50: Global APAC CEP Market Revenue Million Forecast, by Country 2020 & 2033
- Table 51: Turkey APAC CEP Market Revenue (Million) Forecast, by Application 2020 & 2033
- Table 52: Israel APAC CEP Market Revenue (Million) Forecast, by Application 2020 & 2033
- Table 53: GCC APAC CEP Market Revenue (Million) Forecast, by Application 2020 & 2033
- Table 54: North Africa APAC CEP Market Revenue (Million) Forecast, by Application 2020 & 2033
- Table 55: South Africa APAC CEP Market Revenue (Million) Forecast, by Application 2020 & 2033
- Table 56: Rest of Middle East & Africa APAC CEP Market Revenue (Million) Forecast, by Application 2020 & 2033
- Table 57: Global APAC CEP Market Revenue Million Forecast, by Destination 2020 & 2033
- Table 58: Global APAC CEP Market Revenue Million Forecast, by Speed Of Delivery 2020 & 2033
- Table 59: Global APAC CEP Market Revenue Million Forecast, by Model 2020 & 2033
- Table 60: Global APAC CEP Market Revenue Million Forecast, by Shipment Weight 2020 & 2033
- Table 61: Global APAC CEP Market Revenue Million Forecast, by Mode Of Transport 2020 & 2033
- Table 62: Global APAC CEP Market Revenue Million Forecast, by End User Industry 2020 & 2033
- Table 63: Global APAC CEP Market Revenue Million Forecast, by Country 2020 & 2033
- Table 64: China APAC CEP Market Revenue (Million) Forecast, by Application 2020 & 2033
- Table 65: India APAC CEP Market Revenue (Million) Forecast, by Application 2020 & 2033
- Table 66: Japan APAC CEP Market Revenue (Million) Forecast, by Application 2020 & 2033
- Table 67: South Korea APAC CEP Market Revenue (Million) Forecast, by Application 2020 & 2033
- Table 68: ASEAN APAC CEP Market Revenue (Million) Forecast, by Application 2020 & 2033
- Table 69: Oceania APAC CEP Market Revenue (Million) Forecast, by Application 2020 & 2033
- Table 70: Rest of Asia Pacific APAC CEP Market Revenue (Million) Forecast, by Application 2020 & 2033
Frequently Asked Questions
1. What is the projected Compound Annual Growth Rate (CAGR) of the APAC CEP Market?
The projected CAGR is approximately 6.64%.
2. Which companies are prominent players in the APAC CEP Market?
Key companies in the market include China Post, CJ Logistics Corporation, DHL Group, SG Holdings Co Ltd, ZTO Expres, FedEx, United Parcel Service of America Inc (UPS), YTO Express, Yamato Holdings, SF Express (KEX-SF), Blue Dart Express, DTDC Express Limited, Toll Group, JWD Group.
3. What are the main segments of the APAC CEP Market?
The market segments include Destination, Speed Of Delivery, Model, Shipment Weight, Mode Of Transport, End User Industry.
4. Can you provide details about the market size?
The market size is estimated to be USD XX Million as of 2022.
5. What are some drivers contributing to market growth?
E-commerce Fueling the Growth of 3PL Market.
6. What are the notable trends driving market growth?
OTHER KEY INDUSTRY TRENDS COVERED IN THE REPORT.
7. Are there any restraints impacting market growth?
Slow Infrastructure Development.
8. Can you provide examples of recent developments in the market?
June 2023: China Post launched its first integrated indoor and outdoor “Robot Plus” AI delivery solution in China. The intelligent delivery solution relies on a combination of unmanned vehicles outdoors and robots indoors, constructing an integrated indoor and outdoor unmanned distribution mode and developing a last-mile logistics network with AI transport capacity sharing.April 2023: China Post and the Automobile Consumption Financial Center of Ping An Bank Co. Ltd launched an intelligent archives service center in Guangdong to promote the service integration of auto finance and express and logistics businesses.March 2023: Colowide MD Co. Ltd, which oversees merchandising for the Colowide Group, and Yamato Transport Co. Ltd entered an agreement. The two companies will promote the visualization and optimization of the entire supply chain of Colowide Group, which operates multiple brands such as Gyu-Kaku, Kappa Sushi, and OOTOYA.
9. What pricing options are available for accessing the report?
Pricing options include single-user, multi-user, and enterprise licenses priced at USD 3800, USD 4500, and USD 5800 respectively.
10. Is the market size provided in terms of value or volume?
The market size is provided in terms of value, measured in Million.
11. Are there any specific market keywords associated with the report?
Yes, the market keyword associated with the report is "APAC CEP Market," which aids in identifying and referencing the specific market segment covered.
12. How do I determine which pricing option suits my needs best?
The pricing options vary based on user requirements and access needs. Individual users may opt for single-user licenses, while businesses requiring broader access may choose multi-user or enterprise licenses for cost-effective access to the report.
13. Are there any additional resources or data provided in the APAC CEP Market report?
While the report offers comprehensive insights, it's advisable to review the specific contents or supplementary materials provided to ascertain if additional resources or data are available.
14. How can I stay updated on further developments or reports in the APAC CEP Market?
To stay informed about further developments, trends, and reports in the APAC CEP Market, consider subscribing to industry newsletters, following relevant companies and organizations, or regularly checking reputable industry news sources and publications.
Methodology
Step 1 - Identification of Relevant Samples Size from Population Database


Step 2 - Approaches for Defining Global Market Size (Value, Volume* & Price*)

Note*: In applicable scenarios
Step 3 - Data Sources
Primary Research
- Web Analytics
- Survey Reports
- Research Institute
- Latest Research Reports
- Opinion Leaders
Secondary Research
- Annual Reports
- White Paper
- Latest Press Release
- Industry Association
- Paid Database
- Investor Presentations

Step 4 - Data Triangulation
Involves using different sources of information in order to increase the validity of a study
These sources are likely to be stakeholders in a program - participants, other researchers, program staff, other community members, and so on.
Then we put all data in single framework & apply various statistical tools to find out the dynamic on the market.
During the analysis stage, feedback from the stakeholder groups would be compared to determine areas of agreement as well as areas of divergence