

Key Insights
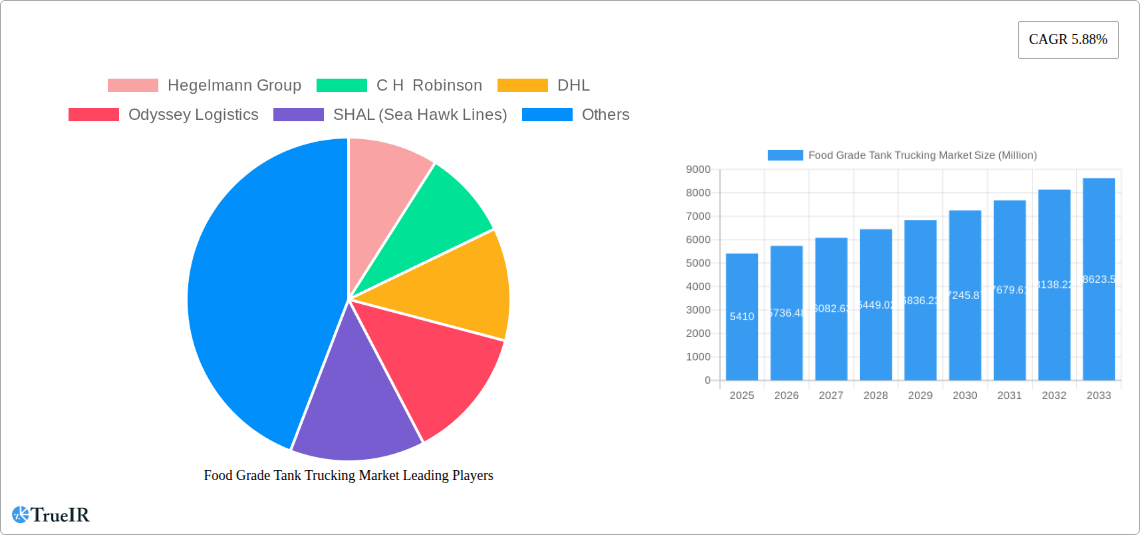
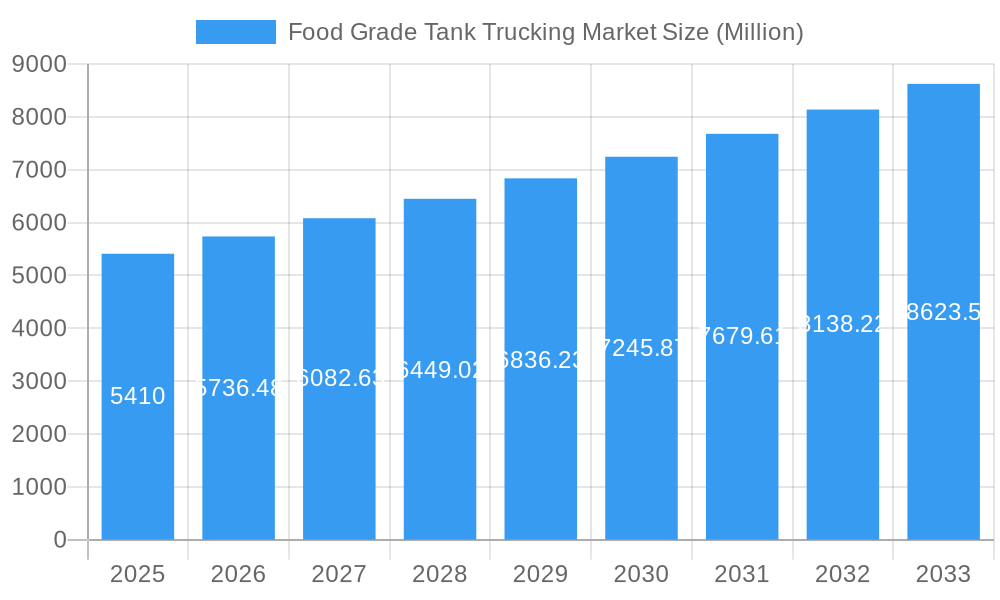
The global food grade tank trucking market, valued at $5.41 billion in 2025, is projected to experience robust growth, driven by the increasing demand for efficient and safe transportation of food and beverage products. The Compound Annual Growth Rate (CAGR) of 5.88% from 2025 to 2033 indicates a significant expansion, fueled by several key factors. The rising consumer preference for processed and packaged foods necessitates a reliable and specialized transportation network capable of maintaining product quality and safety. Growth in the food and beverage industry, particularly in emerging economies, further contributes to this market's expansion. Stringent government regulations regarding food safety and hygiene are also prompting companies to invest in specialized food-grade trucking services, ensuring compliance and minimizing risks. Furthermore, technological advancements, such as real-time tracking and temperature monitoring systems, are enhancing efficiency and transparency within the supply chain, boosting market growth. However, challenges remain, including fluctuating fuel prices, driver shortages, and the increasing complexity of regulatory compliance, potentially impacting market growth. The competitive landscape is characterized by established players like Hegelmann Group, C.H. Robinson, DHL, and Odyssey Logistics, alongside regional and specialized carriers. These companies are continuously striving for innovation and operational excellence to capture market share in this dynamic sector.
Food Grade Tank Trucking Market Market Size (In Billion)
This growth trajectory is expected to continue, with a significant portion of expansion driven by the increasing adoption of advanced technologies to enhance logistics and supply chain management. Companies are investing heavily in improving route optimization, enhancing fleet management, and integrating advanced analytics to improve operational efficiency and reduce overall transportation costs. The focus on sustainable practices within the food and beverage industry is also pushing the demand for eco-friendly transportation options, leading to innovation in fuel-efficient vehicles and alternative fuel technologies within the food-grade tank trucking sector. Regional variations in growth are expected, with developing economies likely to demonstrate faster growth rates due to their expanding food processing and distribution sectors. Strategic partnerships, mergers, and acquisitions among key players will likely shape the market landscape over the forecast period, further driving consolidation and enhancing service offerings.
Food Grade Tank Trucking Market Company Market Share
Food Grade Tank Trucking Market Report: 2019-2033
This comprehensive report provides an in-depth analysis of the Food Grade Tank Trucking Market, offering crucial insights for stakeholders seeking to navigate this dynamic sector. Covering the period from 2019 to 2033, with a focus on 2025, this report analyzes market size, trends, competitive landscape, and future outlook, equipping you with the knowledge to make informed business decisions. The market is projected to reach xx Million by 2033, presenting significant opportunities for growth and investment.
Food Grade Tank Trucking Market Market Structure & Competitive Landscape
The Food Grade Tank Trucking Market exhibits a moderately consolidated structure, with several key players dominating significant market shares. While precise concentration ratios are difficult to definitively state without proprietary data, the market displays characteristics of an oligopoly. Major players exert significant influence through their extensive networks, specialized fleets, and established client relationships. Innovation in this market is driven by technological advancements in vehicle efficiency, tracking, and safety, as well as increased demands for enhanced sanitation and traceability within the food supply chain. Stringent regulatory frameworks, including those governing food safety and transportation, present significant challenges and opportunities for market participants. The emergence of substitute transportation methods, such as rail for long-distance haulage, presents a competitive dynamic. End-user segmentation encompasses diverse food and beverage manufacturers, from large multinational corporations to smaller regional producers, each with unique transportation requirements. The market has witnessed a significant increase in mergers and acquisitions (M&A) activity in recent years, with xx M&A deals recorded between 2019 and 2024, indicating a trend toward consolidation and expansion within the sector. These deals frequently involve companies seeking to expand their geographical reach, enhance service offerings, or gain access to specialized equipment or technologies.
- High Barriers to Entry: Significant capital investment in specialized equipment (food-grade tankers) and stringent regulatory compliance requirements pose considerable challenges for new entrants.
- Consolidation Trend: M&A activities suggest a move towards larger, more integrated players with broader service capabilities.
- Regulatory Scrutiny: Compliance with stringent food safety regulations necessitates significant investments in operational procedures and training.
- Technological Advancements: Adoption of telematics, route optimization software, and advanced safety features is reshaping market dynamics.
Food Grade Tank Trucking Market Market Trends & Opportunities
The Food Grade Tank Trucking Market is experiencing robust growth, driven by the expanding food and beverage industry and increasing consumer demand for processed and packaged foods. The market size is projected to exhibit a Compound Annual Growth Rate (CAGR) of xx% during the forecast period (2025-2033). This growth is fueled by several key trends, including evolving consumer preferences towards convenience foods, the growth of e-commerce, and the increasing globalization of food supply chains. The industry is also witnessing significant technological advancements, such as the adoption of telematics and route optimization software, which enhance efficiency and reduce operational costs. Furthermore, a growing emphasis on sustainability and reducing carbon emissions is influencing transportation practices, fostering innovation in fuel-efficient vehicles and sustainable logistics solutions. Competitive dynamics are marked by increasing consolidation, with larger players acquiring smaller businesses to expand their market share and service offerings. Market penetration rates for sophisticated technology like GPS tracking and temperature monitoring systems are increasing steadily, indicating a progressive industry commitment to efficiency and safety.
Dominant Markets & Segments in Food Grade Tank Trucking Market
North America currently dominates the Food Grade Tank Trucking Market, driven by factors such as well-developed infrastructure, a robust food and beverage manufacturing sector, and established regulatory frameworks. Within this region, the United States holds the largest market share.
- Key Growth Drivers in North America:
- Extensive highway networks facilitating efficient transportation.
- High concentration of food processing facilities.
- Strong regulatory framework ensuring food safety and quality.
- Technological advancements in trucking and logistics.
The European market holds a significant second position, characterized by stringent regulations and a focus on sustainable transportation practices. Asia-Pacific shows strong growth potential, with increasing food consumption and the rise of food processing industries.
Food Grade Tank Trucking Market Product Analysis
The market offers a range of specialized tankers designed to meet the specific needs of various food products. These include insulated tankers for temperature-sensitive goods, stainless steel tankers for hygienic transportation, and tankers equipped with advanced cleaning systems. Technological advancements such as improved insulation, advanced cleaning systems, and real-time temperature monitoring significantly enhance product safety and quality while minimizing spoilage. The key competitive advantages lie in offering specialized services, advanced technology, and a strong commitment to food safety and regulatory compliance.
Key Drivers, Barriers & Challenges in Food Grade Tank Trucking Market
Key Drivers:
Increased demand for processed foods, rising food consumption, and the expanding global food trade are key drivers. Technological advancements in transportation and logistics, such as GPS tracking and route optimization, enhance efficiency and reduce costs. Furthermore, government regulations promoting food safety and traceability provide opportunities for companies adhering to stringent standards.
Key Challenges & Restraints:
Fluctuating fuel prices impact operational costs significantly. Driver shortages pose a serious challenge to operational capacity. Stringent regulatory compliance and associated costs present a barrier for smaller companies. Competition from other modes of transportation such as rail necessitates continuous innovation and adaptation. The market faces supply chain disruptions, especially related to raw material availability and global events. These disruptions can lead to significant cost increases and delays. The impact is estimated at xx Million in lost revenue annually.
Growth Drivers in the Food Grade Tank Trucking Market Market
The expanding food processing and beverage industries create significant demand for efficient and reliable food-grade transportation. Technological advancements like automated routing and temperature monitoring enhance safety and reduce waste, driving market expansion. Government initiatives promoting food safety and supply chain traceability create regulatory compliance opportunities.
Challenges Impacting Food Grade Tank Trucking Market Growth
Stringent food safety regulations require substantial investments in specialized equipment and training, representing a barrier to entry. Driver shortages constrain operational capacity, increasing transportation costs. Intense competition from established players and alternative transportation modes puts pressure on profit margins.
Key Players Shaping the Food Grade Tank Trucking Market Market
- Hegelmann Group
- C.H. Robinson
- DHL
- Odyssey Logistics
- SHAL (Sea Hawk Lines)
- Kenan Advantage Group Inc
- Bulk Connection
- Trimac Transportation Services
- Heniff Transportation Systems LLC
- Quality Carriers
- 73 Other Companies
Significant Food Grade Tank Trucking Market Industry Milestones
- June 2024: TFI International acquires Entreposage Marco, expanding its food-grade transportation capabilities in Canada.
- April 2023: Trimac Transportation acquires AIP Logistics, strengthening its bulk transportation and warehousing services, including food-grade storage.
Future Outlook for Food Grade Tank Trucking Market Market
The Food Grade Tank Trucking Market is poised for continued growth, driven by several factors including expanding food production and consumption, technological advancements in transportation efficiency, and the increasing need for secure and reliable food supply chains. Strategic partnerships and technological innovation, including the adoption of alternative fuels and autonomous driving technologies, represent significant opportunities for market growth and expansion in the coming years. The market's future trajectory suggests significant potential for growth and investment.
Food Grade Tank Trucking Market Segmentation
-
1. Food Item
- 1.1. Oil
- 1.2. Dairy
- 1.3. Juice and Beverage
- 1.4. Other Food Items
Food Grade Tank Trucking Market Segmentation By Geography
-
1. North America
- 1.1. United States
- 1.2. Canada
- 1.3. Mexico
-
2. Europe
- 2.1. France
- 2.2. Italy
- 2.3. Spain
- 2.4. Netherlands
- 2.5. Rest of Europe
-
3. Asia Pacific
- 3.1. China
- 3.2. Japan
- 3.3. India
- 3.4. Russia
- 3.5. Rest of Asia Pacific
-
4. Middle East and Africa
- 4.1. GCC
- 4.2. South Africa
- 4.3. Rest of Middle East and Africa
-
5. South America
- 5.1. Brazil
- 5.2. Argentina
- 5.3. Rest of South America
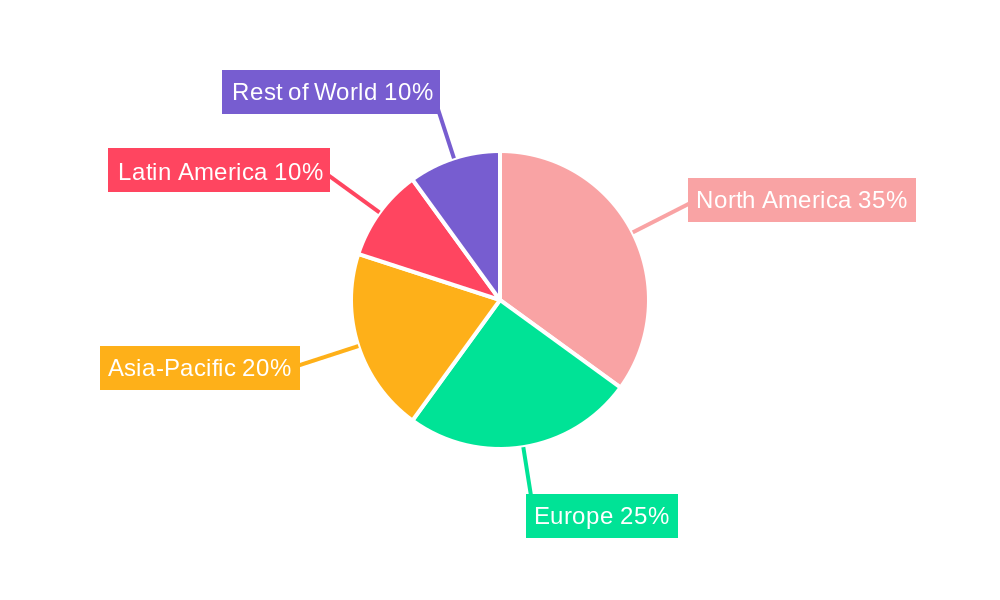
Food Grade Tank Trucking Market Regional Market Share
Geographic Coverage of Food Grade Tank Trucking Market
Food Grade Tank Trucking Market REPORT HIGHLIGHTS
| Aspects | Details |
|---|---|
| Study Period | 2020-2034 |
| Base Year | 2025 |
| Estimated Year | 2026 |
| Forecast Period | 2026-2034 |
| Historical Period | 2020-2025 |
| Growth Rate | CAGR of 5.88% from 2020-2034 |
| Segmentation |
|
Table of Contents
- 1. Introduction
- 1.1. Research Scope
- 1.2. Market Segmentation
- 1.3. Research Objective
- 1.4. Definitions and Assumptions
- 2. Executive Summary
- 2.1. Market Snapshot
- 3. Market Dynamics
- 3.1. Market Drivers
- 3.2. Market Restrains
- 3.3. Market Trends
- 3.4. Market Opportunities
- 4. Market Factor Analysis
- 4.1. Porters Five Forces
- 4.1.1. Bargaining Power of Suppliers
- 4.1.2. Bargaining Power of Buyers
- 4.1.3. Threat of New Entrants
- 4.1.4. Threat of Substitutes
- 4.1.5. Competitive Rivalry
- 4.2. PESTEL analysis
- 4.3. BCG Analysis
- 4.3.1. Stars (High Growth, High Market Share)
- 4.3.2. Cash Cows (Low Growth, High Market Share)
- 4.3.3. Question Mark (High Growth, Low Market Share)
- 4.3.4. Dogs (Low Growth, Low Market Share)
- 4.4. Ansoff Matrix Analysis
- 4.5. Supply Chain Analysis
- 4.6. Regulatory Landscape
- 4.7. Current Market Potential and Opportunity Assessment (TAM–SAM–SOM Framework)
- 4.8. TIR Analyst Note
- 4.1. Porters Five Forces
- 5. Market Analysis, Insights and Forecast 2021-2033
- 5.1. Market Analysis, Insights and Forecast - by Food Item
- 5.1.1. Oil
- 5.1.2. Dairy
- 5.1.3. Juice and Beverage
- 5.1.4. Other Food Items
- 5.2. Market Analysis, Insights and Forecast - by Region
- 5.2.1. North America
- 5.2.2. Europe
- 5.2.3. Asia Pacific
- 5.2.4. Middle East and Africa
- 5.2.5. South America
- 5.1. Market Analysis, Insights and Forecast - by Food Item
- 6. Global Food Grade Tank Trucking Market Analysis, Insights and Forecast, 2021-2033
- 6.1. Market Analysis, Insights and Forecast - by Food Item
- 6.1.1. Oil
- 6.1.2. Dairy
- 6.1.3. Juice and Beverage
- 6.1.4. Other Food Items
- 6.1. Market Analysis, Insights and Forecast - by Food Item
- 7. North America Food Grade Tank Trucking Market Analysis, Insights and Forecast, 2020-2032
- 7.1. Market Analysis, Insights and Forecast - by Food Item
- 7.1.1. Oil
- 7.1.2. Dairy
- 7.1.3. Juice and Beverage
- 7.1.4. Other Food Items
- 7.1. Market Analysis, Insights and Forecast - by Food Item
- 8. Europe Food Grade Tank Trucking Market Analysis, Insights and Forecast, 2020-2032
- 8.1. Market Analysis, Insights and Forecast - by Food Item
- 8.1.1. Oil
- 8.1.2. Dairy
- 8.1.3. Juice and Beverage
- 8.1.4. Other Food Items
- 8.1. Market Analysis, Insights and Forecast - by Food Item
- 9. Asia Pacific Food Grade Tank Trucking Market Analysis, Insights and Forecast, 2020-2032
- 9.1. Market Analysis, Insights and Forecast - by Food Item
- 9.1.1. Oil
- 9.1.2. Dairy
- 9.1.3. Juice and Beverage
- 9.1.4. Other Food Items
- 9.1. Market Analysis, Insights and Forecast - by Food Item
- 10. Middle East and Africa Food Grade Tank Trucking Market Analysis, Insights and Forecast, 2020-2032
- 10.1. Market Analysis, Insights and Forecast - by Food Item
- 10.1.1. Oil
- 10.1.2. Dairy
- 10.1.3. Juice and Beverage
- 10.1.4. Other Food Items
- 10.1. Market Analysis, Insights and Forecast - by Food Item
- 11. South America Food Grade Tank Trucking Market Analysis, Insights and Forecast, 2020-2032
- 11.1. Market Analysis, Insights and Forecast - by Food Item
- 11.1.1. Oil
- 11.1.2. Dairy
- 11.1.3. Juice and Beverage
- 11.1.4. Other Food Items
- 11.1. Market Analysis, Insights and Forecast - by Food Item
- 12. Competitive Analysis
- 12.1. Company Profiles
- 12.1.1 Hegelmann Group
- 12.1.1.1. Company Overview
- 12.1.1.2. Products
- 12.1.1.3. Company Financials
- 12.1.1.4. SWOT Analysis
- 12.1.2 C H Robinson
- 12.1.2.1. Company Overview
- 12.1.2.2. Products
- 12.1.2.3. Company Financials
- 12.1.2.4. SWOT Analysis
- 12.1.3 DHL
- 12.1.3.1. Company Overview
- 12.1.3.2. Products
- 12.1.3.3. Company Financials
- 12.1.3.4. SWOT Analysis
- 12.1.4 Odyssey Logistics
- 12.1.4.1. Company Overview
- 12.1.4.2. Products
- 12.1.4.3. Company Financials
- 12.1.4.4. SWOT Analysis
- 12.1.5 SHAL (Sea Hawk Lines)
- 12.1.5.1. Company Overview
- 12.1.5.2. Products
- 12.1.5.3. Company Financials
- 12.1.5.4. SWOT Analysis
- 12.1.6 Kenan Advantage Group Inc
- 12.1.6.1. Company Overview
- 12.1.6.2. Products
- 12.1.6.3. Company Financials
- 12.1.6.4. SWOT Analysis
- 12.1.7 Bulk Connection
- 12.1.7.1. Company Overview
- 12.1.7.2. Products
- 12.1.7.3. Company Financials
- 12.1.7.4. SWOT Analysis
- 12.1.8 Trimac Transportation Services
- 12.1.8.1. Company Overview
- 12.1.8.2. Products
- 12.1.8.3. Company Financials
- 12.1.8.4. SWOT Analysis
- 12.1.9 Heniff Transportation Systems LLC
- 12.1.9.1. Company Overview
- 12.1.9.2. Products
- 12.1.9.3. Company Financials
- 12.1.9.4. SWOT Analysis
- 12.1.10 Quality Carriers**List Not Exhaustive 7 3 Other Companie
- 12.1.10.1. Company Overview
- 12.1.10.2. Products
- 12.1.10.3. Company Financials
- 12.1.10.4. SWOT Analysis
- 12.1.1 Hegelmann Group
- 12.2. Market Entropy
- 12.2.1 Company's Key Areas Served
- 12.2.2 Recent Developments
- 12.3. Company Market Share Analysis 2025
- 12.3.1 Top 5 Companies Market Share Analysis
- 12.3.2 Top 3 Companies Market Share Analysis
- 12.4. List of Potential Customers
- 13. Research Methodology
List of Figures
- Figure 1: Global Food Grade Tank Trucking Market Revenue Breakdown (Million, %) by Region 2025 & 2033
- Figure 2: Global Food Grade Tank Trucking Market Volume Breakdown (Billion, %) by Region 2025 & 2033
- Figure 3: North America Food Grade Tank Trucking Market Revenue (Million), by Food Item 2025 & 2033
- Figure 4: North America Food Grade Tank Trucking Market Volume (Billion), by Food Item 2025 & 2033
- Figure 5: North America Food Grade Tank Trucking Market Revenue Share (%), by Food Item 2025 & 2033
- Figure 6: North America Food Grade Tank Trucking Market Volume Share (%), by Food Item 2025 & 2033
- Figure 7: North America Food Grade Tank Trucking Market Revenue (Million), by Country 2025 & 2033
- Figure 8: North America Food Grade Tank Trucking Market Volume (Billion), by Country 2025 & 2033
- Figure 9: North America Food Grade Tank Trucking Market Revenue Share (%), by Country 2025 & 2033
- Figure 10: North America Food Grade Tank Trucking Market Volume Share (%), by Country 2025 & 2033
- Figure 11: Europe Food Grade Tank Trucking Market Revenue (Million), by Food Item 2025 & 2033
- Figure 12: Europe Food Grade Tank Trucking Market Volume (Billion), by Food Item 2025 & 2033
- Figure 13: Europe Food Grade Tank Trucking Market Revenue Share (%), by Food Item 2025 & 2033
- Figure 14: Europe Food Grade Tank Trucking Market Volume Share (%), by Food Item 2025 & 2033
- Figure 15: Europe Food Grade Tank Trucking Market Revenue (Million), by Country 2025 & 2033
- Figure 16: Europe Food Grade Tank Trucking Market Volume (Billion), by Country 2025 & 2033
- Figure 17: Europe Food Grade Tank Trucking Market Revenue Share (%), by Country 2025 & 2033
- Figure 18: Europe Food Grade Tank Trucking Market Volume Share (%), by Country 2025 & 2033
- Figure 19: Asia Pacific Food Grade Tank Trucking Market Revenue (Million), by Food Item 2025 & 2033
- Figure 20: Asia Pacific Food Grade Tank Trucking Market Volume (Billion), by Food Item 2025 & 2033
- Figure 21: Asia Pacific Food Grade Tank Trucking Market Revenue Share (%), by Food Item 2025 & 2033
- Figure 22: Asia Pacific Food Grade Tank Trucking Market Volume Share (%), by Food Item 2025 & 2033
- Figure 23: Asia Pacific Food Grade Tank Trucking Market Revenue (Million), by Country 2025 & 2033
- Figure 24: Asia Pacific Food Grade Tank Trucking Market Volume (Billion), by Country 2025 & 2033
- Figure 25: Asia Pacific Food Grade Tank Trucking Market Revenue Share (%), by Country 2025 & 2033
- Figure 26: Asia Pacific Food Grade Tank Trucking Market Volume Share (%), by Country 2025 & 2033
- Figure 27: Middle East and Africa Food Grade Tank Trucking Market Revenue (Million), by Food Item 2025 & 2033
- Figure 28: Middle East and Africa Food Grade Tank Trucking Market Volume (Billion), by Food Item 2025 & 2033
- Figure 29: Middle East and Africa Food Grade Tank Trucking Market Revenue Share (%), by Food Item 2025 & 2033
- Figure 30: Middle East and Africa Food Grade Tank Trucking Market Volume Share (%), by Food Item 2025 & 2033
- Figure 31: Middle East and Africa Food Grade Tank Trucking Market Revenue (Million), by Country 2025 & 2033
- Figure 32: Middle East and Africa Food Grade Tank Trucking Market Volume (Billion), by Country 2025 & 2033
- Figure 33: Middle East and Africa Food Grade Tank Trucking Market Revenue Share (%), by Country 2025 & 2033
- Figure 34: Middle East and Africa Food Grade Tank Trucking Market Volume Share (%), by Country 2025 & 2033
- Figure 35: South America Food Grade Tank Trucking Market Revenue (Million), by Food Item 2025 & 2033
- Figure 36: South America Food Grade Tank Trucking Market Volume (Billion), by Food Item 2025 & 2033
- Figure 37: South America Food Grade Tank Trucking Market Revenue Share (%), by Food Item 2025 & 2033
- Figure 38: South America Food Grade Tank Trucking Market Volume Share (%), by Food Item 2025 & 2033
- Figure 39: South America Food Grade Tank Trucking Market Revenue (Million), by Country 2025 & 2033
- Figure 40: South America Food Grade Tank Trucking Market Volume (Billion), by Country 2025 & 2033
- Figure 41: South America Food Grade Tank Trucking Market Revenue Share (%), by Country 2025 & 2033
- Figure 42: South America Food Grade Tank Trucking Market Volume Share (%), by Country 2025 & 2033
List of Tables
- Table 1: Global Food Grade Tank Trucking Market Revenue Million Forecast, by Food Item 2020 & 2033
- Table 2: Global Food Grade Tank Trucking Market Volume Billion Forecast, by Food Item 2020 & 2033
- Table 3: Global Food Grade Tank Trucking Market Revenue Million Forecast, by Region 2020 & 2033
- Table 4: Global Food Grade Tank Trucking Market Volume Billion Forecast, by Region 2020 & 2033
- Table 5: Global Food Grade Tank Trucking Market Revenue Million Forecast, by Food Item 2020 & 2033
- Table 6: Global Food Grade Tank Trucking Market Volume Billion Forecast, by Food Item 2020 & 2033
- Table 7: Global Food Grade Tank Trucking Market Revenue Million Forecast, by Country 2020 & 2033
- Table 8: Global Food Grade Tank Trucking Market Volume Billion Forecast, by Country 2020 & 2033
- Table 9: United States Food Grade Tank Trucking Market Revenue (Million) Forecast, by Application 2020 & 2033
- Table 10: United States Food Grade Tank Trucking Market Volume (Billion) Forecast, by Application 2020 & 2033
- Table 11: Canada Food Grade Tank Trucking Market Revenue (Million) Forecast, by Application 2020 & 2033
- Table 12: Canada Food Grade Tank Trucking Market Volume (Billion) Forecast, by Application 2020 & 2033
- Table 13: Mexico Food Grade Tank Trucking Market Revenue (Million) Forecast, by Application 2020 & 2033
- Table 14: Mexico Food Grade Tank Trucking Market Volume (Billion) Forecast, by Application 2020 & 2033
- Table 15: Global Food Grade Tank Trucking Market Revenue Million Forecast, by Food Item 2020 & 2033
- Table 16: Global Food Grade Tank Trucking Market Volume Billion Forecast, by Food Item 2020 & 2033
- Table 17: Global Food Grade Tank Trucking Market Revenue Million Forecast, by Country 2020 & 2033
- Table 18: Global Food Grade Tank Trucking Market Volume Billion Forecast, by Country 2020 & 2033
- Table 19: France Food Grade Tank Trucking Market Revenue (Million) Forecast, by Application 2020 & 2033
- Table 20: France Food Grade Tank Trucking Market Volume (Billion) Forecast, by Application 2020 & 2033
- Table 21: Italy Food Grade Tank Trucking Market Revenue (Million) Forecast, by Application 2020 & 2033
- Table 22: Italy Food Grade Tank Trucking Market Volume (Billion) Forecast, by Application 2020 & 2033
- Table 23: Spain Food Grade Tank Trucking Market Revenue (Million) Forecast, by Application 2020 & 2033
- Table 24: Spain Food Grade Tank Trucking Market Volume (Billion) Forecast, by Application 2020 & 2033
- Table 25: Netherlands Food Grade Tank Trucking Market Revenue (Million) Forecast, by Application 2020 & 2033
- Table 26: Netherlands Food Grade Tank Trucking Market Volume (Billion) Forecast, by Application 2020 & 2033
- Table 27: Rest of Europe Food Grade Tank Trucking Market Revenue (Million) Forecast, by Application 2020 & 2033
- Table 28: Rest of Europe Food Grade Tank Trucking Market Volume (Billion) Forecast, by Application 2020 & 2033
- Table 29: Global Food Grade Tank Trucking Market Revenue Million Forecast, by Food Item 2020 & 2033
- Table 30: Global Food Grade Tank Trucking Market Volume Billion Forecast, by Food Item 2020 & 2033
- Table 31: Global Food Grade Tank Trucking Market Revenue Million Forecast, by Country 2020 & 2033
- Table 32: Global Food Grade Tank Trucking Market Volume Billion Forecast, by Country 2020 & 2033
- Table 33: China Food Grade Tank Trucking Market Revenue (Million) Forecast, by Application 2020 & 2033
- Table 34: China Food Grade Tank Trucking Market Volume (Billion) Forecast, by Application 2020 & 2033
- Table 35: Japan Food Grade Tank Trucking Market Revenue (Million) Forecast, by Application 2020 & 2033
- Table 36: Japan Food Grade Tank Trucking Market Volume (Billion) Forecast, by Application 2020 & 2033
- Table 37: India Food Grade Tank Trucking Market Revenue (Million) Forecast, by Application 2020 & 2033
- Table 38: India Food Grade Tank Trucking Market Volume (Billion) Forecast, by Application 2020 & 2033
- Table 39: Russia Food Grade Tank Trucking Market Revenue (Million) Forecast, by Application 2020 & 2033
- Table 40: Russia Food Grade Tank Trucking Market Volume (Billion) Forecast, by Application 2020 & 2033
- Table 41: Rest of Asia Pacific Food Grade Tank Trucking Market Revenue (Million) Forecast, by Application 2020 & 2033
- Table 42: Rest of Asia Pacific Food Grade Tank Trucking Market Volume (Billion) Forecast, by Application 2020 & 2033
- Table 43: Global Food Grade Tank Trucking Market Revenue Million Forecast, by Food Item 2020 & 2033
- Table 44: Global Food Grade Tank Trucking Market Volume Billion Forecast, by Food Item 2020 & 2033
- Table 45: Global Food Grade Tank Trucking Market Revenue Million Forecast, by Country 2020 & 2033
- Table 46: Global Food Grade Tank Trucking Market Volume Billion Forecast, by Country 2020 & 2033
- Table 47: GCC Food Grade Tank Trucking Market Revenue (Million) Forecast, by Application 2020 & 2033
- Table 48: GCC Food Grade Tank Trucking Market Volume (Billion) Forecast, by Application 2020 & 2033
- Table 49: South Africa Food Grade Tank Trucking Market Revenue (Million) Forecast, by Application 2020 & 2033
- Table 50: South Africa Food Grade Tank Trucking Market Volume (Billion) Forecast, by Application 2020 & 2033
- Table 51: Rest of Middle East and Africa Food Grade Tank Trucking Market Revenue (Million) Forecast, by Application 2020 & 2033
- Table 52: Rest of Middle East and Africa Food Grade Tank Trucking Market Volume (Billion) Forecast, by Application 2020 & 2033
- Table 53: Global Food Grade Tank Trucking Market Revenue Million Forecast, by Food Item 2020 & 2033
- Table 54: Global Food Grade Tank Trucking Market Volume Billion Forecast, by Food Item 2020 & 2033
- Table 55: Global Food Grade Tank Trucking Market Revenue Million Forecast, by Country 2020 & 2033
- Table 56: Global Food Grade Tank Trucking Market Volume Billion Forecast, by Country 2020 & 2033
- Table 57: Brazil Food Grade Tank Trucking Market Revenue (Million) Forecast, by Application 2020 & 2033
- Table 58: Brazil Food Grade Tank Trucking Market Volume (Billion) Forecast, by Application 2020 & 2033
- Table 59: Argentina Food Grade Tank Trucking Market Revenue (Million) Forecast, by Application 2020 & 2033
- Table 60: Argentina Food Grade Tank Trucking Market Volume (Billion) Forecast, by Application 2020 & 2033
- Table 61: Rest of South America Food Grade Tank Trucking Market Revenue (Million) Forecast, by Application 2020 & 2033
- Table 62: Rest of South America Food Grade Tank Trucking Market Volume (Billion) Forecast, by Application 2020 & 2033
Frequently Asked Questions
1. What is the projected Compound Annual Growth Rate (CAGR) of the Food Grade Tank Trucking Market?
The projected CAGR is approximately 5.88%.
2. Which companies are prominent players in the Food Grade Tank Trucking Market?
Key companies in the market include Hegelmann Group, C H Robinson, DHL, Odyssey Logistics, SHAL (Sea Hawk Lines), Kenan Advantage Group Inc, Bulk Connection, Trimac Transportation Services, Heniff Transportation Systems LLC, Quality Carriers**List Not Exhaustive 7 3 Other Companie.
3. What are the main segments of the Food Grade Tank Trucking Market?
The market segments include Food Item.
4. Can you provide details about the market size?
The market size is estimated to be USD 5.41 Million as of 2022.
5. What are some drivers contributing to market growth?
Increasing Demand for Food Safety and Quality; Expansion of the Food and Beverage Industry.
6. What are the notable trends driving market growth?
Global Cow Milk Consumption and Production Propel Food Grade Tank Trucking Demand.
7. Are there any restraints impacting market growth?
Increasing Demand for Food Safety and Quality; Expansion of the Food and Beverage Industry.
8. Can you provide examples of recent developments in the market?
June 2024: TFI International has acquired Entreposage Marco, a Quebec, Canada-based food-grade tank hauler. Specializing in the transportation of edible products such as oils, liquid yeast, sweeteners, and fruit juices, Entreposage Marco operates a fleet of 15 power units, as reported by the Federal Motor Carrier Safety Administration. This acquisition is significant and aims to increase the market reach of TFI International.April 2023: Trimac Transportation acquired American Industrial Partners (AIP) Logistics, a Central Ohio-based company specializing in bulk terminal services, transportation, and warehousing for industries such as plastics, liquid chemicals, food-grade storage, and metal production. AIP's fleet includes 13 tractors, 119 trailers, and various yard vehicles. Located on a 52-acre property in Wapakoneta, Ohio, the facility offers cold, dry, and food-grade warehousing, bulk transloading, and storage, with direct access to CSX Transportation’s rail line and capacity for up to 70 railcars. This acquisition strengthens Trimac's five-year strategy to enhance its position in bulk transportation, wash, and maintenance services.
9. What pricing options are available for accessing the report?
Pricing options include single-user, multi-user, and enterprise licenses priced at USD 4750, USD 5250, and USD 8750 respectively.
10. Is the market size provided in terms of value or volume?
The market size is provided in terms of value, measured in Million and volume, measured in Billion.
11. Are there any specific market keywords associated with the report?
Yes, the market keyword associated with the report is "Food Grade Tank Trucking Market," which aids in identifying and referencing the specific market segment covered.
12. How do I determine which pricing option suits my needs best?
The pricing options vary based on user requirements and access needs. Individual users may opt for single-user licenses, while businesses requiring broader access may choose multi-user or enterprise licenses for cost-effective access to the report.
13. Are there any additional resources or data provided in the Food Grade Tank Trucking Market report?
While the report offers comprehensive insights, it's advisable to review the specific contents or supplementary materials provided to ascertain if additional resources or data are available.
14. How can I stay updated on further developments or reports in the Food Grade Tank Trucking Market?
To stay informed about further developments, trends, and reports in the Food Grade Tank Trucking Market, consider subscribing to industry newsletters, following relevant companies and organizations, or regularly checking reputable industry news sources and publications.
Methodology
Step 1 - Identification of Relevant Samples Size from Population Database


Step 2 - Approaches for Defining Global Market Size (Value, Volume* & Price*)

Note*: In applicable scenarios
Step 3 - Data Sources
Primary Research
- Web Analytics
- Survey Reports
- Research Institute
- Latest Research Reports
- Opinion Leaders
Secondary Research
- Annual Reports
- White Paper
- Latest Press Release
- Industry Association
- Paid Database
- Investor Presentations

Step 4 - Data Triangulation
Involves using different sources of information in order to increase the validity of a study
These sources are likely to be stakeholders in a program - participants, other researchers, program staff, other community members, and so on.
Then we put all data in single framework & apply various statistical tools to find out the dynamic on the market.
During the analysis stage, feedback from the stakeholder groups would be compared to determine areas of agreement as well as areas of divergence