

Key Insights
The GCC Dangerous Goods Freight Market is experiencing robust growth, driven by the region's burgeoning petrochemical and manufacturing sectors, coupled with increasing cross-border trade and the expansion of e-commerce. The market's compound annual growth rate (CAGR) exceeding 5% signifies a significant and sustained expansion. Key drivers include stringent regulatory compliance needs for handling hazardous materials, necessitating specialized logistics solutions. Furthermore, the rising demand for efficient and secure transportation networks within the GCC, fueled by infrastructure development projects and industrial diversification strategies, is bolstering market growth. The market is segmented by service type (transportation, warehousing and inventory management, value-added services) and by country (Saudi Arabia, UAE, Kuwait, Qatar, Bahrain, Oman). Saudi Arabia and the UAE currently hold the largest market shares, benefiting from their developed logistics infrastructure and significant industrial output. However, other GCC countries are witnessing rapid development, creating opportunities for market expansion across the region. Challenges include maintaining consistent regulatory compliance across different GCC nations and mitigating risks associated with transporting hazardous materials. Nevertheless, the long-term outlook for the GCC Dangerous Goods Freight Market remains positive, with continuous growth anticipated throughout the forecast period (2025-2033). The increasing adoption of technology such as advanced tracking systems and specialized handling equipment will further enhance efficiency and safety within the sector.
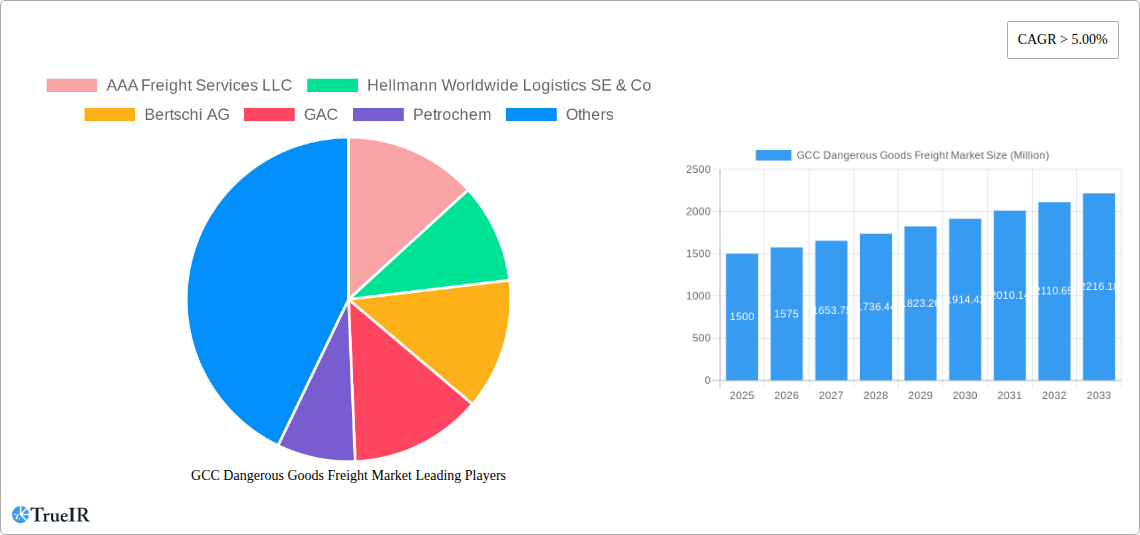
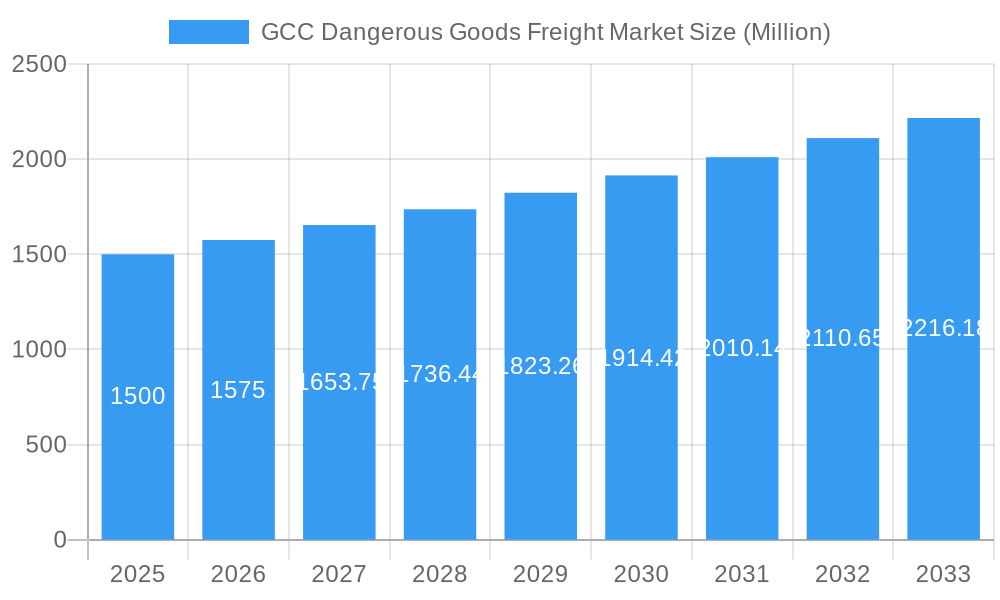
GCC Dangerous Goods Freight Market Market Size (In Billion)
The competitive landscape is marked by a mix of established international logistics players and regional companies. Major players leverage their expertise in handling hazardous materials and their extensive network reach. However, smaller, specialized firms are emerging, focusing on niche services and local market needs. The market's future depends on continued investment in infrastructure, technological advancements, and regulatory harmonization within the GCC. This will facilitate smoother cross-border transport, improving overall efficiency and reducing associated risks. The market's resilience is underscored by its close link to essential industries, ensuring consistent demand despite global economic fluctuations. This translates into lucrative investment opportunities for both established and emerging players.
GCC Dangerous Goods Freight Market Company Market Share
GCC Dangerous Goods Freight Market: A Comprehensive Report (2019-2033)
This dynamic report provides an in-depth analysis of the GCC Dangerous Goods Freight Market, offering invaluable insights for stakeholders seeking to navigate this complex and rapidly evolving sector. With a comprehensive study period spanning 2019-2033, a base year of 2025, and a forecast period extending to 2033, this report delivers a complete understanding of past trends, current market dynamics, and future growth projections. The market is valued at xx Million in 2025 and is projected to reach xx Million by 2033, exhibiting a CAGR of xx%. This report is essential for businesses, investors, and policymakers seeking a data-driven perspective on this lucrative and strategically crucial market.
GCC Dangerous Goods Freight Market Structure & Competitive Landscape
The GCC Dangerous Goods Freight Market is characterized by a moderately concentrated structure, with several major players dominating the landscape. Key players include AAA Freight Services LLC, Hellmann Worldwide Logistics SE & Co, Bertschi AG, GAC, Petrochem, Agility, Al Ghazal Transport UAE, BDP INTERNATIONAL, Al Futtaim - Logistics, and TALKE Group. However, the market also accommodates a significant number of smaller, specialized firms. The market concentration ratio (CR4) is estimated at xx%, indicating a balance between established players and emerging competitors.
Innovation Drivers: Technological advancements, particularly in tracking and monitoring systems, automation, and data analytics, are driving innovation. The increasing demand for enhanced safety and security is also a significant catalyst.
Regulatory Impacts: Stringent regulations governing the transportation and handling of dangerous goods significantly shape the market. Compliance requirements drive investments in specialized infrastructure and training, leading to higher operational costs.
Product Substitutes: Limited direct substitutes exist for dedicated dangerous goods freight services. However, innovative packaging solutions and alternative transportation modes (e.g., rail) could potentially influence market share.
End-User Segmentation: The market caters to diverse end-user segments, including the chemical, petrochemical, pharmaceutical, and manufacturing industries. The relative contribution of each segment varies based on factors like industrial activity and regulatory frameworks within specific GCC countries.
M&A Trends: Recent years have witnessed a moderate level of merger and acquisition (M&A) activity, indicating a consolidation trend within the industry. The xx M&A deals recorded between 2019 and 2024 demonstrate a growing interest in strategic partnerships and expansion.
GCC Dangerous Goods Freight Market Market Trends & Opportunities
The GCC Dangerous Goods Freight Market is experiencing robust growth fueled by several key factors. The region's expanding industrial base, particularly in the petrochemical and manufacturing sectors, drives the demand for efficient and secure dangerous goods transportation and logistics. The market size, currently valued at xx Million in 2025, is projected to reach xx Million by 2033, driven by a compound annual growth rate (CAGR) of xx%.
Technological advancements, particularly the adoption of digital technologies such as blockchain for enhanced transparency and IoT sensors for real-time tracking, are transforming the industry. Increased government initiatives to improve infrastructure and strengthen regulatory frameworks support market expansion. However, challenges such as fluctuating oil prices and geopolitical instability can affect market growth. The market penetration rate for advanced logistics technologies is currently at xx%, projected to rise to xx% by 2033. Competitive dynamics are characterized by a mix of established players and new entrants, leading to intense competition on price, service quality, and technological innovation.
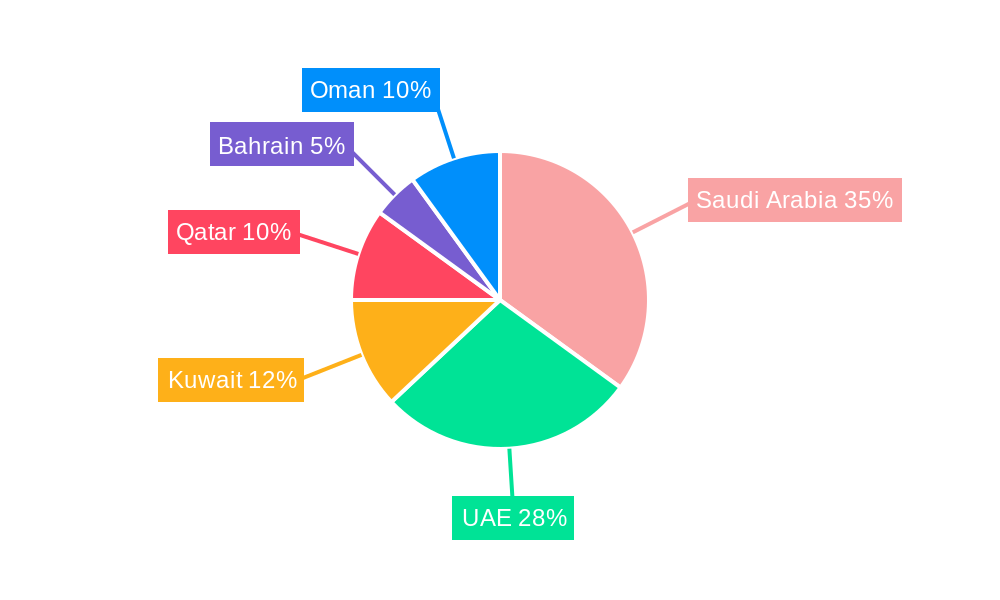
Dominant Markets & Segments in GCC Dangerous Goods Freight Market
The United Arab Emirates (UAE) currently holds the largest market share within the GCC, followed by Saudi Arabia. This dominance stems from the UAE's well-established logistics infrastructure, strategic geographical location, and robust regulatory framework.
Key Growth Drivers for the UAE:
- Developed port infrastructure and efficient air connectivity.
- Pro-business policies and government support for logistics development.
- High concentration of major industries requiring dangerous goods transport.
Saudi Arabia’s Growth:
- Significant investments in infrastructure development, including roads and railways.
- Government initiatives aimed at diversifying the economy and attracting foreign investment.
- Expansion of petrochemical and industrial sectors.
Other GCC Countries: Kuwait, Qatar, Bahrain, and Oman are also experiencing growth, albeit at a slower pace compared to the UAE and Saudi Arabia. Growth in these markets is primarily driven by industrial development and expansion of related sectors. The transportation segment currently holds the largest market share within the "By Service" classification, followed by warehousing and inventory management. The value-added services segment is expected to experience faster growth due to increasing demand for specialized services.
GCC Dangerous Goods Freight Market Product Analysis
The market offers a range of specialized services, including transportation by road, rail, sea, and air. Product innovation focuses on enhancing safety, security, and efficiency. Advanced tracking systems, improved packaging solutions, and specialized handling techniques are prominent features of the latest offerings. These innovations cater to the specific requirements of transporting dangerous goods while ensuring compliance with stringent regulatory standards. The competitive advantage lies in providing efficient, reliable, and compliant solutions that minimize risks and enhance supply chain transparency.
Key Drivers, Barriers & Challenges in GCC Dangerous Goods Freight Market
Key Drivers: The increasing demand for efficient transportation of dangerous goods driven by the expansion of the chemical, petrochemical, and manufacturing sectors, coupled with investments in infrastructure modernization, and the implementation of advanced technologies like IoT and AI for better tracking and management, are key drivers. Favorable government regulations and policies supporting the logistics industry are also significant catalysts.
Challenges: Stringent regulations and compliance requirements pose significant challenges, leading to higher operational costs. Supply chain disruptions, due to geopolitical instability or unforeseen events, can negatively impact market performance. Intense competition and fluctuating oil prices also affect profitability. For example, the recent increase in fuel prices has resulted in a xx% increase in transportation costs for some companies.
Growth Drivers in the GCC Dangerous Goods Freight Market Market
The expansion of the manufacturing and industrial sectors is a key driver, alongside significant investments in infrastructure development, including the enhancement of ports, airports, and road networks. Government policies promoting economic diversification and supporting the logistics sector further fuel market expansion. The increasing adoption of technological solutions for improved efficiency and safety is an additional catalyst.
Challenges Impacting GCC Dangerous Goods Freight Market Growth
The GCC Dangerous Goods Freight Market is navigating a landscape shaped by several impactful challenges. Regulatory complexities and escalating compliance costs remain a significant hurdle, demanding constant adaptation and investment from market participants. Compounding this, supply chain vulnerabilities and the potential for disruptions due to geopolitical instability pose a persistent threat to seamless operations. The market also experiences intense price competition among existing players, which can put pressure on profitability and necessitate innovative cost-management strategies. Furthermore, a critical challenge is the shortage of skilled labor specialized in handling dangerous goods, directly impacting operational efficiency and safety standards. For instance, the recent border closure between two GCC countries led to a significant xx% increase in delivery times, highlighting the fragility of regional logistics networks.
Key Players Shaping the GCC Dangerous Goods Freight Market Market
- AAA Freight Services LLC
- Hellmann Worldwide Logistics SE & Co
- Bertschi AG
- GAC
- Petrochem
- Agility
- Al Ghazal Transport UAE
- BDP INTERNATIONAL
- Al Futtaim - Logistics
- TALKE Group
Significant GCC Dangerous Goods Freight Market Industry Milestones
- June 2023: Magnate Worldwide's strategic acquisition of Cargo Logistics Group significantly expands its footprint and capabilities in providing specialized dangerous goods logistics solutions across the region.
- April 2023: dnata's forward-thinking adoption of IATA's Connect API marks a pivotal step towards accelerating the digitalization of air cargo operations, leading to enhanced efficiency and robust data management within the critical dangerous goods sector.
Future Outlook for GCC Dangerous Goods Freight Market Market
The GCC Dangerous Goods Freight Market is poised for continued growth, driven by sustained industrial expansion, investments in infrastructure, and technological advancements. The increasing focus on safety and regulatory compliance will create opportunities for specialized service providers offering innovative solutions. Strategic partnerships and further consolidation within the industry are anticipated. The market's future growth will depend on effectively addressing challenges related to regulation, supply chain resilience, and technological adaptation.
GCC Dangerous Goods Freight Market Segmentation
-
1. Service
- 1.1. Transportation
- 1.2. Warehousing and Inventory Management
- 1.3. Value-added Services
GCC Dangerous Goods Freight Market Segmentation By Geography
-
1. North America
- 1.1. United States
- 1.2. Canada
- 1.3. Mexico
-
2. South America
- 2.1. Brazil
- 2.2. Argentina
- 2.3. Rest of South America
-
3. Europe
- 3.1. United Kingdom
- 3.2. Germany
- 3.3. France
- 3.4. Italy
- 3.5. Spain
- 3.6. Russia
- 3.7. Benelux
- 3.8. Nordics
- 3.9. Rest of Europe
-
4. Middle East & Africa
- 4.1. Turkey
- 4.2. Israel
- 4.3. GCC
- 4.4. North Africa
- 4.5. South Africa
- 4.6. Rest of Middle East & Africa
-
5. Asia Pacific
- 5.1. China
- 5.2. India
- 5.3. Japan
- 5.4. South Korea
- 5.5. ASEAN
- 5.6. Oceania
- 5.7. Rest of Asia Pacific
GCC Dangerous Goods Freight Market Regional Market Share
Geographic Coverage of GCC Dangerous Goods Freight Market
GCC Dangerous Goods Freight Market REPORT HIGHLIGHTS
| Aspects | Details |
|---|---|
| Study Period | 2020-2034 |
| Base Year | 2025 |
| Estimated Year | 2026 |
| Forecast Period | 2026-2034 |
| Historical Period | 2020-2025 |
| Growth Rate | CAGR of > 5.00% from 2020-2034 |
| Segmentation |
|
Table of Contents
- 1. Introduction
- 1.1. Research Scope
- 1.2. Market Segmentation
- 1.3. Research Objective
- 1.4. Definitions and Assumptions
- 2. Executive Summary
- 2.1. Market Snapshot
- 3. Market Dynamics
- 3.1. Market Drivers
- 3.2. Market Restrains
- 3.3. Market Trends
- 3.4. Market Opportunities
- 4. Market Factor Analysis
- 4.1. Porters Five Forces
- 4.1.1. Bargaining Power of Suppliers
- 4.1.2. Bargaining Power of Buyers
- 4.1.3. Threat of New Entrants
- 4.1.4. Threat of Substitutes
- 4.1.5. Competitive Rivalry
- 4.2. PESTEL analysis
- 4.3. BCG Analysis
- 4.3.1. Stars (High Growth, High Market Share)
- 4.3.2. Cash Cows (Low Growth, High Market Share)
- 4.3.3. Question Mark (High Growth, Low Market Share)
- 4.3.4. Dogs (Low Growth, Low Market Share)
- 4.4. Ansoff Matrix Analysis
- 4.5. Supply Chain Analysis
- 4.6. Regulatory Landscape
- 4.7. Current Market Potential and Opportunity Assessment (TAM–SAM–SOM Framework)
- 4.8. TIR Analyst Note
- 4.1. Porters Five Forces
- 5. Market Analysis, Insights and Forecast 2021-2033
- 5.1. Market Analysis, Insights and Forecast - by Service
- 5.1.1. Transportation
- 5.1.2. Warehousing and Inventory Management
- 5.1.3. Value-added Services
- 5.2. Market Analysis, Insights and Forecast - by Region
- 5.2.1. North America
- 5.2.2. South America
- 5.2.3. Europe
- 5.2.4. Middle East & Africa
- 5.2.5. Asia Pacific
- 5.1. Market Analysis, Insights and Forecast - by Service
- 6. Global GCC Dangerous Goods Freight Market Analysis, Insights and Forecast, 2021-2033
- 6.1. Market Analysis, Insights and Forecast - by Service
- 6.1.1. Transportation
- 6.1.2. Warehousing and Inventory Management
- 6.1.3. Value-added Services
- 6.1. Market Analysis, Insights and Forecast - by Service
- 7. North America GCC Dangerous Goods Freight Market Analysis, Insights and Forecast, 2020-2032
- 7.1. Market Analysis, Insights and Forecast - by Service
- 7.1.1. Transportation
- 7.1.2. Warehousing and Inventory Management
- 7.1.3. Value-added Services
- 7.1. Market Analysis, Insights and Forecast - by Service
- 8. South America GCC Dangerous Goods Freight Market Analysis, Insights and Forecast, 2020-2032
- 8.1. Market Analysis, Insights and Forecast - by Service
- 8.1.1. Transportation
- 8.1.2. Warehousing and Inventory Management
- 8.1.3. Value-added Services
- 8.1. Market Analysis, Insights and Forecast - by Service
- 9. Europe GCC Dangerous Goods Freight Market Analysis, Insights and Forecast, 2020-2032
- 9.1. Market Analysis, Insights and Forecast - by Service
- 9.1.1. Transportation
- 9.1.2. Warehousing and Inventory Management
- 9.1.3. Value-added Services
- 9.1. Market Analysis, Insights and Forecast - by Service
- 10. Middle East & Africa GCC Dangerous Goods Freight Market Analysis, Insights and Forecast, 2020-2032
- 10.1. Market Analysis, Insights and Forecast - by Service
- 10.1.1. Transportation
- 10.1.2. Warehousing and Inventory Management
- 10.1.3. Value-added Services
- 10.1. Market Analysis, Insights and Forecast - by Service
- 11. Asia Pacific GCC Dangerous Goods Freight Market Analysis, Insights and Forecast, 2020-2032
- 11.1. Market Analysis, Insights and Forecast - by Service
- 11.1.1. Transportation
- 11.1.2. Warehousing and Inventory Management
- 11.1.3. Value-added Services
- 11.1. Market Analysis, Insights and Forecast - by Service
- 12. Competitive Analysis
- 12.1. Company Profiles
- 12.1.1 AAA Freight Services LLC
- 12.1.1.1. Company Overview
- 12.1.1.2. Products
- 12.1.1.3. Company Financials
- 12.1.1.4. SWOT Analysis
- 12.1.2 Hellmann Worldwide Logistics SE & Co
- 12.1.2.1. Company Overview
- 12.1.2.2. Products
- 12.1.2.3. Company Financials
- 12.1.2.4. SWOT Analysis
- 12.1.3 Bertschi AG
- 12.1.3.1. Company Overview
- 12.1.3.2. Products
- 12.1.3.3. Company Financials
- 12.1.3.4. SWOT Analysis
- 12.1.4 GAC
- 12.1.4.1. Company Overview
- 12.1.4.2. Products
- 12.1.4.3. Company Financials
- 12.1.4.4. SWOT Analysis
- 12.1.5 Petrochem
- 12.1.5.1. Company Overview
- 12.1.5.2. Products
- 12.1.5.3. Company Financials
- 12.1.5.4. SWOT Analysis
- 12.1.6 Agility
- 12.1.6.1. Company Overview
- 12.1.6.2. Products
- 12.1.6.3. Company Financials
- 12.1.6.4. SWOT Analysis
- 12.1.7 Al Ghazal Transport UAE**List Not Exhaustive
- 12.1.7.1. Company Overview
- 12.1.7.2. Products
- 12.1.7.3. Company Financials
- 12.1.7.4. SWOT Analysis
- 12.1.8 BDP INTERNATIONAL
- 12.1.8.1. Company Overview
- 12.1.8.2. Products
- 12.1.8.3. Company Financials
- 12.1.8.4. SWOT Analysis
- 12.1.9 Al Futtaim - Logistics
- 12.1.9.1. Company Overview
- 12.1.9.2. Products
- 12.1.9.3. Company Financials
- 12.1.9.4. SWOT Analysis
- 12.1.10 TALKE Group
- 12.1.10.1. Company Overview
- 12.1.10.2. Products
- 12.1.10.3. Company Financials
- 12.1.10.4. SWOT Analysis
- 12.1.1 AAA Freight Services LLC
- 12.2. Market Entropy
- 12.2.1 Company's Key Areas Served
- 12.2.2 Recent Developments
- 12.3. Company Market Share Analysis 2025
- 12.3.1 Top 5 Companies Market Share Analysis
- 12.3.2 Top 3 Companies Market Share Analysis
- 12.4. List of Potential Customers
- 13. Research Methodology
List of Figures
- Figure 1: Global GCC Dangerous Goods Freight Market Revenue Breakdown (Million, %) by Region 2025 & 2033
- Figure 2: North America GCC Dangerous Goods Freight Market Revenue (Million), by Service 2025 & 2033
- Figure 3: North America GCC Dangerous Goods Freight Market Revenue Share (%), by Service 2025 & 2033
- Figure 4: North America GCC Dangerous Goods Freight Market Revenue (Million), by Country 2025 & 2033
- Figure 5: North America GCC Dangerous Goods Freight Market Revenue Share (%), by Country 2025 & 2033
- Figure 6: South America GCC Dangerous Goods Freight Market Revenue (Million), by Service 2025 & 2033
- Figure 7: South America GCC Dangerous Goods Freight Market Revenue Share (%), by Service 2025 & 2033
- Figure 8: South America GCC Dangerous Goods Freight Market Revenue (Million), by Country 2025 & 2033
- Figure 9: South America GCC Dangerous Goods Freight Market Revenue Share (%), by Country 2025 & 2033
- Figure 10: Europe GCC Dangerous Goods Freight Market Revenue (Million), by Service 2025 & 2033
- Figure 11: Europe GCC Dangerous Goods Freight Market Revenue Share (%), by Service 2025 & 2033
- Figure 12: Europe GCC Dangerous Goods Freight Market Revenue (Million), by Country 2025 & 2033
- Figure 13: Europe GCC Dangerous Goods Freight Market Revenue Share (%), by Country 2025 & 2033
- Figure 14: Middle East & Africa GCC Dangerous Goods Freight Market Revenue (Million), by Service 2025 & 2033
- Figure 15: Middle East & Africa GCC Dangerous Goods Freight Market Revenue Share (%), by Service 2025 & 2033
- Figure 16: Middle East & Africa GCC Dangerous Goods Freight Market Revenue (Million), by Country 2025 & 2033
- Figure 17: Middle East & Africa GCC Dangerous Goods Freight Market Revenue Share (%), by Country 2025 & 2033
- Figure 18: Asia Pacific GCC Dangerous Goods Freight Market Revenue (Million), by Service 2025 & 2033
- Figure 19: Asia Pacific GCC Dangerous Goods Freight Market Revenue Share (%), by Service 2025 & 2033
- Figure 20: Asia Pacific GCC Dangerous Goods Freight Market Revenue (Million), by Country 2025 & 2033
- Figure 21: Asia Pacific GCC Dangerous Goods Freight Market Revenue Share (%), by Country 2025 & 2033
List of Tables
- Table 1: Global GCC Dangerous Goods Freight Market Revenue Million Forecast, by Service 2020 & 2033
- Table 2: Global GCC Dangerous Goods Freight Market Revenue Million Forecast, by Region 2020 & 2033
- Table 3: Global GCC Dangerous Goods Freight Market Revenue Million Forecast, by Service 2020 & 2033
- Table 4: Global GCC Dangerous Goods Freight Market Revenue Million Forecast, by Country 2020 & 2033
- Table 5: United States GCC Dangerous Goods Freight Market Revenue (Million) Forecast, by Application 2020 & 2033
- Table 6: Canada GCC Dangerous Goods Freight Market Revenue (Million) Forecast, by Application 2020 & 2033
- Table 7: Mexico GCC Dangerous Goods Freight Market Revenue (Million) Forecast, by Application 2020 & 2033
- Table 8: Global GCC Dangerous Goods Freight Market Revenue Million Forecast, by Service 2020 & 2033
- Table 9: Global GCC Dangerous Goods Freight Market Revenue Million Forecast, by Country 2020 & 2033
- Table 10: Brazil GCC Dangerous Goods Freight Market Revenue (Million) Forecast, by Application 2020 & 2033
- Table 11: Argentina GCC Dangerous Goods Freight Market Revenue (Million) Forecast, by Application 2020 & 2033
- Table 12: Rest of South America GCC Dangerous Goods Freight Market Revenue (Million) Forecast, by Application 2020 & 2033
- Table 13: Global GCC Dangerous Goods Freight Market Revenue Million Forecast, by Service 2020 & 2033
- Table 14: Global GCC Dangerous Goods Freight Market Revenue Million Forecast, by Country 2020 & 2033
- Table 15: United Kingdom GCC Dangerous Goods Freight Market Revenue (Million) Forecast, by Application 2020 & 2033
- Table 16: Germany GCC Dangerous Goods Freight Market Revenue (Million) Forecast, by Application 2020 & 2033
- Table 17: France GCC Dangerous Goods Freight Market Revenue (Million) Forecast, by Application 2020 & 2033
- Table 18: Italy GCC Dangerous Goods Freight Market Revenue (Million) Forecast, by Application 2020 & 2033
- Table 19: Spain GCC Dangerous Goods Freight Market Revenue (Million) Forecast, by Application 2020 & 2033
- Table 20: Russia GCC Dangerous Goods Freight Market Revenue (Million) Forecast, by Application 2020 & 2033
- Table 21: Benelux GCC Dangerous Goods Freight Market Revenue (Million) Forecast, by Application 2020 & 2033
- Table 22: Nordics GCC Dangerous Goods Freight Market Revenue (Million) Forecast, by Application 2020 & 2033
- Table 23: Rest of Europe GCC Dangerous Goods Freight Market Revenue (Million) Forecast, by Application 2020 & 2033
- Table 24: Global GCC Dangerous Goods Freight Market Revenue Million Forecast, by Service 2020 & 2033
- Table 25: Global GCC Dangerous Goods Freight Market Revenue Million Forecast, by Country 2020 & 2033
- Table 26: Turkey GCC Dangerous Goods Freight Market Revenue (Million) Forecast, by Application 2020 & 2033
- Table 27: Israel GCC Dangerous Goods Freight Market Revenue (Million) Forecast, by Application 2020 & 2033
- Table 28: GCC GCC Dangerous Goods Freight Market Revenue (Million) Forecast, by Application 2020 & 2033
- Table 29: North Africa GCC Dangerous Goods Freight Market Revenue (Million) Forecast, by Application 2020 & 2033
- Table 30: South Africa GCC Dangerous Goods Freight Market Revenue (Million) Forecast, by Application 2020 & 2033
- Table 31: Rest of Middle East & Africa GCC Dangerous Goods Freight Market Revenue (Million) Forecast, by Application 2020 & 2033
- Table 32: Global GCC Dangerous Goods Freight Market Revenue Million Forecast, by Service 2020 & 2033
- Table 33: Global GCC Dangerous Goods Freight Market Revenue Million Forecast, by Country 2020 & 2033
- Table 34: China GCC Dangerous Goods Freight Market Revenue (Million) Forecast, by Application 2020 & 2033
- Table 35: India GCC Dangerous Goods Freight Market Revenue (Million) Forecast, by Application 2020 & 2033
- Table 36: Japan GCC Dangerous Goods Freight Market Revenue (Million) Forecast, by Application 2020 & 2033
- Table 37: South Korea GCC Dangerous Goods Freight Market Revenue (Million) Forecast, by Application 2020 & 2033
- Table 38: ASEAN GCC Dangerous Goods Freight Market Revenue (Million) Forecast, by Application 2020 & 2033
- Table 39: Oceania GCC Dangerous Goods Freight Market Revenue (Million) Forecast, by Application 2020 & 2033
- Table 40: Rest of Asia Pacific GCC Dangerous Goods Freight Market Revenue (Million) Forecast, by Application 2020 & 2033
Frequently Asked Questions
1. What is the projected Compound Annual Growth Rate (CAGR) of the GCC Dangerous Goods Freight Market?
The projected CAGR is approximately > 5.00%.
2. Which companies are prominent players in the GCC Dangerous Goods Freight Market?
Key companies in the market include AAA Freight Services LLC, Hellmann Worldwide Logistics SE & Co, Bertschi AG, GAC, Petrochem, Agility, Al Ghazal Transport UAE**List Not Exhaustive, BDP INTERNATIONAL, Al Futtaim - Logistics, TALKE Group.
3. What are the main segments of the GCC Dangerous Goods Freight Market?
The market segments include Service.
4. Can you provide details about the market size?
The market size is estimated to be USD XX Million as of 2022.
5. What are some drivers contributing to market growth?
Growing Chemical and Refinery Industries Driving Market Growth.
6. What are the notable trends driving market growth?
Recovery of Chemical Industry.
7. Are there any restraints impacting market growth?
Challenges in Cross Boarder Shipping.
8. Can you provide examples of recent developments in the market?
June 2023: Magnate Worldwide is pleased to announce the acquisition of Cargo Logistics Group, a leading custom logistics service provider. In line with Magnate's organic and M&A growth strategy, Cargo Logistics Group is highly specialized, providing comprehensive logistics solutions for international and domestic mission-critical supply chains. CLG will become part of Masterpiece International and expand its footprint, adding a direct presence in the Baltimore and Washington DC area
9. What pricing options are available for accessing the report?
Pricing options include single-user, multi-user, and enterprise licenses priced at USD 3800, USD 4500, and USD 5800 respectively.
10. Is the market size provided in terms of value or volume?
The market size is provided in terms of value, measured in Million.
11. Are there any specific market keywords associated with the report?
Yes, the market keyword associated with the report is "GCC Dangerous Goods Freight Market," which aids in identifying and referencing the specific market segment covered.
12. How do I determine which pricing option suits my needs best?
The pricing options vary based on user requirements and access needs. Individual users may opt for single-user licenses, while businesses requiring broader access may choose multi-user or enterprise licenses for cost-effective access to the report.
13. Are there any additional resources or data provided in the GCC Dangerous Goods Freight Market report?
While the report offers comprehensive insights, it's advisable to review the specific contents or supplementary materials provided to ascertain if additional resources or data are available.
14. How can I stay updated on further developments or reports in the GCC Dangerous Goods Freight Market?
To stay informed about further developments, trends, and reports in the GCC Dangerous Goods Freight Market, consider subscribing to industry newsletters, following relevant companies and organizations, or regularly checking reputable industry news sources and publications.
Methodology
Step 1 - Identification of Relevant Samples Size from Population Database


Step 2 - Approaches for Defining Global Market Size (Value, Volume* & Price*)

Note*: In applicable scenarios
Step 3 - Data Sources
Primary Research
- Web Analytics
- Survey Reports
- Research Institute
- Latest Research Reports
- Opinion Leaders
Secondary Research
- Annual Reports
- White Paper
- Latest Press Release
- Industry Association
- Paid Database
- Investor Presentations

Step 4 - Data Triangulation
Involves using different sources of information in order to increase the validity of a study
These sources are likely to be stakeholders in a program - participants, other researchers, program staff, other community members, and so on.
Then we put all data in single framework & apply various statistical tools to find out the dynamic on the market.
During the analysis stage, feedback from the stakeholder groups would be compared to determine areas of agreement as well as areas of divergence