

Key Insights
The global chemical logistics market is experiencing robust growth, driven by the expanding chemical industry and increasing demand for efficient and secure transportation and handling of chemicals. The market's Compound Annual Growth Rate (CAGR) exceeding 4% indicates a significant upward trajectory projected through 2033. Key drivers include the rising global production and consumption of chemicals, particularly in emerging economies like those in Asia-Pacific and the Middle East. The increasing complexity of chemical supply chains, requiring specialized handling and stringent regulatory compliance, further fuels market expansion. Growth is segmented across various service types, including transportation (roadways dominating due to their flexibility), warehousing, distribution, inventory management, and specialized services like green logistics catering to environmental concerns. The pharmaceutical, cosmetic, oil & gas, and specialty chemicals industries are major end-users, contributing significantly to market volume. While potential restraints such as fluctuating fuel prices and geopolitical instability exist, the overall market outlook remains positive, fueled by technological advancements in supply chain management and a growing emphasis on safety and sustainability.
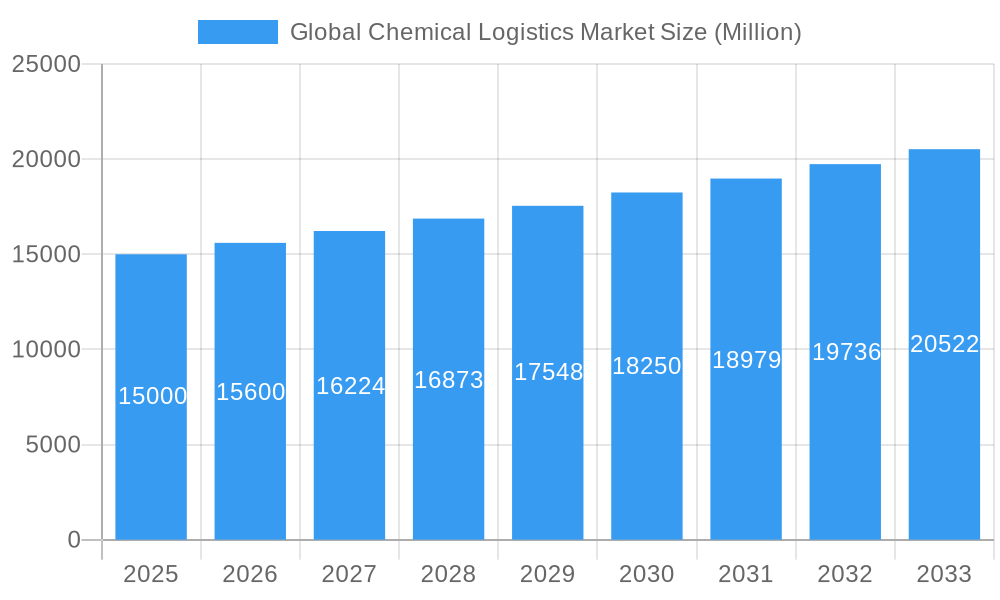
Global Chemical Logistics Market Market Size (In Billion)
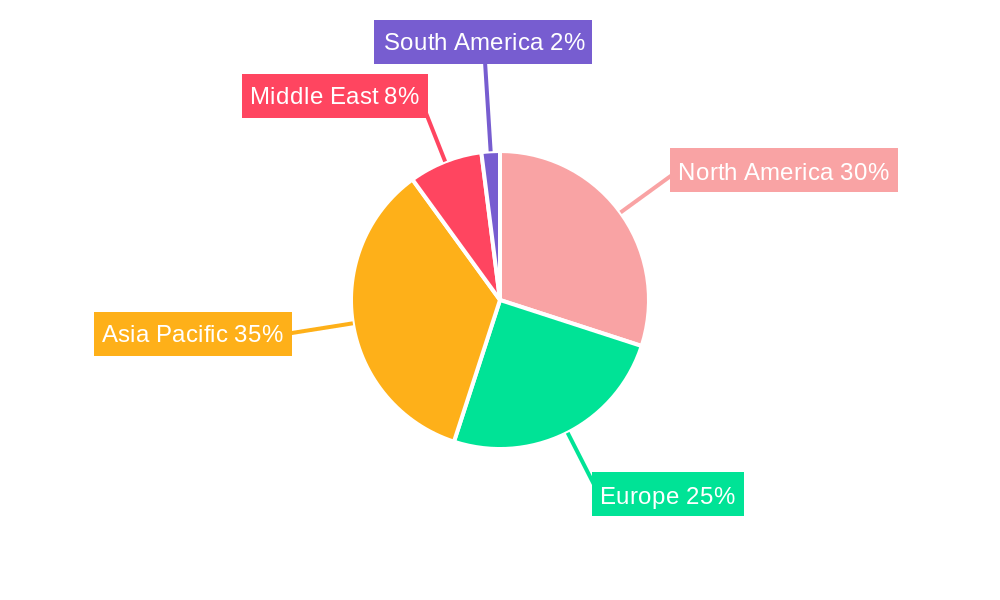
The market’s regional distribution reflects established chemical production hubs and emerging markets. North America and Europe currently hold substantial market share, owing to the presence of major chemical manufacturers and well-established logistics infrastructure. However, Asia-Pacific is poised for significant growth, driven by rapid industrialization and expanding chemical production capabilities in countries like China and India. The Middle East's petrochemical industry also contributes considerably to regional demand. Competition is intense, with both global giants like DHL and regional players vying for market share. Future growth will likely be influenced by factors such as the adoption of advanced technologies (e.g., blockchain for enhanced traceability), sustainable practices, and evolving regulatory landscapes. Companies are strategically investing in infrastructure, technology, and partnerships to maintain a competitive edge in this dynamic market.
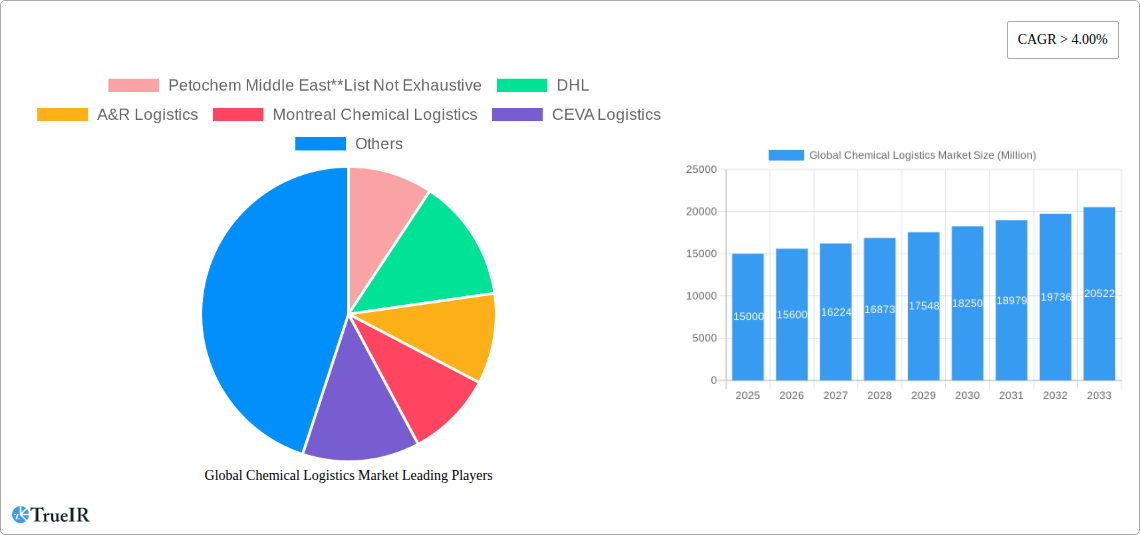
Global Chemical Logistics Market Company Market Share
Global Chemical Logistics Market: A Comprehensive Market Report (2019-2033)
This dynamic report provides a detailed analysis of the Global Chemical Logistics Market, offering invaluable insights for industry stakeholders, investors, and researchers. Leveraging extensive data from 2019-2024 (historical period), 2025 (base and estimated year), and projecting to 2033 (forecast period), this report unravels the market's current state and future trajectory. The market is expected to reach xx Million by 2033, exhibiting a CAGR of xx% during the forecast period.
Global Chemical Logistics Market Market Structure & Competitive Landscape
The global chemical logistics market is characterized by a moderately concentrated structure, with a few large, established players holding significant market share. The Herfindahl-Hirschman Index (HHI) is estimated at [Insert HHI Value Here], indicating a moderately competitive landscape. However, the market also thrives with a dynamic ecosystem of numerous smaller, agile, and specialized firms, each carving out its niche. Innovation is a paramount driver, with companies continually investing in cutting-edge technologies aimed at enhancing operational efficiency, bolstering safety protocols, and championing sustainability. Evolving regulatory frameworks, particularly concerning stringent environmental mandates and the rigorous safety standards for hazardous materials, profoundly influence market dynamics and necessitate adaptive strategies.
The existence of diverse and often interchangeable transportation modes, such as the strategic balance between rail and road transport, coupled with the persistent trend towards the development and adoption of integrated logistics solutions, collectively shapes the competitive arena. Significant consolidation through Mergers & Acquisitions (M&A) activity has been a notable feature in recent years, with approximately [Insert Number of M&A] major mergers and acquisitions recorded between 2019 and 2024. These strategic moves are primarily driven by the imperative to expand geographic reach, broaden service portfolios, and achieve economies of scale. End-user segmentation plays a crucial role in defining market demands, with the pharmaceutical, oil & gas, and specialty chemicals industries consistently emerging as the primary consumers of advanced chemical logistics services.
- Market Concentration: HHI estimated at [Insert HHI Value Here].
- Innovation Drivers: Automation, digitalization, advanced analytics, green logistics solutions, and AI-powered optimization.
- Regulatory Impacts: Stringent and evolving environmental, safety, and hazardous materials handling regulations.
- Product Substitutes & Intermodality: Strategic utilization of alternative transportation modes and sophisticated intermodal solutions.
- End-User Segmentation: Pharmaceutical, Oil & Gas, Specialty Chemicals, and Agrochemicals represent dominant segments.
- M&A Trends: Approximately [Insert Number of M&A] major acquisitions between 2019 and 2024, focused on market expansion and service enhancement.
Global Chemical Logistics Market Market Trends & Opportunities
The global chemical logistics market is currently experiencing robust and sustained growth, propelled by escalating industrial production, expanding global trade networks, and the burgeoning demand for highly specialized chemical transportation and warehousing solutions. The market size is projected to reach approximately [Insert Projected Market Size] by 2033, signifying a substantial increase from the estimated [Insert Current Market Size] in 2025. This impressive growth trajectory is underpinned by several transformative trends:
Pioneering technological advancements, such as the widespread adoption of blockchain technology for unparalleled supply chain transparency and the ubiquitous deployment of IoT devices for real-time monitoring and predictive maintenance, are revolutionizing operations and significantly boosting overall efficiency. Concurrently, shifts in consumer preferences towards environmentally conscious and ethically sourced products are directly influencing the demand for advanced green logistics solutions. The intensifying competition among logistics providers is a powerful catalyst, driving relentless innovation, fostering the development of superior service offerings, and promoting more competitive pricing structures. Market penetration rates for advanced logistics technologies are steadily climbing, with an anticipated adoption rate of [Insert Adoption Rate]% by 2033. The market is witnessing a pronounced shift towards the consolidation of services through integrated logistics solutions. This involves streamlining transportation, warehousing, customs clearance, and value-added services under single, comprehensive contracts, thereby enhancing efficiency and substantially reducing operational costs. This trend is poised to accelerate significantly throughout the forecast period. Furthermore, supportive government initiatives focused on enhancing transportation and logistics infrastructure are expected to foster a conducive environment for positive and sustainable market growth.
Dominant Markets & Segments in Global Chemical Logistics Market
North America currently holds the largest market share, driven by robust industrial activity and well-developed logistics infrastructure. However, Asia Pacific is projected to exhibit the highest growth rate during the forecast period, fueled by rapid economic expansion and increasing chemical production in countries like China and India.
By Service: Transportation currently dominates the market, followed by warehousing and distribution. However, the consulting & management services segment is expected to experience substantial growth, reflecting the increasing need for specialized expertise in chemical logistics.
By Mode of Transportation: Roadways currently hold the largest share, but the railways and waterways segments are gaining traction, driven by their cost-effectiveness and environmental benefits. Pipelines remain crucial for transporting bulk chemicals over long distances.
By End User: The pharmaceutical and specialty chemicals industries are key drivers of growth, due to their stringent requirements for safety and regulatory compliance. The oil and gas industry also presents a significant market segment.
- Key Growth Drivers (North America): Robust industrial base, advanced infrastructure.
- Key Growth Drivers (Asia Pacific): Rapid economic growth, rising chemical production.
- By Service: Transportation, warehousing, consulting & management services.
- By Mode of Transportation: Roadways, Railways, Waterways showing increased adoption.
- By End User: Pharmaceutical, specialty chemicals, oil & gas industries leading.
Global Chemical Logistics Market Product Analysis
Recent product innovations within the chemical logistics sector are heavily focused on elevating safety standards, optimizing operational efficiency, and advancing sustainability in both chemical transportation and storage. These advancements include the development of highly specialized and secure containers for the safe transport of hazardous materials, sophisticated real-time tracking and monitoring systems leveraging advanced sensors, and the implementation of eco-friendly and sustainable packaging solutions. The key to securing a competitive advantage lies in the ability to offer comprehensive, end-to-end integrated solutions. This involves effectively leveraging advanced technology to meticulously optimize supply chains, provide granular real-time visibility to all stakeholders, and consistently meet and exceed stringent regulatory compliance requirements. The market exhibits a strong and growing demand for highly customized solutions that are specifically tailored to accommodate the diverse properties of various chemical types and the unique requirements of different end-user industries.
Key Drivers, Barriers & Challenges in Global Chemical Logistics Market
Key Drivers: Increasing global trade, rising demand for chemicals, advancements in logistics technologies (e.g., IoT, AI), government initiatives promoting infrastructure development, and growing awareness of supply chain resilience.
Challenges: Stringent regulatory compliance requirements for hazardous materials, potential supply chain disruptions due to geopolitical instability or natural disasters, escalating fuel prices, and intense competition from established and emerging players. These factors could lead to a xx% reduction in projected market growth if not mitigated effectively.
Growth Drivers in the Global Chemical Logistics Market Market
The key growth drivers include increasing global trade volumes, rising demand for specialty chemicals, technological advancements improving efficiency and safety, and government regulations promoting sustainable logistics. Expanding industrialization, especially in developing economies, further fuels this growth.
Challenges Impacting Global Chemical Logistics Market Growth
The global chemical logistics market faces several significant challenges that could potentially impede its growth trajectory. These include the inherent volatility of global fuel prices, increasingly stringent environmental regulations that translate to higher operational costs, the critical need for highly specialized handling protocols for hazardous and sensitive chemicals, and the ever-present risk of supply chain disruptions stemming from geopolitical instability and unforeseen global events. These multifaceted challenges could collectively hinder the market's growth by an estimated [Insert Percentage of Hindrance]% if not effectively mitigated through strategic planning and proactive risk management.
Key Players Shaping the Global Chemical Logistics Market Market
Significant Global Chemical Logistics Market Industry Milestones
- 2021: DHL introduced a pioneering carbon-neutral shipping option specifically for chemical logistics, underscoring a commitment to sustainability.
- 2022: A&R Logistics strategically acquired a specialized chemical warehousing facility in Texas, enhancing its storage and distribution capabilities in a key region.
- 2023: CEVA Logistics successfully implemented a robust blockchain-based tracking system, significantly enhancing transparency and traceability across its chemical supply chains.
- [Insert Year]: [Insert Company Name] launched [Insert Innovation/Milestone], further advancing [Specific Area of Chemical Logistics]. (Further significant milestones can be added as they become available and are noteworthy.)
Future Outlook for Global Chemical Logistics Market Market
The future of the global chemical logistics market appears bright, with sustained growth expected driven by continued industrial expansion, technological innovation, and the increasing demand for sustainable and efficient logistics solutions. Strategic opportunities lie in investing in advanced technologies, focusing on green logistics solutions, and expanding into emerging markets. The market is poised to experience a period of significant transformation, requiring agility and adaptation to maintain competitiveness.
Global Chemical Logistics Market Segmentation
-
1. Service
- 1.1. Transportation
- 1.2. Warehous
- 1.3. Consulting & Management Services
- 1.4. Customs & Security
- 1.5. Green Logistics
- 1.6. Others
-
2. Mode of Transportation
- 2.1. Roadways
- 2.2. Railways
- 2.3. Airways
- 2.4. Waterways
- 2.5. Pipelines
-
3. End User
- 3.1. Pharmaceutical Industry
- 3.2. Cosmetic Industry
- 3.3. Oil and Gas Industry
- 3.4. Specialty Chemicals Industry
- 3.5. Other End Users
Global Chemical Logistics Market Segmentation By Geography
-
1. North America
- 1.1. United States
- 1.2. Canada
- 1.3. Mexico
-
2. Europe
- 2.1. Germany
- 2.2. France
- 2.3. United Kingdom
- 2.4. Italy
- 2.5. Spain
- 2.6. Russia
- 2.7. Rest of Europe
-
3. Asia Pacific
- 3.1. China
- 3.2. Japan
- 3.3. India
- 3.4. Bangladesh
- 3.5. Turkey
- 3.6. South Korea
- 3.7. Australia
- 3.8. Indonesia
- 3.9. Rest of Asia Pacific
- 4. Middle East
-
5. Egypt
- 5.1. South Africa
- 5.2. Saudi Arabia
- 5.3. Rest of Middle East
-
6. South America
- 6.1. Brazil
- 6.2. Argentina
- 6.3. Rest of South America
Global Chemical Logistics Market Regional Market Share
Geographic Coverage of Global Chemical Logistics Market
Global Chemical Logistics Market REPORT HIGHLIGHTS
| Aspects | Details |
|---|---|
| Study Period | 2020-2034 |
| Base Year | 2025 |
| Estimated Year | 2026 |
| Forecast Period | 2026-2034 |
| Historical Period | 2020-2025 |
| Growth Rate | CAGR of 5.2% from 2020-2034 |
| Segmentation |
|
Table of Contents
- 1. Introduction
- 1.1. Research Scope
- 1.2. Market Segmentation
- 1.3. Research Objective
- 1.4. Definitions and Assumptions
- 2. Executive Summary
- 2.1. Market Snapshot
- 3. Market Dynamics
- 3.1. Market Drivers
- 3.2. Market Restrains
- 3.3. Market Trends
- 3.4. Market Opportunities
- 4. Market Factor Analysis
- 4.1. Porters Five Forces
- 4.1.1. Bargaining Power of Suppliers
- 4.1.2. Bargaining Power of Buyers
- 4.1.3. Threat of New Entrants
- 4.1.4. Threat of Substitutes
- 4.1.5. Competitive Rivalry
- 4.2. PESTEL analysis
- 4.3. BCG Analysis
- 4.3.1. Stars (High Growth, High Market Share)
- 4.3.2. Cash Cows (Low Growth, High Market Share)
- 4.3.3. Question Mark (High Growth, Low Market Share)
- 4.3.4. Dogs (Low Growth, Low Market Share)
- 4.4. Ansoff Matrix Analysis
- 4.5. Supply Chain Analysis
- 4.6. Regulatory Landscape
- 4.7. Current Market Potential and Opportunity Assessment (TAM–SAM–SOM Framework)
- 4.8. TIR Analyst Note
- 4.1. Porters Five Forces
- 5. Market Analysis, Insights and Forecast 2021-2033
- 5.1. Market Analysis, Insights and Forecast - by Service
- 5.1.1. Transportation
- 5.1.2. Warehous
- 5.1.3. Consulting & Management Services
- 5.1.4. Customs & Security
- 5.1.5. Green Logistics
- 5.1.6. Others
- 5.2. Market Analysis, Insights and Forecast - by Mode of Transportation
- 5.2.1. Roadways
- 5.2.2. Railways
- 5.2.3. Airways
- 5.2.4. Waterways
- 5.2.5. Pipelines
- 5.3. Market Analysis, Insights and Forecast - by End User
- 5.3.1. Pharmaceutical Industry
- 5.3.2. Cosmetic Industry
- 5.3.3. Oil and Gas Industry
- 5.3.4. Specialty Chemicals Industry
- 5.3.5. Other End Users
- 5.4. Market Analysis, Insights and Forecast - by Region
- 5.4.1. North America
- 5.4.2. Europe
- 5.4.3. Asia Pacific
- 5.4.4. Middle East
- 5.4.5. Egypt
- 5.4.6. South America
- 5.1. Market Analysis, Insights and Forecast - by Service
- 6. Global Chemical Logistics Market Analysis, Insights and Forecast, 2021-2033
- 6.1. Market Analysis, Insights and Forecast - by Service
- 6.1.1. Transportation
- 6.1.2. Warehous
- 6.1.3. Consulting & Management Services
- 6.1.4. Customs & Security
- 6.1.5. Green Logistics
- 6.1.6. Others
- 6.2. Market Analysis, Insights and Forecast - by Mode of Transportation
- 6.2.1. Roadways
- 6.2.2. Railways
- 6.2.3. Airways
- 6.2.4. Waterways
- 6.2.5. Pipelines
- 6.3. Market Analysis, Insights and Forecast - by End User
- 6.3.1. Pharmaceutical Industry
- 6.3.2. Cosmetic Industry
- 6.3.3. Oil and Gas Industry
- 6.3.4. Specialty Chemicals Industry
- 6.3.5. Other End Users
- 6.1. Market Analysis, Insights and Forecast - by Service
- 7. North America Global Chemical Logistics Market Analysis, Insights and Forecast, 2020-2032
- 7.1. Market Analysis, Insights and Forecast - by Service
- 7.1.1. Transportation
- 7.1.2. Warehous
- 7.1.3. Consulting & Management Services
- 7.1.4. Customs & Security
- 7.1.5. Green Logistics
- 7.1.6. Others
- 7.2. Market Analysis, Insights and Forecast - by Mode of Transportation
- 7.2.1. Roadways
- 7.2.2. Railways
- 7.2.3. Airways
- 7.2.4. Waterways
- 7.2.5. Pipelines
- 7.3. Market Analysis, Insights and Forecast - by End User
- 7.3.1. Pharmaceutical Industry
- 7.3.2. Cosmetic Industry
- 7.3.3. Oil and Gas Industry
- 7.3.4. Specialty Chemicals Industry
- 7.3.5. Other End Users
- 7.1. Market Analysis, Insights and Forecast - by Service
- 8. Europe Global Chemical Logistics Market Analysis, Insights and Forecast, 2020-2032
- 8.1. Market Analysis, Insights and Forecast - by Service
- 8.1.1. Transportation
- 8.1.2. Warehous
- 8.1.3. Consulting & Management Services
- 8.1.4. Customs & Security
- 8.1.5. Green Logistics
- 8.1.6. Others
- 8.2. Market Analysis, Insights and Forecast - by Mode of Transportation
- 8.2.1. Roadways
- 8.2.2. Railways
- 8.2.3. Airways
- 8.2.4. Waterways
- 8.2.5. Pipelines
- 8.3. Market Analysis, Insights and Forecast - by End User
- 8.3.1. Pharmaceutical Industry
- 8.3.2. Cosmetic Industry
- 8.3.3. Oil and Gas Industry
- 8.3.4. Specialty Chemicals Industry
- 8.3.5. Other End Users
- 8.1. Market Analysis, Insights and Forecast - by Service
- 9. Asia Pacific Global Chemical Logistics Market Analysis, Insights and Forecast, 2020-2032
- 9.1. Market Analysis, Insights and Forecast - by Service
- 9.1.1. Transportation
- 9.1.2. Warehous
- 9.1.3. Consulting & Management Services
- 9.1.4. Customs & Security
- 9.1.5. Green Logistics
- 9.1.6. Others
- 9.2. Market Analysis, Insights and Forecast - by Mode of Transportation
- 9.2.1. Roadways
- 9.2.2. Railways
- 9.2.3. Airways
- 9.2.4. Waterways
- 9.2.5. Pipelines
- 9.3. Market Analysis, Insights and Forecast - by End User
- 9.3.1. Pharmaceutical Industry
- 9.3.2. Cosmetic Industry
- 9.3.3. Oil and Gas Industry
- 9.3.4. Specialty Chemicals Industry
- 9.3.5. Other End Users
- 9.1. Market Analysis, Insights and Forecast - by Service
- 10. Middle East Global Chemical Logistics Market Analysis, Insights and Forecast, 2020-2032
- 10.1. Market Analysis, Insights and Forecast - by Service
- 10.1.1. Transportation
- 10.1.2. Warehous
- 10.1.3. Consulting & Management Services
- 10.1.4. Customs & Security
- 10.1.5. Green Logistics
- 10.1.6. Others
- 10.2. Market Analysis, Insights and Forecast - by Mode of Transportation
- 10.2.1. Roadways
- 10.2.2. Railways
- 10.2.3. Airways
- 10.2.4. Waterways
- 10.2.5. Pipelines
- 10.3. Market Analysis, Insights and Forecast - by End User
- 10.3.1. Pharmaceutical Industry
- 10.3.2. Cosmetic Industry
- 10.3.3. Oil and Gas Industry
- 10.3.4. Specialty Chemicals Industry
- 10.3.5. Other End Users
- 10.1. Market Analysis, Insights and Forecast - by Service
- 11. Egypt Global Chemical Logistics Market Analysis, Insights and Forecast, 2020-2032
- 11.1. Market Analysis, Insights and Forecast - by Service
- 11.1.1. Transportation
- 11.1.2. Warehous
- 11.1.3. Consulting & Management Services
- 11.1.4. Customs & Security
- 11.1.5. Green Logistics
- 11.1.6. Others
- 11.2. Market Analysis, Insights and Forecast - by Mode of Transportation
- 11.2.1. Roadways
- 11.2.2. Railways
- 11.2.3. Airways
- 11.2.4. Waterways
- 11.2.5. Pipelines
- 11.3. Market Analysis, Insights and Forecast - by End User
- 11.3.1. Pharmaceutical Industry
- 11.3.2. Cosmetic Industry
- 11.3.3. Oil and Gas Industry
- 11.3.4. Specialty Chemicals Industry
- 11.3.5. Other End Users
- 11.1. Market Analysis, Insights and Forecast - by Service
- 12. South America Global Chemical Logistics Market Analysis, Insights and Forecast, 2020-2032
- 12.1. Market Analysis, Insights and Forecast - by Service
- 12.1.1. Transportation
- 12.1.2. Warehous
- 12.1.3. Consulting & Management Services
- 12.1.4. Customs & Security
- 12.1.5. Green Logistics
- 12.1.6. Others
- 12.2. Market Analysis, Insights and Forecast - by Mode of Transportation
- 12.2.1. Roadways
- 12.2.2. Railways
- 12.2.3. Airways
- 12.2.4. Waterways
- 12.2.5. Pipelines
- 12.3. Market Analysis, Insights and Forecast - by End User
- 12.3.1. Pharmaceutical Industry
- 12.3.2. Cosmetic Industry
- 12.3.3. Oil and Gas Industry
- 12.3.4. Specialty Chemicals Industry
- 12.3.5. Other End Users
- 12.1. Market Analysis, Insights and Forecast - by Service
- 13. Competitive Analysis
- 13.1. Company Profiles
- 13.1.1 Petochem Middle East**List Not Exhaustive
- 13.1.1.1. Company Overview
- 13.1.1.2. Products
- 13.1.1.3. Company Financials
- 13.1.1.4. SWOT Analysis
- 13.1.2 DHL
- 13.1.2.1. Company Overview
- 13.1.2.2. Products
- 13.1.2.3. Company Financials
- 13.1.2.4. SWOT Analysis
- 13.1.3 A&R Logistics
- 13.1.3.1. Company Overview
- 13.1.3.2. Products
- 13.1.3.3. Company Financials
- 13.1.3.4. SWOT Analysis
- 13.1.4 Montreal Chemical Logistics
- 13.1.4.1. Company Overview
- 13.1.4.2. Products
- 13.1.4.3. Company Financials
- 13.1.4.4. SWOT Analysis
- 13.1.5 CEVA Logistics
- 13.1.5.1. Company Overview
- 13.1.5.2. Products
- 13.1.5.3. Company Financials
- 13.1.5.4. SWOT Analysis
- 13.1.6 Al-Futtaim Logistics
- 13.1.6.1. Company Overview
- 13.1.6.2. Products
- 13.1.6.3. Company Financials
- 13.1.6.4. SWOT Analysis
- 13.1.7 Agility Logistics
- 13.1.7.1. Company Overview
- 13.1.7.2. Products
- 13.1.7.3. Company Financials
- 13.1.7.4. SWOT Analysis
- 13.1.8 BDP International
- 13.1.8.1. Company Overview
- 13.1.8.2. Products
- 13.1.8.3. Company Financials
- 13.1.8.4. SWOT Analysis
- 13.1.9 C H Robinson
- 13.1.9.1. Company Overview
- 13.1.9.2. Products
- 13.1.9.3. Company Financials
- 13.1.9.4. SWOT Analysis
- 13.1.10 Rhenus Logistics
- 13.1.10.1. Company Overview
- 13.1.10.2. Products
- 13.1.10.3. Company Financials
- 13.1.10.4. SWOT Analysis
- 13.1.1 Petochem Middle East**List Not Exhaustive
- 13.2. Market Entropy
- 13.2.1 Company's Key Areas Served
- 13.2.2 Recent Developments
- 13.3. Company Market Share Analysis 2025
- 13.3.1 Top 5 Companies Market Share Analysis
- 13.3.2 Top 3 Companies Market Share Analysis
- 13.4. List of Potential Customers
- 14. Research Methodology
List of Figures
- Figure 1: Global Global Chemical Logistics Market Revenue Breakdown (billion, %) by Region 2025 & 2033
- Figure 2: North America Global Chemical Logistics Market Revenue (billion), by Service 2025 & 2033
- Figure 3: North America Global Chemical Logistics Market Revenue Share (%), by Service 2025 & 2033
- Figure 4: North America Global Chemical Logistics Market Revenue (billion), by Mode of Transportation 2025 & 2033
- Figure 5: North America Global Chemical Logistics Market Revenue Share (%), by Mode of Transportation 2025 & 2033
- Figure 6: North America Global Chemical Logistics Market Revenue (billion), by End User 2025 & 2033
- Figure 7: North America Global Chemical Logistics Market Revenue Share (%), by End User 2025 & 2033
- Figure 8: North America Global Chemical Logistics Market Revenue (billion), by Country 2025 & 2033
- Figure 9: North America Global Chemical Logistics Market Revenue Share (%), by Country 2025 & 2033
- Figure 10: Europe Global Chemical Logistics Market Revenue (billion), by Service 2025 & 2033
- Figure 11: Europe Global Chemical Logistics Market Revenue Share (%), by Service 2025 & 2033
- Figure 12: Europe Global Chemical Logistics Market Revenue (billion), by Mode of Transportation 2025 & 2033
- Figure 13: Europe Global Chemical Logistics Market Revenue Share (%), by Mode of Transportation 2025 & 2033
- Figure 14: Europe Global Chemical Logistics Market Revenue (billion), by End User 2025 & 2033
- Figure 15: Europe Global Chemical Logistics Market Revenue Share (%), by End User 2025 & 2033
- Figure 16: Europe Global Chemical Logistics Market Revenue (billion), by Country 2025 & 2033
- Figure 17: Europe Global Chemical Logistics Market Revenue Share (%), by Country 2025 & 2033
- Figure 18: Asia Pacific Global Chemical Logistics Market Revenue (billion), by Service 2025 & 2033
- Figure 19: Asia Pacific Global Chemical Logistics Market Revenue Share (%), by Service 2025 & 2033
- Figure 20: Asia Pacific Global Chemical Logistics Market Revenue (billion), by Mode of Transportation 2025 & 2033
- Figure 21: Asia Pacific Global Chemical Logistics Market Revenue Share (%), by Mode of Transportation 2025 & 2033
- Figure 22: Asia Pacific Global Chemical Logistics Market Revenue (billion), by End User 2025 & 2033
- Figure 23: Asia Pacific Global Chemical Logistics Market Revenue Share (%), by End User 2025 & 2033
- Figure 24: Asia Pacific Global Chemical Logistics Market Revenue (billion), by Country 2025 & 2033
- Figure 25: Asia Pacific Global Chemical Logistics Market Revenue Share (%), by Country 2025 & 2033
- Figure 26: Middle East Global Chemical Logistics Market Revenue (billion), by Service 2025 & 2033
- Figure 27: Middle East Global Chemical Logistics Market Revenue Share (%), by Service 2025 & 2033
- Figure 28: Middle East Global Chemical Logistics Market Revenue (billion), by Mode of Transportation 2025 & 2033
- Figure 29: Middle East Global Chemical Logistics Market Revenue Share (%), by Mode of Transportation 2025 & 2033
- Figure 30: Middle East Global Chemical Logistics Market Revenue (billion), by End User 2025 & 2033
- Figure 31: Middle East Global Chemical Logistics Market Revenue Share (%), by End User 2025 & 2033
- Figure 32: Middle East Global Chemical Logistics Market Revenue (billion), by Country 2025 & 2033
- Figure 33: Middle East Global Chemical Logistics Market Revenue Share (%), by Country 2025 & 2033
- Figure 34: Egypt Global Chemical Logistics Market Revenue (billion), by Service 2025 & 2033
- Figure 35: Egypt Global Chemical Logistics Market Revenue Share (%), by Service 2025 & 2033
- Figure 36: Egypt Global Chemical Logistics Market Revenue (billion), by Mode of Transportation 2025 & 2033
- Figure 37: Egypt Global Chemical Logistics Market Revenue Share (%), by Mode of Transportation 2025 & 2033
- Figure 38: Egypt Global Chemical Logistics Market Revenue (billion), by End User 2025 & 2033
- Figure 39: Egypt Global Chemical Logistics Market Revenue Share (%), by End User 2025 & 2033
- Figure 40: Egypt Global Chemical Logistics Market Revenue (billion), by Country 2025 & 2033
- Figure 41: Egypt Global Chemical Logistics Market Revenue Share (%), by Country 2025 & 2033
- Figure 42: South America Global Chemical Logistics Market Revenue (billion), by Service 2025 & 2033
- Figure 43: South America Global Chemical Logistics Market Revenue Share (%), by Service 2025 & 2033
- Figure 44: South America Global Chemical Logistics Market Revenue (billion), by Mode of Transportation 2025 & 2033
- Figure 45: South America Global Chemical Logistics Market Revenue Share (%), by Mode of Transportation 2025 & 2033
- Figure 46: South America Global Chemical Logistics Market Revenue (billion), by End User 2025 & 2033
- Figure 47: South America Global Chemical Logistics Market Revenue Share (%), by End User 2025 & 2033
- Figure 48: South America Global Chemical Logistics Market Revenue (billion), by Country 2025 & 2033
- Figure 49: South America Global Chemical Logistics Market Revenue Share (%), by Country 2025 & 2033
List of Tables
- Table 1: Global Chemical Logistics Market Revenue billion Forecast, by Service 2020 & 2033
- Table 2: Global Chemical Logistics Market Revenue billion Forecast, by Mode of Transportation 2020 & 2033
- Table 3: Global Chemical Logistics Market Revenue billion Forecast, by End User 2020 & 2033
- Table 4: Global Chemical Logistics Market Revenue billion Forecast, by Region 2020 & 2033
- Table 5: Global Chemical Logistics Market Revenue billion Forecast, by Service 2020 & 2033
- Table 6: Global Chemical Logistics Market Revenue billion Forecast, by Mode of Transportation 2020 & 2033
- Table 7: Global Chemical Logistics Market Revenue billion Forecast, by End User 2020 & 2033
- Table 8: Global Chemical Logistics Market Revenue billion Forecast, by Country 2020 & 2033
- Table 9: United States Global Chemical Logistics Market Revenue (billion) Forecast, by Application 2020 & 2033
- Table 10: Canada Global Chemical Logistics Market Revenue (billion) Forecast, by Application 2020 & 2033
- Table 11: Mexico Global Chemical Logistics Market Revenue (billion) Forecast, by Application 2020 & 2033
- Table 12: Global Chemical Logistics Market Revenue billion Forecast, by Service 2020 & 2033
- Table 13: Global Chemical Logistics Market Revenue billion Forecast, by Mode of Transportation 2020 & 2033
- Table 14: Global Chemical Logistics Market Revenue billion Forecast, by End User 2020 & 2033
- Table 15: Global Chemical Logistics Market Revenue billion Forecast, by Country 2020 & 2033
- Table 16: Germany Global Chemical Logistics Market Revenue (billion) Forecast, by Application 2020 & 2033
- Table 17: France Global Chemical Logistics Market Revenue (billion) Forecast, by Application 2020 & 2033
- Table 18: United Kingdom Global Chemical Logistics Market Revenue (billion) Forecast, by Application 2020 & 2033
- Table 19: Italy Global Chemical Logistics Market Revenue (billion) Forecast, by Application 2020 & 2033
- Table 20: Spain Global Chemical Logistics Market Revenue (billion) Forecast, by Application 2020 & 2033
- Table 21: Russia Global Chemical Logistics Market Revenue (billion) Forecast, by Application 2020 & 2033
- Table 22: Rest of Europe Global Chemical Logistics Market Revenue (billion) Forecast, by Application 2020 & 2033
- Table 23: Global Chemical Logistics Market Revenue billion Forecast, by Service 2020 & 2033
- Table 24: Global Chemical Logistics Market Revenue billion Forecast, by Mode of Transportation 2020 & 2033
- Table 25: Global Chemical Logistics Market Revenue billion Forecast, by End User 2020 & 2033
- Table 26: Global Chemical Logistics Market Revenue billion Forecast, by Country 2020 & 2033
- Table 27: China Global Chemical Logistics Market Revenue (billion) Forecast, by Application 2020 & 2033
- Table 28: Japan Global Chemical Logistics Market Revenue (billion) Forecast, by Application 2020 & 2033
- Table 29: India Global Chemical Logistics Market Revenue (billion) Forecast, by Application 2020 & 2033
- Table 30: Bangladesh Global Chemical Logistics Market Revenue (billion) Forecast, by Application 2020 & 2033
- Table 31: Turkey Global Chemical Logistics Market Revenue (billion) Forecast, by Application 2020 & 2033
- Table 32: South Korea Global Chemical Logistics Market Revenue (billion) Forecast, by Application 2020 & 2033
- Table 33: Australia Global Chemical Logistics Market Revenue (billion) Forecast, by Application 2020 & 2033
- Table 34: Indonesia Global Chemical Logistics Market Revenue (billion) Forecast, by Application 2020 & 2033
- Table 35: Rest of Asia Pacific Global Chemical Logistics Market Revenue (billion) Forecast, by Application 2020 & 2033
- Table 36: Global Chemical Logistics Market Revenue billion Forecast, by Service 2020 & 2033
- Table 37: Global Chemical Logistics Market Revenue billion Forecast, by Mode of Transportation 2020 & 2033
- Table 38: Global Chemical Logistics Market Revenue billion Forecast, by End User 2020 & 2033
- Table 39: Global Chemical Logistics Market Revenue billion Forecast, by Country 2020 & 2033
- Table 40: Global Chemical Logistics Market Revenue billion Forecast, by Service 2020 & 2033
- Table 41: Global Chemical Logistics Market Revenue billion Forecast, by Mode of Transportation 2020 & 2033
- Table 42: Global Chemical Logistics Market Revenue billion Forecast, by End User 2020 & 2033
- Table 43: Global Chemical Logistics Market Revenue billion Forecast, by Country 2020 & 2033
- Table 44: South Africa Global Chemical Logistics Market Revenue (billion) Forecast, by Application 2020 & 2033
- Table 45: Saudi Arabia Global Chemical Logistics Market Revenue (billion) Forecast, by Application 2020 & 2033
- Table 46: Rest of Middle East Global Chemical Logistics Market Revenue (billion) Forecast, by Application 2020 & 2033
- Table 47: Global Chemical Logistics Market Revenue billion Forecast, by Service 2020 & 2033
- Table 48: Global Chemical Logistics Market Revenue billion Forecast, by Mode of Transportation 2020 & 2033
- Table 49: Global Chemical Logistics Market Revenue billion Forecast, by End User 2020 & 2033
- Table 50: Global Chemical Logistics Market Revenue billion Forecast, by Country 2020 & 2033
- Table 51: Brazil Global Chemical Logistics Market Revenue (billion) Forecast, by Application 2020 & 2033
- Table 52: Argentina Global Chemical Logistics Market Revenue (billion) Forecast, by Application 2020 & 2033
- Table 53: Rest of South America Global Chemical Logistics Market Revenue (billion) Forecast, by Application 2020 & 2033
Frequently Asked Questions
1. What is the projected Compound Annual Growth Rate (CAGR) of the Global Chemical Logistics Market?
The projected CAGR is approximately 5.2%.
2. Which companies are prominent players in the Global Chemical Logistics Market?
Key companies in the market include Petochem Middle East**List Not Exhaustive, DHL, A&R Logistics, Montreal Chemical Logistics, CEVA Logistics, Al-Futtaim Logistics, Agility Logistics, BDP International, C H Robinson, Rhenus Logistics.
3. What are the main segments of the Global Chemical Logistics Market?
The market segments include Service, Mode of Transportation, End User.
4. Can you provide details about the market size?
The market size is estimated to be USD 300.5 billion as of 2022.
5. What are some drivers contributing to market growth?
Growing Events in E-commerce Sector; Increasing Demand for Qualified Event Logistics Services.
6. What are the notable trends driving market growth?
Chemical Sector Significant Expansion Driving the market.
7. Are there any restraints impacting market growth?
High Labour Cost; High Pricing.
8. Can you provide examples of recent developments in the market?
N/A
9. What pricing options are available for accessing the report?
Pricing options include single-user, multi-user, and enterprise licenses priced at USD 4750, USD 5250, and USD 8750 respectively.
10. Is the market size provided in terms of value or volume?
The market size is provided in terms of value, measured in billion.
11. Are there any specific market keywords associated with the report?
Yes, the market keyword associated with the report is "Global Chemical Logistics Market," which aids in identifying and referencing the specific market segment covered.
12. How do I determine which pricing option suits my needs best?
The pricing options vary based on user requirements and access needs. Individual users may opt for single-user licenses, while businesses requiring broader access may choose multi-user or enterprise licenses for cost-effective access to the report.
13. Are there any additional resources or data provided in the Global Chemical Logistics Market report?
While the report offers comprehensive insights, it's advisable to review the specific contents or supplementary materials provided to ascertain if additional resources or data are available.
14. How can I stay updated on further developments or reports in the Global Chemical Logistics Market?
To stay informed about further developments, trends, and reports in the Global Chemical Logistics Market, consider subscribing to industry newsletters, following relevant companies and organizations, or regularly checking reputable industry news sources and publications.
Methodology
Step 1 - Identification of Relevant Samples Size from Population Database


Step 2 - Approaches for Defining Global Market Size (Value, Volume* & Price*)

Note*: In applicable scenarios
Step 3 - Data Sources
Primary Research
- Web Analytics
- Survey Reports
- Research Institute
- Latest Research Reports
- Opinion Leaders
Secondary Research
- Annual Reports
- White Paper
- Latest Press Release
- Industry Association
- Paid Database
- Investor Presentations

Step 4 - Data Triangulation
Involves using different sources of information in order to increase the validity of a study
These sources are likely to be stakeholders in a program - participants, other researchers, program staff, other community members, and so on.
Then we put all data in single framework & apply various statistical tools to find out the dynamic on the market.
During the analysis stage, feedback from the stakeholder groups would be compared to determine areas of agreement as well as areas of divergence