

Key Insights
The global pharmaceutical 3PL market is experiencing robust growth, driven by increasing outsourcing of logistics functions by pharmaceutical companies and the rising demand for temperature-sensitive drug transportation. The market's Compound Annual Growth Rate (CAGR) exceeding 7% from 2019 to 2024 indicates significant expansion. This growth is fueled by several factors. The complexity of pharmaceutical supply chains, including stringent regulatory compliance, necessitates specialized logistics expertise that many pharmaceutical manufacturers find more efficient to outsource. Furthermore, the increasing prevalence of biologics and other temperature-sensitive drugs significantly expands the demand for cold chain logistics, a major segment within the 3PL market. Market expansion is further bolstered by advancements in technology, such as real-time tracking and monitoring systems, enhancing supply chain visibility and efficiency. While regulatory hurdles and potential geopolitical uncertainties might present some challenges, the overall market trajectory remains positive, particularly in regions with strong pharmaceutical production and distribution networks like North America and Europe.
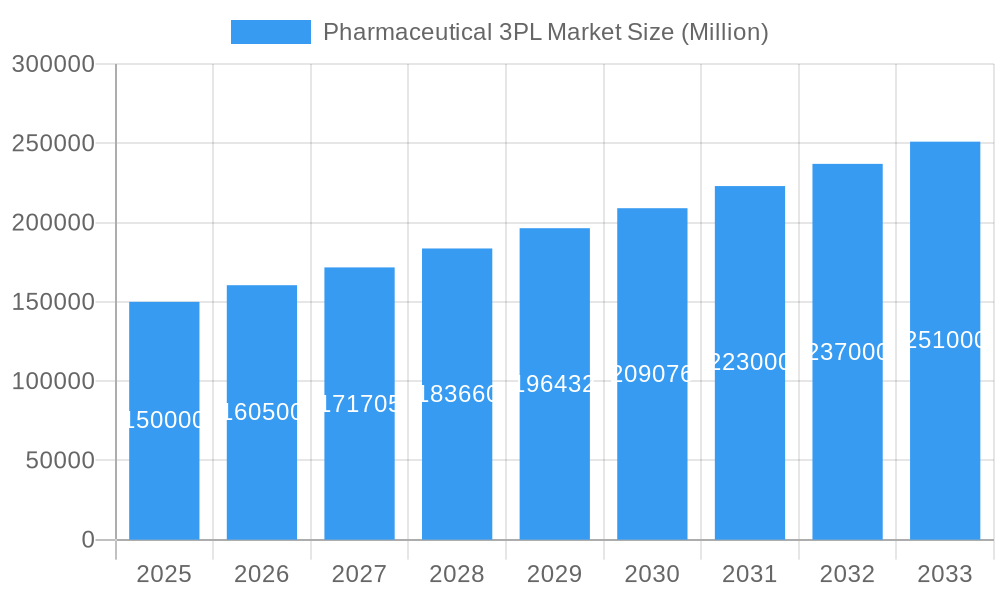
Pharmaceutical 3PL Market Market Size (In Billion)
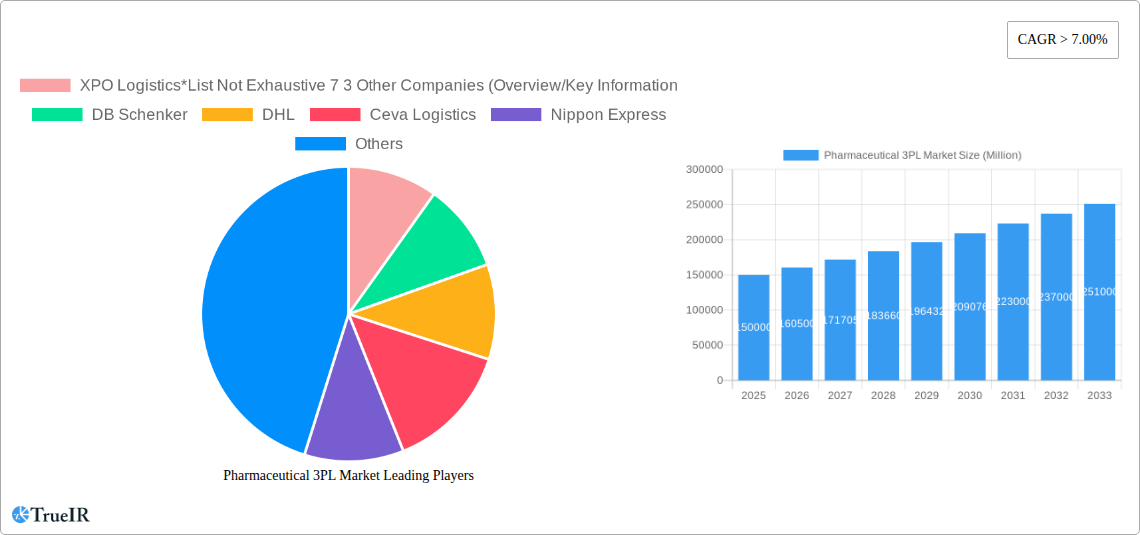
Geographic segmentation reveals significant regional variations. North America and Europe currently dominate the market share, driven by established pharmaceutical industries and advanced logistics infrastructure. However, emerging markets in Asia Pacific, particularly India and China, are witnessing rapid growth due to expanding pharmaceutical manufacturing and increasing healthcare spending. The market is further segmented by function (domestic vs. international transportation management, value-added warehousing and distribution) and supply chain type (cold chain vs. non-cold chain). Cold chain logistics represents a rapidly growing segment, driven by the aforementioned increase in temperature-sensitive pharmaceuticals. Leading players, including XPO Logistics, DB Schenker, DHL, Ceva Logistics, Nippon Express, UPS, FedEx, Kuehne + Nagel, Agility, and Kerry Logistics, are actively expanding their capabilities and geographical reach to capitalize on these market opportunities, leading to an increasingly competitive landscape. This competition, while pressuring profit margins, simultaneously drives innovation and efficiency improvements throughout the market.
Pharmaceutical 3PL Market Company Market Share
Pharmaceutical 3PL Market Report: A Comprehensive Analysis of Growth, Trends, and Opportunities (2019-2033)
This dynamic report provides a comprehensive analysis of the Pharmaceutical 3PL market, offering invaluable insights for stakeholders across the pharmaceutical supply chain. Leveraging rigorous research and data analysis spanning the period 2019-2033, this report meticulously examines market size, growth drivers, competitive dynamics, and future trends. With a focus on key segments, including cold chain and non-cold chain logistics, this study is essential for strategic decision-making and investment planning within the pharmaceutical industry. The report encompasses a detailed analysis of market size valued at xx Million in 2025, projecting a Compound Annual Growth Rate (CAGR) of xx% from 2025 to 2033.
Pharmaceutical 3PL Market Structure & Competitive Landscape
The Pharmaceutical 3PL market exhibits a moderately concentrated structure, with a few dominant players holding significant market share. The Herfindahl-Hirschman Index (HHI) is estimated at xx, indicating a [Level of Concentration: e.g., moderately concentrated] market. Innovation drivers include the increasing demand for temperature-sensitive pharmaceutical products, advancements in warehouse automation, and the rise of digital supply chain solutions. Stringent regulatory compliance requirements (e.g., GDP, temperature monitoring) significantly impact market operations. Product substitutes are limited, with most pharmaceutical companies relying on specialized 3PL providers for handling sensitive goods. The end-user segment comprises pharmaceutical manufacturers, distributors, and hospitals. M&A activity has been relatively high in recent years, with xx Million in deals recorded between 2019 and 2024, driven by the need for scale and specialized capabilities.
- Market Concentration: HHI estimated at xx, indicating a [Level of Concentration] market.
- Innovation Drivers: Warehouse automation, digital supply chain solutions, temperature-sensitive product handling.
- Regulatory Impacts: Stringent GDP and temperature monitoring compliance.
- End-User Segmentation: Pharmaceutical manufacturers, distributors, hospitals.
- M&A Trends: xx Million in deals between 2019 and 2024.
Pharmaceutical 3PL Market Market Trends & Opportunities
The global Pharmaceutical 3PL market is experiencing robust growth, fueled by the increasing complexity of pharmaceutical supply chains and the growing demand for specialized logistics solutions. The market size reached xx Million in 2025 and is projected to reach xx Million by 2033, exhibiting a CAGR of xx%. Technological advancements, such as the Internet of Things (IoT), AI-powered analytics, and blockchain technology, are transforming the industry, offering improved visibility, efficiency, and security. Consumer preferences for personalized medicine and direct-to-patient delivery models are further shaping market dynamics. Intense competition among 3PL providers is leading to innovative service offerings and pricing strategies. Market penetration of advanced logistics technologies is also rising, with xx% of pharmaceutical companies utilizing these technologies in 2025.
Dominant Markets & Segments in Pharmaceutical 3PL Market
The North American region currently holds the largest market share, driven by the high concentration of pharmaceutical companies and robust infrastructure. Within segments, Cold Chain logistics demonstrates significant growth potential.
- Leading Regions/Countries: North America, followed by Europe and Asia-Pacific.
- Fastest-Growing Segments:
- Function: Value-added Warehousing and Distribution, driven by increasing demand for specialized services.
- Supply Chain: Cold Chain, fueled by the rise of biologics and other temperature-sensitive pharmaceuticals.
Growth Drivers:
- North America: Well-developed infrastructure, high concentration of pharmaceutical companies, and strong regulatory frameworks.
- Europe: Stringent regulatory compliance, a large pharmaceutical industry, and growing demand for specialized logistics solutions.
- Asia-Pacific: Rapidly expanding pharmaceutical market, increasing investments in infrastructure, and growing demand for temperature-controlled logistics.
Pharmaceutical 3PL Market Product Analysis
The Pharmaceutical 3PL market offers a range of services, from basic transportation to complex, value-added solutions, including temperature-controlled warehousing, specialized packaging, and last-mile delivery. Recent innovations focus on improving visibility, traceability, and security throughout the supply chain, using technologies such as RFID tagging, GPS tracking, and blockchain. The competitive advantage lies in providing customized, reliable, and compliant solutions tailored to the specific needs of pharmaceutical companies.
Key Drivers, Barriers & Challenges in Pharmaceutical 3PL Market
Key Drivers:
- Rising demand for temperature-sensitive pharmaceuticals.
- Increasing complexity of pharmaceutical supply chains.
- Advancements in technology such as IoT and AI.
- Growth of e-commerce and direct-to-patient delivery models.
Challenges:
- Stringent regulatory compliance requirements.
- Supply chain disruptions (e.g., geopolitical instability, natural disasters).
- High operational costs.
- Intense competition from established and emerging players.
Growth Drivers in the Pharmaceutical 3PL Market Market
The increasing demand for temperature-sensitive pharmaceuticals, coupled with the rising complexity of global supply chains, is a primary growth driver. Technological advancements, such as the adoption of IoT and AI, are improving efficiency and transparency. Favorable regulatory policies supporting pharmaceutical innovation are also contributing to market expansion.
Challenges Impacting Pharmaceutical 3PL Market Growth
Stringent regulatory compliance, including GDP guidelines and temperature monitoring, presents a significant challenge. Supply chain vulnerabilities, such as geopolitical instability and natural disasters, can cause disruptions. Intense competition from both established and emerging players puts downward pressure on pricing and profit margins.
Key Players Shaping the Pharmaceutical 3PL Market Market
- XPO Logistics
- DB Schenker
- DHL
- Ceva Logistics
- Nippon Express
- UPS
- FedEx
- Kuehne + Nagel
- Agility
- Kerry Logistics
Significant Pharmaceutical 3PL Market Industry Milestones
- 2021: Introduction of advanced temperature monitoring systems by leading 3PL providers.
- 2022: Significant investment in cold chain infrastructure in developing economies.
- 2023: Increased adoption of blockchain technology for enhanced supply chain transparency.
Future Outlook for Pharmaceutical 3PL Market Market
The Pharmaceutical 3PL market is poised for continued growth, driven by technological innovation, expanding global pharmaceutical markets, and increased demand for specialized logistics solutions. Strategic partnerships, investments in advanced technologies, and a focus on regulatory compliance will be critical for success. The market presents significant opportunities for companies that can adapt to evolving customer needs and leverage technology to enhance efficiency and security within the pharmaceutical supply chain.
Pharmaceutical 3PL Market Segmentation
-
1. Function
- 1.1. Domestic Transportation Management
- 1.2. International Transportation Management
- 1.3. Value-added Warehousing and Distribution
-
2. Supply Chain
- 2.1. Cold Chain
- 2.2. Non-cold Chain
Pharmaceutical 3PL Market Segmentation By Geography
-
1. North America
- 1.1. United States
- 1.2. Canada
- 1.3. Mexico
-
2. South America
- 2.1. Brazil
- 2.2. Argentina
- 2.3. Rest of South America
-
3. Europe
- 3.1. United Kingdom
- 3.2. Germany
- 3.3. France
- 3.4. Russia
- 3.5. Spain
- 3.6. Rest of Europe
-
4. Middle East and Africa
- 4.1. Saudi Arabia
- 4.2. United Arab Emirates
- 4.3. Qatar
- 4.4. South Africa
- 4.5. Rest of Middle East and Africa
-
5. Asia Pacific
- 5.1. India
- 5.2. China
- 5.3. Singapore
- 5.4. Japan
- 5.5. South Korea
- 5.6. Vietnam
- 5.7. Australia
- 5.8. Rest of Asia Pacific
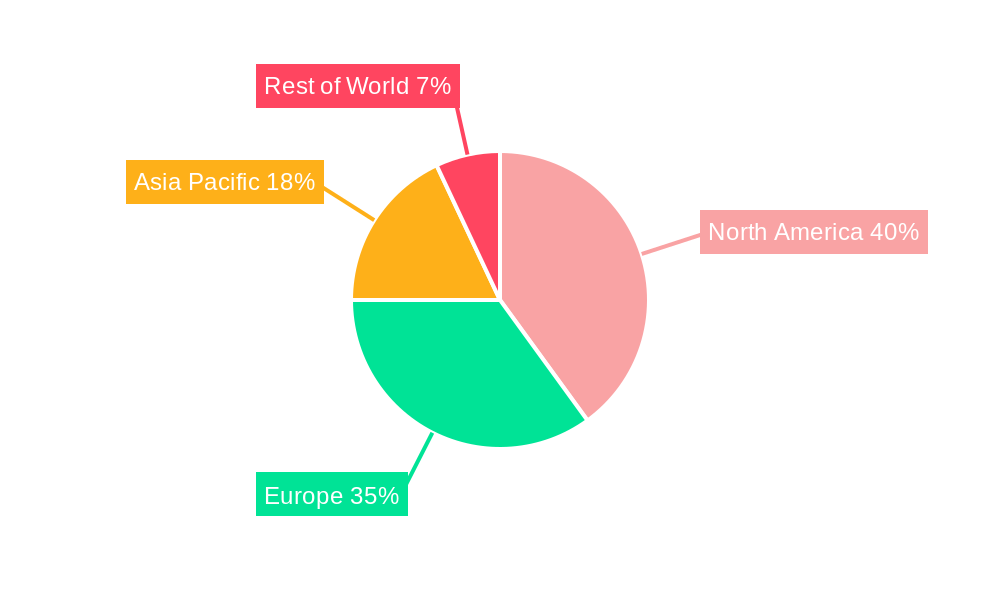
Pharmaceutical 3PL Market Regional Market Share
Geographic Coverage of Pharmaceutical 3PL Market
Pharmaceutical 3PL Market REPORT HIGHLIGHTS
| Aspects | Details |
|---|---|
| Study Period | 2020-2034 |
| Base Year | 2025 |
| Estimated Year | 2026 |
| Forecast Period | 2026-2034 |
| Historical Period | 2020-2025 |
| Growth Rate | CAGR of 6.62% from 2020-2034 |
| Segmentation |
|
Table of Contents
- 1. Introduction
- 1.1. Research Scope
- 1.2. Market Segmentation
- 1.3. Research Objective
- 1.4. Definitions and Assumptions
- 2. Executive Summary
- 2.1. Market Snapshot
- 3. Market Dynamics
- 3.1. Market Drivers
- 3.2. Market Restrains
- 3.3. Market Trends
- 3.4. Market Opportunities
- 4. Market Factor Analysis
- 4.1. Porters Five Forces
- 4.1.1. Bargaining Power of Suppliers
- 4.1.2. Bargaining Power of Buyers
- 4.1.3. Threat of New Entrants
- 4.1.4. Threat of Substitutes
- 4.1.5. Competitive Rivalry
- 4.2. PESTEL analysis
- 4.3. BCG Analysis
- 4.3.1. Stars (High Growth, High Market Share)
- 4.3.2. Cash Cows (Low Growth, High Market Share)
- 4.3.3. Question Mark (High Growth, Low Market Share)
- 4.3.4. Dogs (Low Growth, Low Market Share)
- 4.4. Ansoff Matrix Analysis
- 4.5. Supply Chain Analysis
- 4.6. Regulatory Landscape
- 4.7. Current Market Potential and Opportunity Assessment (TAM–SAM–SOM Framework)
- 4.8. TIR Analyst Note
- 4.1. Porters Five Forces
- 5. Market Analysis, Insights and Forecast 2021-2033
- 5.1. Market Analysis, Insights and Forecast - by Function
- 5.1.1. Domestic Transportation Management
- 5.1.2. International Transportation Management
- 5.1.3. Value-added Warehousing and Distribution
- 5.2. Market Analysis, Insights and Forecast - by Supply Chain
- 5.2.1. Cold Chain
- 5.2.2. Non-cold Chain
- 5.3. Market Analysis, Insights and Forecast - by Region
- 5.3.1. North America
- 5.3.2. South America
- 5.3.3. Europe
- 5.3.4. Middle East and Africa
- 5.3.5. Asia Pacific
- 5.1. Market Analysis, Insights and Forecast - by Function
- 6. Global Pharmaceutical 3PL Market Analysis, Insights and Forecast, 2021-2033
- 6.1. Market Analysis, Insights and Forecast - by Function
- 6.1.1. Domestic Transportation Management
- 6.1.2. International Transportation Management
- 6.1.3. Value-added Warehousing and Distribution
- 6.2. Market Analysis, Insights and Forecast - by Supply Chain
- 6.2.1. Cold Chain
- 6.2.2. Non-cold Chain
- 6.1. Market Analysis, Insights and Forecast - by Function
- 7. North America Pharmaceutical 3PL Market Analysis, Insights and Forecast, 2020-2032
- 7.1. Market Analysis, Insights and Forecast - by Function
- 7.1.1. Domestic Transportation Management
- 7.1.2. International Transportation Management
- 7.1.3. Value-added Warehousing and Distribution
- 7.2. Market Analysis, Insights and Forecast - by Supply Chain
- 7.2.1. Cold Chain
- 7.2.2. Non-cold Chain
- 7.1. Market Analysis, Insights and Forecast - by Function
- 8. South America Pharmaceutical 3PL Market Analysis, Insights and Forecast, 2020-2032
- 8.1. Market Analysis, Insights and Forecast - by Function
- 8.1.1. Domestic Transportation Management
- 8.1.2. International Transportation Management
- 8.1.3. Value-added Warehousing and Distribution
- 8.2. Market Analysis, Insights and Forecast - by Supply Chain
- 8.2.1. Cold Chain
- 8.2.2. Non-cold Chain
- 8.1. Market Analysis, Insights and Forecast - by Function
- 9. Europe Pharmaceutical 3PL Market Analysis, Insights and Forecast, 2020-2032
- 9.1. Market Analysis, Insights and Forecast - by Function
- 9.1.1. Domestic Transportation Management
- 9.1.2. International Transportation Management
- 9.1.3. Value-added Warehousing and Distribution
- 9.2. Market Analysis, Insights and Forecast - by Supply Chain
- 9.2.1. Cold Chain
- 9.2.2. Non-cold Chain
- 9.1. Market Analysis, Insights and Forecast - by Function
- 10. Middle East and Africa Pharmaceutical 3PL Market Analysis, Insights and Forecast, 2020-2032
- 10.1. Market Analysis, Insights and Forecast - by Function
- 10.1.1. Domestic Transportation Management
- 10.1.2. International Transportation Management
- 10.1.3. Value-added Warehousing and Distribution
- 10.2. Market Analysis, Insights and Forecast - by Supply Chain
- 10.2.1. Cold Chain
- 10.2.2. Non-cold Chain
- 10.1. Market Analysis, Insights and Forecast - by Function
- 11. Asia Pacific Pharmaceutical 3PL Market Analysis, Insights and Forecast, 2020-2032
- 11.1. Market Analysis, Insights and Forecast - by Function
- 11.1.1. Domestic Transportation Management
- 11.1.2. International Transportation Management
- 11.1.3. Value-added Warehousing and Distribution
- 11.2. Market Analysis, Insights and Forecast - by Supply Chain
- 11.2.1. Cold Chain
- 11.2.2. Non-cold Chain
- 11.1. Market Analysis, Insights and Forecast - by Function
- 12. Competitive Analysis
- 12.1. Company Profiles
- 12.1.1 XPO Logistics*List Not Exhaustive 7 3 Other Companies (Overview/Key Information
- 12.1.1.1. Company Overview
- 12.1.1.2. Products
- 12.1.1.3. Company Financials
- 12.1.1.4. SWOT Analysis
- 12.1.2 DB Schenker
- 12.1.2.1. Company Overview
- 12.1.2.2. Products
- 12.1.2.3. Company Financials
- 12.1.2.4. SWOT Analysis
- 12.1.3 DHL
- 12.1.3.1. Company Overview
- 12.1.3.2. Products
- 12.1.3.3. Company Financials
- 12.1.3.4. SWOT Analysis
- 12.1.4 Ceva Logistics
- 12.1.4.1. Company Overview
- 12.1.4.2. Products
- 12.1.4.3. Company Financials
- 12.1.4.4. SWOT Analysis
- 12.1.5 Nippon Express
- 12.1.5.1. Company Overview
- 12.1.5.2. Products
- 12.1.5.3. Company Financials
- 12.1.5.4. SWOT Analysis
- 12.1.6 UPS
- 12.1.6.1. Company Overview
- 12.1.6.2. Products
- 12.1.6.3. Company Financials
- 12.1.6.4. SWOT Analysis
- 12.1.7 FedEx
- 12.1.7.1. Company Overview
- 12.1.7.2. Products
- 12.1.7.3. Company Financials
- 12.1.7.4. SWOT Analysis
- 12.1.8 Kuehne + Nagel
- 12.1.8.1. Company Overview
- 12.1.8.2. Products
- 12.1.8.3. Company Financials
- 12.1.8.4. SWOT Analysis
- 12.1.9 Agility
- 12.1.9.1. Company Overview
- 12.1.9.2. Products
- 12.1.9.3. Company Financials
- 12.1.9.4. SWOT Analysis
- 12.1.10 Kerry Logistics
- 12.1.10.1. Company Overview
- 12.1.10.2. Products
- 12.1.10.3. Company Financials
- 12.1.10.4. SWOT Analysis
- 12.1.1 XPO Logistics*List Not Exhaustive 7 3 Other Companies (Overview/Key Information
- 12.2. Market Entropy
- 12.2.1 Company's Key Areas Served
- 12.2.2 Recent Developments
- 12.3. Company Market Share Analysis 2025
- 12.3.1 Top 5 Companies Market Share Analysis
- 12.3.2 Top 3 Companies Market Share Analysis
- 12.4. List of Potential Customers
- 13. Research Methodology
List of Figures
- Figure 1: Global Pharmaceutical 3PL Market Revenue Breakdown (billion, %) by Region 2025 & 2033
- Figure 2: North America Pharmaceutical 3PL Market Revenue (billion), by Function 2025 & 2033
- Figure 3: North America Pharmaceutical 3PL Market Revenue Share (%), by Function 2025 & 2033
- Figure 4: North America Pharmaceutical 3PL Market Revenue (billion), by Supply Chain 2025 & 2033
- Figure 5: North America Pharmaceutical 3PL Market Revenue Share (%), by Supply Chain 2025 & 2033
- Figure 6: North America Pharmaceutical 3PL Market Revenue (billion), by Country 2025 & 2033
- Figure 7: North America Pharmaceutical 3PL Market Revenue Share (%), by Country 2025 & 2033
- Figure 8: South America Pharmaceutical 3PL Market Revenue (billion), by Function 2025 & 2033
- Figure 9: South America Pharmaceutical 3PL Market Revenue Share (%), by Function 2025 & 2033
- Figure 10: South America Pharmaceutical 3PL Market Revenue (billion), by Supply Chain 2025 & 2033
- Figure 11: South America Pharmaceutical 3PL Market Revenue Share (%), by Supply Chain 2025 & 2033
- Figure 12: South America Pharmaceutical 3PL Market Revenue (billion), by Country 2025 & 2033
- Figure 13: South America Pharmaceutical 3PL Market Revenue Share (%), by Country 2025 & 2033
- Figure 14: Europe Pharmaceutical 3PL Market Revenue (billion), by Function 2025 & 2033
- Figure 15: Europe Pharmaceutical 3PL Market Revenue Share (%), by Function 2025 & 2033
- Figure 16: Europe Pharmaceutical 3PL Market Revenue (billion), by Supply Chain 2025 & 2033
- Figure 17: Europe Pharmaceutical 3PL Market Revenue Share (%), by Supply Chain 2025 & 2033
- Figure 18: Europe Pharmaceutical 3PL Market Revenue (billion), by Country 2025 & 2033
- Figure 19: Europe Pharmaceutical 3PL Market Revenue Share (%), by Country 2025 & 2033
- Figure 20: Middle East and Africa Pharmaceutical 3PL Market Revenue (billion), by Function 2025 & 2033
- Figure 21: Middle East and Africa Pharmaceutical 3PL Market Revenue Share (%), by Function 2025 & 2033
- Figure 22: Middle East and Africa Pharmaceutical 3PL Market Revenue (billion), by Supply Chain 2025 & 2033
- Figure 23: Middle East and Africa Pharmaceutical 3PL Market Revenue Share (%), by Supply Chain 2025 & 2033
- Figure 24: Middle East and Africa Pharmaceutical 3PL Market Revenue (billion), by Country 2025 & 2033
- Figure 25: Middle East and Africa Pharmaceutical 3PL Market Revenue Share (%), by Country 2025 & 2033
- Figure 26: Asia Pacific Pharmaceutical 3PL Market Revenue (billion), by Function 2025 & 2033
- Figure 27: Asia Pacific Pharmaceutical 3PL Market Revenue Share (%), by Function 2025 & 2033
- Figure 28: Asia Pacific Pharmaceutical 3PL Market Revenue (billion), by Supply Chain 2025 & 2033
- Figure 29: Asia Pacific Pharmaceutical 3PL Market Revenue Share (%), by Supply Chain 2025 & 2033
- Figure 30: Asia Pacific Pharmaceutical 3PL Market Revenue (billion), by Country 2025 & 2033
- Figure 31: Asia Pacific Pharmaceutical 3PL Market Revenue Share (%), by Country 2025 & 2033
List of Tables
- Table 1: Global Pharmaceutical 3PL Market Revenue billion Forecast, by Function 2020 & 2033
- Table 2: Global Pharmaceutical 3PL Market Revenue billion Forecast, by Supply Chain 2020 & 2033
- Table 3: Global Pharmaceutical 3PL Market Revenue billion Forecast, by Region 2020 & 2033
- Table 4: Global Pharmaceutical 3PL Market Revenue billion Forecast, by Function 2020 & 2033
- Table 5: Global Pharmaceutical 3PL Market Revenue billion Forecast, by Supply Chain 2020 & 2033
- Table 6: Global Pharmaceutical 3PL Market Revenue billion Forecast, by Country 2020 & 2033
- Table 7: United States Pharmaceutical 3PL Market Revenue (billion) Forecast, by Application 2020 & 2033
- Table 8: Canada Pharmaceutical 3PL Market Revenue (billion) Forecast, by Application 2020 & 2033
- Table 9: Mexico Pharmaceutical 3PL Market Revenue (billion) Forecast, by Application 2020 & 2033
- Table 10: Global Pharmaceutical 3PL Market Revenue billion Forecast, by Function 2020 & 2033
- Table 11: Global Pharmaceutical 3PL Market Revenue billion Forecast, by Supply Chain 2020 & 2033
- Table 12: Global Pharmaceutical 3PL Market Revenue billion Forecast, by Country 2020 & 2033
- Table 13: Brazil Pharmaceutical 3PL Market Revenue (billion) Forecast, by Application 2020 & 2033
- Table 14: Argentina Pharmaceutical 3PL Market Revenue (billion) Forecast, by Application 2020 & 2033
- Table 15: Rest of South America Pharmaceutical 3PL Market Revenue (billion) Forecast, by Application 2020 & 2033
- Table 16: Global Pharmaceutical 3PL Market Revenue billion Forecast, by Function 2020 & 2033
- Table 17: Global Pharmaceutical 3PL Market Revenue billion Forecast, by Supply Chain 2020 & 2033
- Table 18: Global Pharmaceutical 3PL Market Revenue billion Forecast, by Country 2020 & 2033
- Table 19: United Kingdom Pharmaceutical 3PL Market Revenue (billion) Forecast, by Application 2020 & 2033
- Table 20: Germany Pharmaceutical 3PL Market Revenue (billion) Forecast, by Application 2020 & 2033
- Table 21: France Pharmaceutical 3PL Market Revenue (billion) Forecast, by Application 2020 & 2033
- Table 22: Russia Pharmaceutical 3PL Market Revenue (billion) Forecast, by Application 2020 & 2033
- Table 23: Spain Pharmaceutical 3PL Market Revenue (billion) Forecast, by Application 2020 & 2033
- Table 24: Rest of Europe Pharmaceutical 3PL Market Revenue (billion) Forecast, by Application 2020 & 2033
- Table 25: Global Pharmaceutical 3PL Market Revenue billion Forecast, by Function 2020 & 2033
- Table 26: Global Pharmaceutical 3PL Market Revenue billion Forecast, by Supply Chain 2020 & 2033
- Table 27: Global Pharmaceutical 3PL Market Revenue billion Forecast, by Country 2020 & 2033
- Table 28: Saudi Arabia Pharmaceutical 3PL Market Revenue (billion) Forecast, by Application 2020 & 2033
- Table 29: United Arab Emirates Pharmaceutical 3PL Market Revenue (billion) Forecast, by Application 2020 & 2033
- Table 30: Qatar Pharmaceutical 3PL Market Revenue (billion) Forecast, by Application 2020 & 2033
- Table 31: South Africa Pharmaceutical 3PL Market Revenue (billion) Forecast, by Application 2020 & 2033
- Table 32: Rest of Middle East and Africa Pharmaceutical 3PL Market Revenue (billion) Forecast, by Application 2020 & 2033
- Table 33: Global Pharmaceutical 3PL Market Revenue billion Forecast, by Function 2020 & 2033
- Table 34: Global Pharmaceutical 3PL Market Revenue billion Forecast, by Supply Chain 2020 & 2033
- Table 35: Global Pharmaceutical 3PL Market Revenue billion Forecast, by Country 2020 & 2033
- Table 36: India Pharmaceutical 3PL Market Revenue (billion) Forecast, by Application 2020 & 2033
- Table 37: China Pharmaceutical 3PL Market Revenue (billion) Forecast, by Application 2020 & 2033
- Table 38: Singapore Pharmaceutical 3PL Market Revenue (billion) Forecast, by Application 2020 & 2033
- Table 39: Japan Pharmaceutical 3PL Market Revenue (billion) Forecast, by Application 2020 & 2033
- Table 40: South Korea Pharmaceutical 3PL Market Revenue (billion) Forecast, by Application 2020 & 2033
- Table 41: Vietnam Pharmaceutical 3PL Market Revenue (billion) Forecast, by Application 2020 & 2033
- Table 42: Australia Pharmaceutical 3PL Market Revenue (billion) Forecast, by Application 2020 & 2033
- Table 43: Rest of Asia Pacific Pharmaceutical 3PL Market Revenue (billion) Forecast, by Application 2020 & 2033
Frequently Asked Questions
1. What is the projected Compound Annual Growth Rate (CAGR) of the Pharmaceutical 3PL Market?
The projected CAGR is approximately 6.62%.
2. Which companies are prominent players in the Pharmaceutical 3PL Market?
Key companies in the market include XPO Logistics*List Not Exhaustive 7 3 Other Companies (Overview/Key Information, DB Schenker, DHL, Ceva Logistics, Nippon Express, UPS, FedEx, Kuehne + Nagel, Agility, Kerry Logistics.
3. What are the main segments of the Pharmaceutical 3PL Market?
The market segments include Function, Supply Chain.
4. Can you provide details about the market size?
The market size is estimated to be USD 143.44 billion as of 2022.
5. What are some drivers contributing to market growth?
Growing Demand for Over the Counter Drugs Across the European Region; Growing Manufacture Activity from Pharmaceutical Companies.
6. What are the notable trends driving market growth?
Growth in Demand During the Pandemic.
7. Are there any restraints impacting market growth?
High Cost Associated with the Transportation Ordered.
8. Can you provide examples of recent developments in the market?
N/A
9. What pricing options are available for accessing the report?
Pricing options include single-user, multi-user, and enterprise licenses priced at USD 4750, USD 5250, and USD 8750 respectively.
10. Is the market size provided in terms of value or volume?
The market size is provided in terms of value, measured in billion.
11. Are there any specific market keywords associated with the report?
Yes, the market keyword associated with the report is "Pharmaceutical 3PL Market," which aids in identifying and referencing the specific market segment covered.
12. How do I determine which pricing option suits my needs best?
The pricing options vary based on user requirements and access needs. Individual users may opt for single-user licenses, while businesses requiring broader access may choose multi-user or enterprise licenses for cost-effective access to the report.
13. Are there any additional resources or data provided in the Pharmaceutical 3PL Market report?
While the report offers comprehensive insights, it's advisable to review the specific contents or supplementary materials provided to ascertain if additional resources or data are available.
14. How can I stay updated on further developments or reports in the Pharmaceutical 3PL Market?
To stay informed about further developments, trends, and reports in the Pharmaceutical 3PL Market, consider subscribing to industry newsletters, following relevant companies and organizations, or regularly checking reputable industry news sources and publications.
Methodology
Step 1 - Identification of Relevant Samples Size from Population Database


Step 2 - Approaches for Defining Global Market Size (Value, Volume* & Price*)

Note*: In applicable scenarios
Step 3 - Data Sources
Primary Research
- Web Analytics
- Survey Reports
- Research Institute
- Latest Research Reports
- Opinion Leaders
Secondary Research
- Annual Reports
- White Paper
- Latest Press Release
- Industry Association
- Paid Database
- Investor Presentations

Step 4 - Data Triangulation
Involves using different sources of information in order to increase the validity of a study
These sources are likely to be stakeholders in a program - participants, other researchers, program staff, other community members, and so on.
Then we put all data in single framework & apply various statistical tools to find out the dynamic on the market.
During the analysis stage, feedback from the stakeholder groups would be compared to determine areas of agreement as well as areas of divergence