

Key Insights
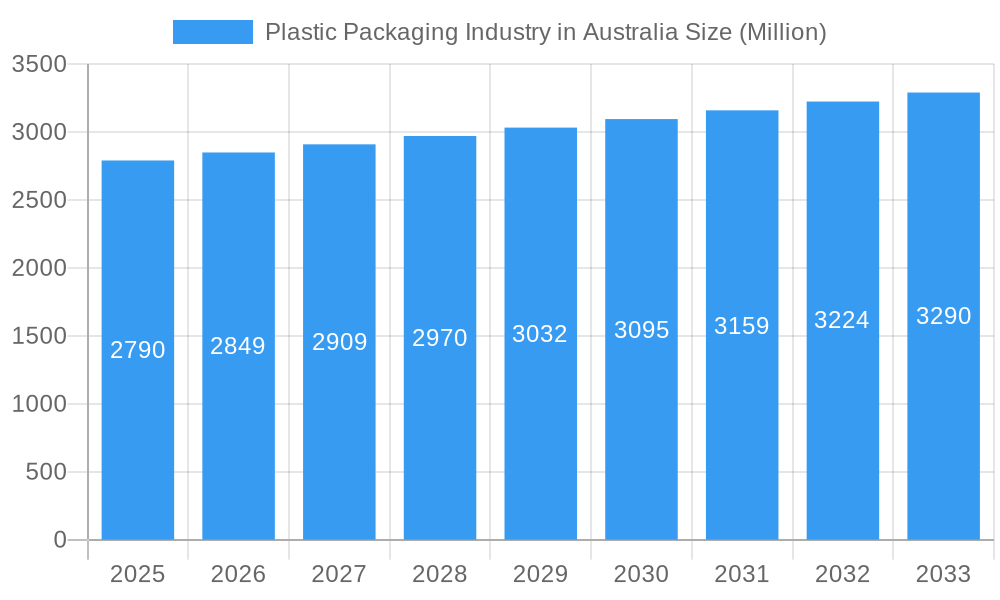
The Australian plastic packaging market is poised for steady growth, projected to reach approximately AUD 2.79 billion by 2025. While the compound annual growth rate (CAGR) of 2.14% over the forecast period (2025-2033) indicates a mature market, this expansion is driven by consistent demand across key end-user industries. The food and beverage sectors continue to be dominant consumers of plastic packaging, leveraging its versatility, cost-effectiveness, and protective qualities for a wide range of products, from fresh produce to processed goods and beverages. The healthcare industry also presents a significant growth avenue, driven by the need for sterile, safe, and reliable packaging for pharmaceuticals, medical devices, and diagnostic kits. Furthermore, the personal care and household product segments contribute to sustained demand for various plastic packaging formats, including bottles, jars, pouches, and films. The market's resilience is further bolstered by the ongoing innovation in material science and packaging design, with a growing emphasis on lightweighting, enhanced barrier properties, and improved functionality to meet evolving consumer preferences and regulatory requirements.
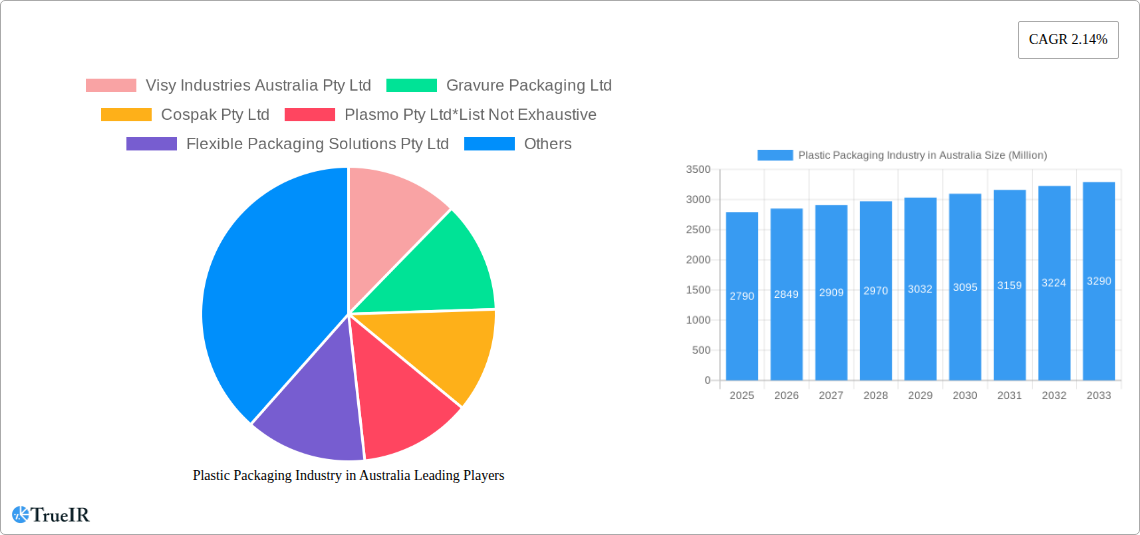
Plastic Packaging Industry in Australia Market Size (In Billion)
The market's structure is defined by a dichotomy between rigid and flexible packaging solutions, each catering to distinct product needs and applications. Rigid packaging, including bottles, jars, and trays, continues to be essential for products requiring robust structural integrity and protection, with Polyethylene Terephthalate (PET) and Polypropylene (PP) remaining dominant materials due to their excellent clarity, strength, and recyclability. Flexible packaging, encompassing pouches, bags, and films, is experiencing robust growth owing to its lightweight nature, reduced material usage, and superior barrier properties, making it ideal for snacks, confectionery, and frozen foods. Polyethene (PE) and Bi-orientated Polypropylene (BOPP) are key materials in this segment. Key industry players like Pact Group Holdings Australia Pty Ltd, Visy Industries Australia Pty Ltd, and Orora Packaging Australia Pty Ltd are instrumental in shaping this landscape through strategic investments in advanced manufacturing technologies and a focus on sustainable packaging solutions. The competitive environment is characterized by consolidation and a drive towards circular economy principles, including increased use of recycled content and the development of more readily recyclable materials.
Plastic Packaging Industry in Australia Company Market Share
Australia Plastic Packaging Market Analysis: Volume, Trends, and Future Outlook (2019-2033)
This comprehensive report delves into the dynamic Plastic Packaging Industry in Australia, providing an in-depth market analysis from 2019 to 2033. With a robust focus on high-volume SEO keywords such as "Australian plastic packaging," "flexible packaging Australia," "rigid packaging market," "PET packaging," "food packaging Australia," and "sustainable packaging trends," this report is designed to engage industry professionals, investors, and policymakers. We provide critical insights into market structure, competitive landscape, evolving trends, dominant segments, product innovations, key drivers, barriers, challenges, and the future outlook for the Australian plastic packaging sector. Our analysis includes meticulously quantified data, projecting a market size reaching xx Million AUD by the Base Year 2025, with an anticipated Compound Annual Growth Rate (CAGR) of xx% during the Forecast Period 2025–2033.
Plastic Packaging Industry in Australia Market Structure & Competitive Landscape
The Australian plastic packaging market exhibits a moderately concentrated structure, with a few dominant players holding significant market share, while a long tail of smaller enterprises caters to niche segments. Innovation is primarily driven by the pursuit of enhanced functionality, cost-effectiveness, and, increasingly, sustainability. Regulatory impacts, particularly those related to plastic waste reduction and circular economy initiatives, are increasingly shaping market dynamics and influencing investment decisions. Product substitutes, such as paper and glass packaging, pose a competitive threat, especially in environmentally conscious consumer segments. The end-user segmentation is broad, with the food and beverage sectors representing the largest consumers of plastic packaging solutions. Mergers and acquisitions (M&A) activity is a notable trend, as larger companies seek to consolidate market presence, acquire new technologies, and expand their product portfolios. For instance, the past five years have witnessed xx M&A transactions valued at an estimated xx Million AUD, indicating a strategic consolidation phase. Concentration ratios suggest that the top 5 companies account for approximately xx% of the market revenue, highlighting the influence of key players in driving industry advancements and setting market standards.
Plastic Packaging Industry in Australia Market Trends & Opportunities
The Australian plastic packaging market is experiencing substantial growth, projected to reach xx Million AUD by the Base Year 2025. This expansion is fueled by escalating demand from diverse end-user industries and a growing consumer preference for convenient and protective packaging solutions. The market size has seen a steady increase, with a historical growth rate of xx% from 2019 to 2024. Technological advancements are a key driver, with continuous innovation in material science, processing technologies, and packaging design enhancing product performance and expanding application possibilities. The adoption of advanced extrusion, injection molding, and blow molding techniques allows for the production of lighter, stronger, and more sustainable packaging. Consumer preferences are evolving, with a pronounced shift towards convenience, product safety, and a growing awareness of environmental impact. This is creating significant opportunities for manufacturers offering recyclable, compostable, and post-consumer recycled (PCR) content packaging. Competitive dynamics are intensifying, leading to a focus on value-added products, customized solutions, and strategic partnerships. The market penetration rate for innovative sustainable packaging solutions is currently at xx%, indicating substantial room for future growth and adoption. The increasing focus on the circular economy presents a significant opportunity for companies investing in advanced recycling technologies and developing packaging designs that facilitate easier material recovery and reprocessing. The rise of e-commerce also necessitates robust and protective packaging, creating demand for specialized solutions.
Dominant Markets & Segments in Plastic Packaging Industry in Australia
The Australian plastic packaging market is broadly categorized into Rigid Packaging, Flexible Packaging, and the Industrial Plastic Film Market. Within Rigid Packaging, Polyethylene Terephthalate (PET) remains a dominant material due to its excellent barrier properties, clarity, and recyclability, particularly for Bottles and Jars used extensively in the beverage and food industries. Polypropylene (PP) is also a significant material, finding applications in Trays and Containers for dairy products, deli items, and prepared meals. Flexible Packaging, a rapidly growing segment, is largely dominated by Polyethene (PE) and Bi-orientated Polypropylene (BOPP) materials, extensively used for Pouches and Bags in the food sector. Films and Wraps, also crucial in flexible packaging, cater to a wide range of applications from fresh produce to confectionery. The Industrial Plastic Film Market is a vital contributor, with Stretch Film being a key product for pallet stabilization in logistics and Agricultural Film supporting the agricultural sector.
- Rigid Packaging:
- Materials: Polyethylene Terephthalate (PET) dominates, followed by Polypropylene (PP) and Polyethylene (PE).
- Products: Bottles and Jars are the largest product category, with Trays and Containers also holding substantial market share.
- Growth Drivers: Demand from the food and beverage industry, convenience packaging trends, and the recyclability of PET.
- Flexible Packaging:
- Materials: Polythene (PE) and Bi-orientated Polypropylene (BOPP) are the leading materials.
- Products: Pouches and Bags are experiencing strong growth, alongside Films and Wraps.
- Growth Drivers: Lightweighting, enhanced barrier properties, cost-effectiveness, and suitability for e-commerce and single-serve formats.
- Industrial Plastic Film Market:
- Products: Stretch Film is critical for logistics and supply chain efficiency. Agricultural Film plays a vital role in modern farming practices.
- Growth Drivers: Growth in manufacturing and logistics sectors, increased adoption of advanced agricultural techniques.
- End-user Industry:
- The Food and Beverage industries are the largest end-users, accounting for approximately xx% and xx% of the market demand respectively.
- The Healthcare and Personal Care and Household sectors represent significant and growing segments, driven by the need for sterile and safe packaging.
Plastic Packaging Industry in Australia Product Analysis
Australian plastic packaging product innovation is largely driven by sustainability, functionality, and cost-efficiency. Key advancements include the development of lighter-weight films with enhanced barrier properties, reducing material usage while preserving product freshness and extending shelf life. The introduction of multi-layer flexible packaging solutions incorporating recycled content and mono-material designs facilitates easier recyclability, aligning with circular economy principles. Rigid packaging is seeing innovation in PET and PP-based containers designed for improved stackability, tamper-evidence, and microwaveability. The development of specialized industrial films, such as high-strength stretch films and UV-resistant agricultural films, addresses specific industry needs. These product innovations offer competitive advantages by meeting evolving consumer demand for convenience, safety, and environmental responsibility, while also optimizing logistics and reducing waste throughout the supply chain.
Key Drivers, Barriers & Challenges in Plastic Packaging Industry in Australia
Key Drivers: The Australian plastic packaging industry is propelled by several key drivers. Technological innovation, including advancements in material science and processing, enables the creation of more efficient and sustainable packaging solutions. Economic growth, particularly in the food, beverage, and healthcare sectors, directly translates to increased demand for packaging. Government policies and initiatives promoting recycling, waste reduction, and the circular economy encourage investment in sustainable packaging alternatives. Furthermore, evolving consumer preferences for convenience, product safety, and environmentally friendly options are significant growth catalysts.
Barriers & Challenges: Despite robust growth, the industry faces significant barriers and challenges. Regulatory complexities and evolving waste management policies can create compliance hurdles and increase operational costs. Supply chain disruptions, as seen globally, can impact raw material availability and pricing. Intense competitive pressures from both domestic and international players, coupled with the rising cost of virgin polymers, pose ongoing challenges. The public perception and debate surrounding plastic waste also necessitate continuous efforts towards innovation in recyclability and end-of-life solutions, with an estimated xx% of consumers actively seeking out sustainable packaging options.
Growth Drivers in the Plastic Packaging Industry in Australia Market
Key growth drivers in the Australian plastic packaging market are multifaceted. Technologically, the ongoing development of advanced polymer formulations and manufacturing processes, such as additive manufacturing and intelligent packaging, is unlocking new functionalities and efficiencies. Economically, sustained growth in the food & beverage, healthcare, and personal care sectors, coupled with an expanding e-commerce landscape, directly fuels packaging demand. Regulatory tailwinds, including government mandates for increased recycled content and extended producer responsibility schemes, are accelerating the transition towards more sustainable packaging solutions, encouraging investment in circular economy initiatives.
Challenges Impacting Plastic Packaging Industry in Australia Growth
Challenges impacting the Australian plastic packaging industry are substantial. Regulatory complexities, including varying state-level policies on plastic waste and recycling, create an uneven playing field and can lead to increased compliance costs. Supply chain vulnerabilities, particularly concerning the availability and price volatility of key raw materials like polymers, can disrupt production and impact profitability. Competitive pressures from alternative packaging materials and established global players necessitate continuous innovation and cost optimization. Furthermore, the ongoing public discourse and demand for plastic reduction place pressure on manufacturers to demonstrate tangible progress in recyclability and the adoption of circular economy principles.
Key Players Shaping the Plastic Packaging Industry in Australia Market
- Visy Industries Australia Pty Ltd
- Gravure Packaging Ltd
- Cospak Pty Ltd
- Plasmo Pty Ltd
- Flexible Packaging Solutions Pty Ltd
- Orora Packaging Australia Pty Ltd
- A&M Packaging Pty Ltd
- Pact Group Holdings Australia Pty Ltd
- Caspak Products Pty Ltd
- Synergy Packaging (RPC Group)
- Pro-Pac Packaging Pty Ltd
- Filton Packaging Pty Ltd
- Econopak Flexible Packaging
- Vacupack Pty Ltd
Significant Plastic Packaging Industry in Australia Industry Milestones
- October 2022: Mondelez Australia promotes recycled soft plastic packaging to meet its goals for 2025, emphasizing the need for increased recyclability rather than viewing soft plastic as an adversary for achieving national targets.
- July 2022: Nestlé Australia's KitKat brand pioneers the first chocolate bar wrapper in Australia made with recycled plastic. Over 40 million 45g bars will feature a wrapper with 30% recycled material, reducing virgin plastic usage by approximately 250,000 m2.
- February 2022: Cadbury Australia announces a breakthrough in recycled packaging at the Federal Government's National Plastics Summit, committing to purchase recycled plastic packaging for 50 million family blocks of chocolate.
Future Outlook for Plastic Packaging Industry in Australia Market
The future outlook for the Australian plastic packaging industry is characterized by a strong emphasis on sustainability and innovation. Growth will be primarily driven by the increasing demand for recyclable, compostable, and bio-based packaging solutions, fueled by evolving consumer preferences and stringent environmental regulations. Significant opportunities lie in the development and adoption of advanced recycling technologies, including chemical recycling, and the expansion of infrastructure to support a circular economy. The industry will witness continued investment in lightweighting technologies, smart packaging solutions offering enhanced traceability and consumer engagement, and the integration of post-consumer recycled content across a wider range of applications. Strategic collaborations between manufacturers, brand owners, and waste management companies will be crucial in navigating the complexities of plastic waste reduction and achieving ambitious sustainability targets.
Plastic Packaging Industry in Australia Segmentation
-
1. Rigid Packaging
-
1.1. Material
- 1.1.1. Polyethylene Terephthalate (PET)
- 1.1.2. Polypropylene (PP)
- 1.1.3. Polystyrene (PS) and Expanded Polystyrene (EPS)
- 1.1.4. Polyvinyl Chloride (PVC)
- 1.1.5. Polyethene (PE)
-
1.2. Product
- 1.2.1. Bottles and Jars
- 1.2.2. Trays and Containers
- 1.2.3. Other Product Types
-
1.1. Material
-
2. Flexible Packaging
-
2.1. Material
- 2.1.1. Polyethene (PE)
- 2.1.2. Bi-orientated Polypropylene (BOPP)
- 2.1.3. Cast Polypropylene (CPP)
- 2.1.4. Polyvinyl Chloride (PVC)
- 2.1.5. Other Flexible Packaging Materials
-
2.2. Product
- 2.2.1. Pouches
- 2.2.2. Bags
- 2.2.3. Films and Wraps
- 2.2.4. Other Product Types
-
2.1. Material
-
3. Industrial Plastic Film Market
- 3.1. Stretch Film
- 3.2. Agricultural Film
-
4. End-user Industry
- 4.1. Food
- 4.2. Beverage
- 4.3. Healthcare
- 4.4. Personal Care and Household
- 4.5. Other End-user Industries
Plastic Packaging Industry in Australia Segmentation By Geography
-
1. North America
- 1.1. United States
- 1.2. Canada
- 1.3. Mexico
-
2. South America
- 2.1. Brazil
- 2.2. Argentina
- 2.3. Rest of South America
-
3. Europe
- 3.1. United Kingdom
- 3.2. Germany
- 3.3. France
- 3.4. Italy
- 3.5. Spain
- 3.6. Russia
- 3.7. Benelux
- 3.8. Nordics
- 3.9. Rest of Europe
-
4. Middle East & Africa
- 4.1. Turkey
- 4.2. Israel
- 4.3. GCC
- 4.4. North Africa
- 4.5. South Africa
- 4.6. Rest of Middle East & Africa
-
5. Asia Pacific
- 5.1. China
- 5.2. India
- 5.3. Japan
- 5.4. South Korea
- 5.5. ASEAN
- 5.6. Oceania
- 5.7. Rest of Asia Pacific
Plastic Packaging Industry in Australia Regional Market Share
Geographic Coverage of Plastic Packaging Industry in Australia
Plastic Packaging Industry in Australia REPORT HIGHLIGHTS
| Aspects | Details |
|---|---|
| Study Period | 2020-2034 |
| Base Year | 2025 |
| Estimated Year | 2026 |
| Forecast Period | 2026-2034 |
| Historical Period | 2020-2025 |
| Growth Rate | CAGR of 2.14% from 2020-2034 |
| Segmentation |
|
Table of Contents
- 1. Introduction
- 1.1. Research Scope
- 1.2. Market Segmentation
- 1.3. Research Objective
- 1.4. Definitions and Assumptions
- 2. Executive Summary
- 2.1. Market Snapshot
- 3. Market Dynamics
- 3.1. Market Drivers
- 3.2. Market Restrains
- 3.3. Market Trends
- 3.4. Market Opportunities
- 4. Market Factor Analysis
- 4.1. Porters Five Forces
- 4.1.1. Bargaining Power of Suppliers
- 4.1.2. Bargaining Power of Buyers
- 4.1.3. Threat of New Entrants
- 4.1.4. Threat of Substitutes
- 4.1.5. Competitive Rivalry
- 4.2. PESTEL analysis
- 4.3. BCG Analysis
- 4.3.1. Stars (High Growth, High Market Share)
- 4.3.2. Cash Cows (Low Growth, High Market Share)
- 4.3.3. Question Mark (High Growth, Low Market Share)
- 4.3.4. Dogs (Low Growth, Low Market Share)
- 4.4. Ansoff Matrix Analysis
- 4.5. Supply Chain Analysis
- 4.6. Regulatory Landscape
- 4.7. Current Market Potential and Opportunity Assessment (TAM–SAM–SOM Framework)
- 4.8. TIR Analyst Note
- 4.1. Porters Five Forces
- 5. Market Analysis, Insights and Forecast 2021-2033
- 5.1. Market Analysis, Insights and Forecast - by Rigid Packaging
- 5.1.1. Material
- 5.1.1.1. Polyethylene Terephthalate (PET)
- 5.1.1.2. Polypropylene (PP)
- 5.1.1.3. Polystyrene (PS) and Expanded Polystyrene (EPS)
- 5.1.1.4. Polyvinyl Chloride (PVC)
- 5.1.1.5. Polyethene (PE)
- 5.1.2. Product
- 5.1.2.1. Bottles and Jars
- 5.1.2.2. Trays and Containers
- 5.1.2.3. Other Product Types
- 5.1.1. Material
- 5.2. Market Analysis, Insights and Forecast - by Flexible Packaging
- 5.2.1. Material
- 5.2.1.1. Polyethene (PE)
- 5.2.1.2. Bi-orientated Polypropylene (BOPP)
- 5.2.1.3. Cast Polypropylene (CPP)
- 5.2.1.4. Polyvinyl Chloride (PVC)
- 5.2.1.5. Other Flexible Packaging Materials
- 5.2.2. Product
- 5.2.2.1. Pouches
- 5.2.2.2. Bags
- 5.2.2.3. Films and Wraps
- 5.2.2.4. Other Product Types
- 5.2.1. Material
- 5.3. Market Analysis, Insights and Forecast - by Industrial Plastic Film Market
- 5.3.1. Stretch Film
- 5.3.2. Agricultural Film
- 5.4. Market Analysis, Insights and Forecast - by End-user Industry
- 5.4.1. Food
- 5.4.2. Beverage
- 5.4.3. Healthcare
- 5.4.4. Personal Care and Household
- 5.4.5. Other End-user Industries
- 5.5. Market Analysis, Insights and Forecast - by Region
- 5.5.1. North America
- 5.5.2. South America
- 5.5.3. Europe
- 5.5.4. Middle East & Africa
- 5.5.5. Asia Pacific
- 5.1. Market Analysis, Insights and Forecast - by Rigid Packaging
- 6. Global Plastic Packaging Industry in Australia Analysis, Insights and Forecast, 2021-2033
- 6.1. Market Analysis, Insights and Forecast - by Rigid Packaging
- 6.1.1. Material
- 6.1.1.1. Polyethylene Terephthalate (PET)
- 6.1.1.2. Polypropylene (PP)
- 6.1.1.3. Polystyrene (PS) and Expanded Polystyrene (EPS)
- 6.1.1.4. Polyvinyl Chloride (PVC)
- 6.1.1.5. Polyethene (PE)
- 6.1.2. Product
- 6.1.2.1. Bottles and Jars
- 6.1.2.2. Trays and Containers
- 6.1.2.3. Other Product Types
- 6.1.1. Material
- 6.2. Market Analysis, Insights and Forecast - by Flexible Packaging
- 6.2.1. Material
- 6.2.1.1. Polyethene (PE)
- 6.2.1.2. Bi-orientated Polypropylene (BOPP)
- 6.2.1.3. Cast Polypropylene (CPP)
- 6.2.1.4. Polyvinyl Chloride (PVC)
- 6.2.1.5. Other Flexible Packaging Materials
- 6.2.2. Product
- 6.2.2.1. Pouches
- 6.2.2.2. Bags
- 6.2.2.3. Films and Wraps
- 6.2.2.4. Other Product Types
- 6.2.1. Material
- 6.3. Market Analysis, Insights and Forecast - by Industrial Plastic Film Market
- 6.3.1. Stretch Film
- 6.3.2. Agricultural Film
- 6.4. Market Analysis, Insights and Forecast - by End-user Industry
- 6.4.1. Food
- 6.4.2. Beverage
- 6.4.3. Healthcare
- 6.4.4. Personal Care and Household
- 6.4.5. Other End-user Industries
- 6.1. Market Analysis, Insights and Forecast - by Rigid Packaging
- 7. North America Plastic Packaging Industry in Australia Analysis, Insights and Forecast, 2020-2032
- 7.1. Market Analysis, Insights and Forecast - by Rigid Packaging
- 7.1.1. Material
- 7.1.1.1. Polyethylene Terephthalate (PET)
- 7.1.1.2. Polypropylene (PP)
- 7.1.1.3. Polystyrene (PS) and Expanded Polystyrene (EPS)
- 7.1.1.4. Polyvinyl Chloride (PVC)
- 7.1.1.5. Polyethene (PE)
- 7.1.2. Product
- 7.1.2.1. Bottles and Jars
- 7.1.2.2. Trays and Containers
- 7.1.2.3. Other Product Types
- 7.1.1. Material
- 7.2. Market Analysis, Insights and Forecast - by Flexible Packaging
- 7.2.1. Material
- 7.2.1.1. Polyethene (PE)
- 7.2.1.2. Bi-orientated Polypropylene (BOPP)
- 7.2.1.3. Cast Polypropylene (CPP)
- 7.2.1.4. Polyvinyl Chloride (PVC)
- 7.2.1.5. Other Flexible Packaging Materials
- 7.2.2. Product
- 7.2.2.1. Pouches
- 7.2.2.2. Bags
- 7.2.2.3. Films and Wraps
- 7.2.2.4. Other Product Types
- 7.2.1. Material
- 7.3. Market Analysis, Insights and Forecast - by Industrial Plastic Film Market
- 7.3.1. Stretch Film
- 7.3.2. Agricultural Film
- 7.4. Market Analysis, Insights and Forecast - by End-user Industry
- 7.4.1. Food
- 7.4.2. Beverage
- 7.4.3. Healthcare
- 7.4.4. Personal Care and Household
- 7.4.5. Other End-user Industries
- 7.1. Market Analysis, Insights and Forecast - by Rigid Packaging
- 8. South America Plastic Packaging Industry in Australia Analysis, Insights and Forecast, 2020-2032
- 8.1. Market Analysis, Insights and Forecast - by Rigid Packaging
- 8.1.1. Material
- 8.1.1.1. Polyethylene Terephthalate (PET)
- 8.1.1.2. Polypropylene (PP)
- 8.1.1.3. Polystyrene (PS) and Expanded Polystyrene (EPS)
- 8.1.1.4. Polyvinyl Chloride (PVC)
- 8.1.1.5. Polyethene (PE)
- 8.1.2. Product
- 8.1.2.1. Bottles and Jars
- 8.1.2.2. Trays and Containers
- 8.1.2.3. Other Product Types
- 8.1.1. Material
- 8.2. Market Analysis, Insights and Forecast - by Flexible Packaging
- 8.2.1. Material
- 8.2.1.1. Polyethene (PE)
- 8.2.1.2. Bi-orientated Polypropylene (BOPP)
- 8.2.1.3. Cast Polypropylene (CPP)
- 8.2.1.4. Polyvinyl Chloride (PVC)
- 8.2.1.5. Other Flexible Packaging Materials
- 8.2.2. Product
- 8.2.2.1. Pouches
- 8.2.2.2. Bags
- 8.2.2.3. Films and Wraps
- 8.2.2.4. Other Product Types
- 8.2.1. Material
- 8.3. Market Analysis, Insights and Forecast - by Industrial Plastic Film Market
- 8.3.1. Stretch Film
- 8.3.2. Agricultural Film
- 8.4. Market Analysis, Insights and Forecast - by End-user Industry
- 8.4.1. Food
- 8.4.2. Beverage
- 8.4.3. Healthcare
- 8.4.4. Personal Care and Household
- 8.4.5. Other End-user Industries
- 8.1. Market Analysis, Insights and Forecast - by Rigid Packaging
- 9. Europe Plastic Packaging Industry in Australia Analysis, Insights and Forecast, 2020-2032
- 9.1. Market Analysis, Insights and Forecast - by Rigid Packaging
- 9.1.1. Material
- 9.1.1.1. Polyethylene Terephthalate (PET)
- 9.1.1.2. Polypropylene (PP)
- 9.1.1.3. Polystyrene (PS) and Expanded Polystyrene (EPS)
- 9.1.1.4. Polyvinyl Chloride (PVC)
- 9.1.1.5. Polyethene (PE)
- 9.1.2. Product
- 9.1.2.1. Bottles and Jars
- 9.1.2.2. Trays and Containers
- 9.1.2.3. Other Product Types
- 9.1.1. Material
- 9.2. Market Analysis, Insights and Forecast - by Flexible Packaging
- 9.2.1. Material
- 9.2.1.1. Polyethene (PE)
- 9.2.1.2. Bi-orientated Polypropylene (BOPP)
- 9.2.1.3. Cast Polypropylene (CPP)
- 9.2.1.4. Polyvinyl Chloride (PVC)
- 9.2.1.5. Other Flexible Packaging Materials
- 9.2.2. Product
- 9.2.2.1. Pouches
- 9.2.2.2. Bags
- 9.2.2.3. Films and Wraps
- 9.2.2.4. Other Product Types
- 9.2.1. Material
- 9.3. Market Analysis, Insights and Forecast - by Industrial Plastic Film Market
- 9.3.1. Stretch Film
- 9.3.2. Agricultural Film
- 9.4. Market Analysis, Insights and Forecast - by End-user Industry
- 9.4.1. Food
- 9.4.2. Beverage
- 9.4.3. Healthcare
- 9.4.4. Personal Care and Household
- 9.4.5. Other End-user Industries
- 9.1. Market Analysis, Insights and Forecast - by Rigid Packaging
- 10. Middle East & Africa Plastic Packaging Industry in Australia Analysis, Insights and Forecast, 2020-2032
- 10.1. Market Analysis, Insights and Forecast - by Rigid Packaging
- 10.1.1. Material
- 10.1.1.1. Polyethylene Terephthalate (PET)
- 10.1.1.2. Polypropylene (PP)
- 10.1.1.3. Polystyrene (PS) and Expanded Polystyrene (EPS)
- 10.1.1.4. Polyvinyl Chloride (PVC)
- 10.1.1.5. Polyethene (PE)
- 10.1.2. Product
- 10.1.2.1. Bottles and Jars
- 10.1.2.2. Trays and Containers
- 10.1.2.3. Other Product Types
- 10.1.1. Material
- 10.2. Market Analysis, Insights and Forecast - by Flexible Packaging
- 10.2.1. Material
- 10.2.1.1. Polyethene (PE)
- 10.2.1.2. Bi-orientated Polypropylene (BOPP)
- 10.2.1.3. Cast Polypropylene (CPP)
- 10.2.1.4. Polyvinyl Chloride (PVC)
- 10.2.1.5. Other Flexible Packaging Materials
- 10.2.2. Product
- 10.2.2.1. Pouches
- 10.2.2.2. Bags
- 10.2.2.3. Films and Wraps
- 10.2.2.4. Other Product Types
- 10.2.1. Material
- 10.3. Market Analysis, Insights and Forecast - by Industrial Plastic Film Market
- 10.3.1. Stretch Film
- 10.3.2. Agricultural Film
- 10.4. Market Analysis, Insights and Forecast - by End-user Industry
- 10.4.1. Food
- 10.4.2. Beverage
- 10.4.3. Healthcare
- 10.4.4. Personal Care and Household
- 10.4.5. Other End-user Industries
- 10.1. Market Analysis, Insights and Forecast - by Rigid Packaging
- 11. Asia Pacific Plastic Packaging Industry in Australia Analysis, Insights and Forecast, 2020-2032
- 11.1. Market Analysis, Insights and Forecast - by Rigid Packaging
- 11.1.1. Material
- 11.1.1.1. Polyethylene Terephthalate (PET)
- 11.1.1.2. Polypropylene (PP)
- 11.1.1.3. Polystyrene (PS) and Expanded Polystyrene (EPS)
- 11.1.1.4. Polyvinyl Chloride (PVC)
- 11.1.1.5. Polyethene (PE)
- 11.1.2. Product
- 11.1.2.1. Bottles and Jars
- 11.1.2.2. Trays and Containers
- 11.1.2.3. Other Product Types
- 11.1.1. Material
- 11.2. Market Analysis, Insights and Forecast - by Flexible Packaging
- 11.2.1. Material
- 11.2.1.1. Polyethene (PE)
- 11.2.1.2. Bi-orientated Polypropylene (BOPP)
- 11.2.1.3. Cast Polypropylene (CPP)
- 11.2.1.4. Polyvinyl Chloride (PVC)
- 11.2.1.5. Other Flexible Packaging Materials
- 11.2.2. Product
- 11.2.2.1. Pouches
- 11.2.2.2. Bags
- 11.2.2.3. Films and Wraps
- 11.2.2.4. Other Product Types
- 11.2.1. Material
- 11.3. Market Analysis, Insights and Forecast - by Industrial Plastic Film Market
- 11.3.1. Stretch Film
- 11.3.2. Agricultural Film
- 11.4. Market Analysis, Insights and Forecast - by End-user Industry
- 11.4.1. Food
- 11.4.2. Beverage
- 11.4.3. Healthcare
- 11.4.4. Personal Care and Household
- 11.4.5. Other End-user Industries
- 11.1. Market Analysis, Insights and Forecast - by Rigid Packaging
- 12. Competitive Analysis
- 12.1. Company Profiles
- 12.1.1 Visy Industries Australia Pty Ltd
- 12.1.1.1. Company Overview
- 12.1.1.2. Products
- 12.1.1.3. Company Financials
- 12.1.1.4. SWOT Analysis
- 12.1.2 Gravure Packaging Ltd
- 12.1.2.1. Company Overview
- 12.1.2.2. Products
- 12.1.2.3. Company Financials
- 12.1.2.4. SWOT Analysis
- 12.1.3 Cospak Pty Ltd
- 12.1.3.1. Company Overview
- 12.1.3.2. Products
- 12.1.3.3. Company Financials
- 12.1.3.4. SWOT Analysis
- 12.1.4 Plasmo Pty Ltd*List Not Exhaustive
- 12.1.4.1. Company Overview
- 12.1.4.2. Products
- 12.1.4.3. Company Financials
- 12.1.4.4. SWOT Analysis
- 12.1.5 Flexible Packaging Solutions Pty Ltd
- 12.1.5.1. Company Overview
- 12.1.5.2. Products
- 12.1.5.3. Company Financials
- 12.1.5.4. SWOT Analysis
- 12.1.6 Orora Packaging Australia Pty Ltd
- 12.1.6.1. Company Overview
- 12.1.6.2. Products
- 12.1.6.3. Company Financials
- 12.1.6.4. SWOT Analysis
- 12.1.7 A&M Packaging Pty Ltd
- 12.1.7.1. Company Overview
- 12.1.7.2. Products
- 12.1.7.3. Company Financials
- 12.1.7.4. SWOT Analysis
- 12.1.8 Pact Group Holdings Australia Pty Ltd
- 12.1.8.1. Company Overview
- 12.1.8.2. Products
- 12.1.8.3. Company Financials
- 12.1.8.4. SWOT Analysis
- 12.1.9 Caspak Products Pty Ltd
- 12.1.9.1. Company Overview
- 12.1.9.2. Products
- 12.1.9.3. Company Financials
- 12.1.9.4. SWOT Analysis
- 12.1.10 Synergy Packaging (RPC Group)
- 12.1.10.1. Company Overview
- 12.1.10.2. Products
- 12.1.10.3. Company Financials
- 12.1.10.4. SWOT Analysis
- 12.1.11 Pro-Pac Packaging Pty Ltd
- 12.1.11.1. Company Overview
- 12.1.11.2. Products
- 12.1.11.3. Company Financials
- 12.1.11.4. SWOT Analysis
- 12.1.12 Filton Packaging Pty Ltd
- 12.1.12.1. Company Overview
- 12.1.12.2. Products
- 12.1.12.3. Company Financials
- 12.1.12.4. SWOT Analysis
- 12.1.13 Econopak Flexible Packaging
- 12.1.13.1. Company Overview
- 12.1.13.2. Products
- 12.1.13.3. Company Financials
- 12.1.13.4. SWOT Analysis
- 12.1.14 Vacupack Pty Ltd
- 12.1.14.1. Company Overview
- 12.1.14.2. Products
- 12.1.14.3. Company Financials
- 12.1.14.4. SWOT Analysis
- 12.1.1 Visy Industries Australia Pty Ltd
- 12.2. Market Entropy
- 12.2.1 Company's Key Areas Served
- 12.2.2 Recent Developments
- 12.3. Company Market Share Analysis 2025
- 12.3.1 Top 5 Companies Market Share Analysis
- 12.3.2 Top 3 Companies Market Share Analysis
- 12.4. List of Potential Customers
- 13. Research Methodology
List of Figures
- Figure 1: Global Plastic Packaging Industry in Australia Revenue Breakdown (Million, %) by Region 2025 & 2033
- Figure 2: Global Plastic Packaging Industry in Australia Volume Breakdown (K Tons, %) by Region 2025 & 2033
- Figure 3: North America Plastic Packaging Industry in Australia Revenue (Million), by Rigid Packaging 2025 & 2033
- Figure 4: North America Plastic Packaging Industry in Australia Volume (K Tons), by Rigid Packaging 2025 & 2033
- Figure 5: North America Plastic Packaging Industry in Australia Revenue Share (%), by Rigid Packaging 2025 & 2033
- Figure 6: North America Plastic Packaging Industry in Australia Volume Share (%), by Rigid Packaging 2025 & 2033
- Figure 7: North America Plastic Packaging Industry in Australia Revenue (Million), by Flexible Packaging 2025 & 2033
- Figure 8: North America Plastic Packaging Industry in Australia Volume (K Tons), by Flexible Packaging 2025 & 2033
- Figure 9: North America Plastic Packaging Industry in Australia Revenue Share (%), by Flexible Packaging 2025 & 2033
- Figure 10: North America Plastic Packaging Industry in Australia Volume Share (%), by Flexible Packaging 2025 & 2033
- Figure 11: North America Plastic Packaging Industry in Australia Revenue (Million), by Industrial Plastic Film Market 2025 & 2033
- Figure 12: North America Plastic Packaging Industry in Australia Volume (K Tons), by Industrial Plastic Film Market 2025 & 2033
- Figure 13: North America Plastic Packaging Industry in Australia Revenue Share (%), by Industrial Plastic Film Market 2025 & 2033
- Figure 14: North America Plastic Packaging Industry in Australia Volume Share (%), by Industrial Plastic Film Market 2025 & 2033
- Figure 15: North America Plastic Packaging Industry in Australia Revenue (Million), by End-user Industry 2025 & 2033
- Figure 16: North America Plastic Packaging Industry in Australia Volume (K Tons), by End-user Industry 2025 & 2033
- Figure 17: North America Plastic Packaging Industry in Australia Revenue Share (%), by End-user Industry 2025 & 2033
- Figure 18: North America Plastic Packaging Industry in Australia Volume Share (%), by End-user Industry 2025 & 2033
- Figure 19: North America Plastic Packaging Industry in Australia Revenue (Million), by Country 2025 & 2033
- Figure 20: North America Plastic Packaging Industry in Australia Volume (K Tons), by Country 2025 & 2033
- Figure 21: North America Plastic Packaging Industry in Australia Revenue Share (%), by Country 2025 & 2033
- Figure 22: North America Plastic Packaging Industry in Australia Volume Share (%), by Country 2025 & 2033
- Figure 23: South America Plastic Packaging Industry in Australia Revenue (Million), by Rigid Packaging 2025 & 2033
- Figure 24: South America Plastic Packaging Industry in Australia Volume (K Tons), by Rigid Packaging 2025 & 2033
- Figure 25: South America Plastic Packaging Industry in Australia Revenue Share (%), by Rigid Packaging 2025 & 2033
- Figure 26: South America Plastic Packaging Industry in Australia Volume Share (%), by Rigid Packaging 2025 & 2033
- Figure 27: South America Plastic Packaging Industry in Australia Revenue (Million), by Flexible Packaging 2025 & 2033
- Figure 28: South America Plastic Packaging Industry in Australia Volume (K Tons), by Flexible Packaging 2025 & 2033
- Figure 29: South America Plastic Packaging Industry in Australia Revenue Share (%), by Flexible Packaging 2025 & 2033
- Figure 30: South America Plastic Packaging Industry in Australia Volume Share (%), by Flexible Packaging 2025 & 2033
- Figure 31: South America Plastic Packaging Industry in Australia Revenue (Million), by Industrial Plastic Film Market 2025 & 2033
- Figure 32: South America Plastic Packaging Industry in Australia Volume (K Tons), by Industrial Plastic Film Market 2025 & 2033
- Figure 33: South America Plastic Packaging Industry in Australia Revenue Share (%), by Industrial Plastic Film Market 2025 & 2033
- Figure 34: South America Plastic Packaging Industry in Australia Volume Share (%), by Industrial Plastic Film Market 2025 & 2033
- Figure 35: South America Plastic Packaging Industry in Australia Revenue (Million), by End-user Industry 2025 & 2033
- Figure 36: South America Plastic Packaging Industry in Australia Volume (K Tons), by End-user Industry 2025 & 2033
- Figure 37: South America Plastic Packaging Industry in Australia Revenue Share (%), by End-user Industry 2025 & 2033
- Figure 38: South America Plastic Packaging Industry in Australia Volume Share (%), by End-user Industry 2025 & 2033
- Figure 39: South America Plastic Packaging Industry in Australia Revenue (Million), by Country 2025 & 2033
- Figure 40: South America Plastic Packaging Industry in Australia Volume (K Tons), by Country 2025 & 2033
- Figure 41: South America Plastic Packaging Industry in Australia Revenue Share (%), by Country 2025 & 2033
- Figure 42: South America Plastic Packaging Industry in Australia Volume Share (%), by Country 2025 & 2033
- Figure 43: Europe Plastic Packaging Industry in Australia Revenue (Million), by Rigid Packaging 2025 & 2033
- Figure 44: Europe Plastic Packaging Industry in Australia Volume (K Tons), by Rigid Packaging 2025 & 2033
- Figure 45: Europe Plastic Packaging Industry in Australia Revenue Share (%), by Rigid Packaging 2025 & 2033
- Figure 46: Europe Plastic Packaging Industry in Australia Volume Share (%), by Rigid Packaging 2025 & 2033
- Figure 47: Europe Plastic Packaging Industry in Australia Revenue (Million), by Flexible Packaging 2025 & 2033
- Figure 48: Europe Plastic Packaging Industry in Australia Volume (K Tons), by Flexible Packaging 2025 & 2033
- Figure 49: Europe Plastic Packaging Industry in Australia Revenue Share (%), by Flexible Packaging 2025 & 2033
- Figure 50: Europe Plastic Packaging Industry in Australia Volume Share (%), by Flexible Packaging 2025 & 2033
- Figure 51: Europe Plastic Packaging Industry in Australia Revenue (Million), by Industrial Plastic Film Market 2025 & 2033
- Figure 52: Europe Plastic Packaging Industry in Australia Volume (K Tons), by Industrial Plastic Film Market 2025 & 2033
- Figure 53: Europe Plastic Packaging Industry in Australia Revenue Share (%), by Industrial Plastic Film Market 2025 & 2033
- Figure 54: Europe Plastic Packaging Industry in Australia Volume Share (%), by Industrial Plastic Film Market 2025 & 2033
- Figure 55: Europe Plastic Packaging Industry in Australia Revenue (Million), by End-user Industry 2025 & 2033
- Figure 56: Europe Plastic Packaging Industry in Australia Volume (K Tons), by End-user Industry 2025 & 2033
- Figure 57: Europe Plastic Packaging Industry in Australia Revenue Share (%), by End-user Industry 2025 & 2033
- Figure 58: Europe Plastic Packaging Industry in Australia Volume Share (%), by End-user Industry 2025 & 2033
- Figure 59: Europe Plastic Packaging Industry in Australia Revenue (Million), by Country 2025 & 2033
- Figure 60: Europe Plastic Packaging Industry in Australia Volume (K Tons), by Country 2025 & 2033
- Figure 61: Europe Plastic Packaging Industry in Australia Revenue Share (%), by Country 2025 & 2033
- Figure 62: Europe Plastic Packaging Industry in Australia Volume Share (%), by Country 2025 & 2033
- Figure 63: Middle East & Africa Plastic Packaging Industry in Australia Revenue (Million), by Rigid Packaging 2025 & 2033
- Figure 64: Middle East & Africa Plastic Packaging Industry in Australia Volume (K Tons), by Rigid Packaging 2025 & 2033
- Figure 65: Middle East & Africa Plastic Packaging Industry in Australia Revenue Share (%), by Rigid Packaging 2025 & 2033
- Figure 66: Middle East & Africa Plastic Packaging Industry in Australia Volume Share (%), by Rigid Packaging 2025 & 2033
- Figure 67: Middle East & Africa Plastic Packaging Industry in Australia Revenue (Million), by Flexible Packaging 2025 & 2033
- Figure 68: Middle East & Africa Plastic Packaging Industry in Australia Volume (K Tons), by Flexible Packaging 2025 & 2033
- Figure 69: Middle East & Africa Plastic Packaging Industry in Australia Revenue Share (%), by Flexible Packaging 2025 & 2033
- Figure 70: Middle East & Africa Plastic Packaging Industry in Australia Volume Share (%), by Flexible Packaging 2025 & 2033
- Figure 71: Middle East & Africa Plastic Packaging Industry in Australia Revenue (Million), by Industrial Plastic Film Market 2025 & 2033
- Figure 72: Middle East & Africa Plastic Packaging Industry in Australia Volume (K Tons), by Industrial Plastic Film Market 2025 & 2033
- Figure 73: Middle East & Africa Plastic Packaging Industry in Australia Revenue Share (%), by Industrial Plastic Film Market 2025 & 2033
- Figure 74: Middle East & Africa Plastic Packaging Industry in Australia Volume Share (%), by Industrial Plastic Film Market 2025 & 2033
- Figure 75: Middle East & Africa Plastic Packaging Industry in Australia Revenue (Million), by End-user Industry 2025 & 2033
- Figure 76: Middle East & Africa Plastic Packaging Industry in Australia Volume (K Tons), by End-user Industry 2025 & 2033
- Figure 77: Middle East & Africa Plastic Packaging Industry in Australia Revenue Share (%), by End-user Industry 2025 & 2033
- Figure 78: Middle East & Africa Plastic Packaging Industry in Australia Volume Share (%), by End-user Industry 2025 & 2033
- Figure 79: Middle East & Africa Plastic Packaging Industry in Australia Revenue (Million), by Country 2025 & 2033
- Figure 80: Middle East & Africa Plastic Packaging Industry in Australia Volume (K Tons), by Country 2025 & 2033
- Figure 81: Middle East & Africa Plastic Packaging Industry in Australia Revenue Share (%), by Country 2025 & 2033
- Figure 82: Middle East & Africa Plastic Packaging Industry in Australia Volume Share (%), by Country 2025 & 2033
- Figure 83: Asia Pacific Plastic Packaging Industry in Australia Revenue (Million), by Rigid Packaging 2025 & 2033
- Figure 84: Asia Pacific Plastic Packaging Industry in Australia Volume (K Tons), by Rigid Packaging 2025 & 2033
- Figure 85: Asia Pacific Plastic Packaging Industry in Australia Revenue Share (%), by Rigid Packaging 2025 & 2033
- Figure 86: Asia Pacific Plastic Packaging Industry in Australia Volume Share (%), by Rigid Packaging 2025 & 2033
- Figure 87: Asia Pacific Plastic Packaging Industry in Australia Revenue (Million), by Flexible Packaging 2025 & 2033
- Figure 88: Asia Pacific Plastic Packaging Industry in Australia Volume (K Tons), by Flexible Packaging 2025 & 2033
- Figure 89: Asia Pacific Plastic Packaging Industry in Australia Revenue Share (%), by Flexible Packaging 2025 & 2033
- Figure 90: Asia Pacific Plastic Packaging Industry in Australia Volume Share (%), by Flexible Packaging 2025 & 2033
- Figure 91: Asia Pacific Plastic Packaging Industry in Australia Revenue (Million), by Industrial Plastic Film Market 2025 & 2033
- Figure 92: Asia Pacific Plastic Packaging Industry in Australia Volume (K Tons), by Industrial Plastic Film Market 2025 & 2033
- Figure 93: Asia Pacific Plastic Packaging Industry in Australia Revenue Share (%), by Industrial Plastic Film Market 2025 & 2033
- Figure 94: Asia Pacific Plastic Packaging Industry in Australia Volume Share (%), by Industrial Plastic Film Market 2025 & 2033
- Figure 95: Asia Pacific Plastic Packaging Industry in Australia Revenue (Million), by End-user Industry 2025 & 2033
- Figure 96: Asia Pacific Plastic Packaging Industry in Australia Volume (K Tons), by End-user Industry 2025 & 2033
- Figure 97: Asia Pacific Plastic Packaging Industry in Australia Revenue Share (%), by End-user Industry 2025 & 2033
- Figure 98: Asia Pacific Plastic Packaging Industry in Australia Volume Share (%), by End-user Industry 2025 & 2033
- Figure 99: Asia Pacific Plastic Packaging Industry in Australia Revenue (Million), by Country 2025 & 2033
- Figure 100: Asia Pacific Plastic Packaging Industry in Australia Volume (K Tons), by Country 2025 & 2033
- Figure 101: Asia Pacific Plastic Packaging Industry in Australia Revenue Share (%), by Country 2025 & 2033
- Figure 102: Asia Pacific Plastic Packaging Industry in Australia Volume Share (%), by Country 2025 & 2033
List of Tables
- Table 1: Global Plastic Packaging Industry in Australia Revenue Million Forecast, by Rigid Packaging 2020 & 2033
- Table 2: Global Plastic Packaging Industry in Australia Volume K Tons Forecast, by Rigid Packaging 2020 & 2033
- Table 3: Global Plastic Packaging Industry in Australia Revenue Million Forecast, by Flexible Packaging 2020 & 2033
- Table 4: Global Plastic Packaging Industry in Australia Volume K Tons Forecast, by Flexible Packaging 2020 & 2033
- Table 5: Global Plastic Packaging Industry in Australia Revenue Million Forecast, by Industrial Plastic Film Market 2020 & 2033
- Table 6: Global Plastic Packaging Industry in Australia Volume K Tons Forecast, by Industrial Plastic Film Market 2020 & 2033
- Table 7: Global Plastic Packaging Industry in Australia Revenue Million Forecast, by End-user Industry 2020 & 2033
- Table 8: Global Plastic Packaging Industry in Australia Volume K Tons Forecast, by End-user Industry 2020 & 2033
- Table 9: Global Plastic Packaging Industry in Australia Revenue Million Forecast, by Region 2020 & 2033
- Table 10: Global Plastic Packaging Industry in Australia Volume K Tons Forecast, by Region 2020 & 2033
- Table 11: Global Plastic Packaging Industry in Australia Revenue Million Forecast, by Rigid Packaging 2020 & 2033
- Table 12: Global Plastic Packaging Industry in Australia Volume K Tons Forecast, by Rigid Packaging 2020 & 2033
- Table 13: Global Plastic Packaging Industry in Australia Revenue Million Forecast, by Flexible Packaging 2020 & 2033
- Table 14: Global Plastic Packaging Industry in Australia Volume K Tons Forecast, by Flexible Packaging 2020 & 2033
- Table 15: Global Plastic Packaging Industry in Australia Revenue Million Forecast, by Industrial Plastic Film Market 2020 & 2033
- Table 16: Global Plastic Packaging Industry in Australia Volume K Tons Forecast, by Industrial Plastic Film Market 2020 & 2033
- Table 17: Global Plastic Packaging Industry in Australia Revenue Million Forecast, by End-user Industry 2020 & 2033
- Table 18: Global Plastic Packaging Industry in Australia Volume K Tons Forecast, by End-user Industry 2020 & 2033
- Table 19: Global Plastic Packaging Industry in Australia Revenue Million Forecast, by Country 2020 & 2033
- Table 20: Global Plastic Packaging Industry in Australia Volume K Tons Forecast, by Country 2020 & 2033
- Table 21: United States Plastic Packaging Industry in Australia Revenue (Million) Forecast, by Application 2020 & 2033
- Table 22: United States Plastic Packaging Industry in Australia Volume (K Tons) Forecast, by Application 2020 & 2033
- Table 23: Canada Plastic Packaging Industry in Australia Revenue (Million) Forecast, by Application 2020 & 2033
- Table 24: Canada Plastic Packaging Industry in Australia Volume (K Tons) Forecast, by Application 2020 & 2033
- Table 25: Mexico Plastic Packaging Industry in Australia Revenue (Million) Forecast, by Application 2020 & 2033
- Table 26: Mexico Plastic Packaging Industry in Australia Volume (K Tons) Forecast, by Application 2020 & 2033
- Table 27: Global Plastic Packaging Industry in Australia Revenue Million Forecast, by Rigid Packaging 2020 & 2033
- Table 28: Global Plastic Packaging Industry in Australia Volume K Tons Forecast, by Rigid Packaging 2020 & 2033
- Table 29: Global Plastic Packaging Industry in Australia Revenue Million Forecast, by Flexible Packaging 2020 & 2033
- Table 30: Global Plastic Packaging Industry in Australia Volume K Tons Forecast, by Flexible Packaging 2020 & 2033
- Table 31: Global Plastic Packaging Industry in Australia Revenue Million Forecast, by Industrial Plastic Film Market 2020 & 2033
- Table 32: Global Plastic Packaging Industry in Australia Volume K Tons Forecast, by Industrial Plastic Film Market 2020 & 2033
- Table 33: Global Plastic Packaging Industry in Australia Revenue Million Forecast, by End-user Industry 2020 & 2033
- Table 34: Global Plastic Packaging Industry in Australia Volume K Tons Forecast, by End-user Industry 2020 & 2033
- Table 35: Global Plastic Packaging Industry in Australia Revenue Million Forecast, by Country 2020 & 2033
- Table 36: Global Plastic Packaging Industry in Australia Volume K Tons Forecast, by Country 2020 & 2033
- Table 37: Brazil Plastic Packaging Industry in Australia Revenue (Million) Forecast, by Application 2020 & 2033
- Table 38: Brazil Plastic Packaging Industry in Australia Volume (K Tons) Forecast, by Application 2020 & 2033
- Table 39: Argentina Plastic Packaging Industry in Australia Revenue (Million) Forecast, by Application 2020 & 2033
- Table 40: Argentina Plastic Packaging Industry in Australia Volume (K Tons) Forecast, by Application 2020 & 2033
- Table 41: Rest of South America Plastic Packaging Industry in Australia Revenue (Million) Forecast, by Application 2020 & 2033
- Table 42: Rest of South America Plastic Packaging Industry in Australia Volume (K Tons) Forecast, by Application 2020 & 2033
- Table 43: Global Plastic Packaging Industry in Australia Revenue Million Forecast, by Rigid Packaging 2020 & 2033
- Table 44: Global Plastic Packaging Industry in Australia Volume K Tons Forecast, by Rigid Packaging 2020 & 2033
- Table 45: Global Plastic Packaging Industry in Australia Revenue Million Forecast, by Flexible Packaging 2020 & 2033
- Table 46: Global Plastic Packaging Industry in Australia Volume K Tons Forecast, by Flexible Packaging 2020 & 2033
- Table 47: Global Plastic Packaging Industry in Australia Revenue Million Forecast, by Industrial Plastic Film Market 2020 & 2033
- Table 48: Global Plastic Packaging Industry in Australia Volume K Tons Forecast, by Industrial Plastic Film Market 2020 & 2033
- Table 49: Global Plastic Packaging Industry in Australia Revenue Million Forecast, by End-user Industry 2020 & 2033
- Table 50: Global Plastic Packaging Industry in Australia Volume K Tons Forecast, by End-user Industry 2020 & 2033
- Table 51: Global Plastic Packaging Industry in Australia Revenue Million Forecast, by Country 2020 & 2033
- Table 52: Global Plastic Packaging Industry in Australia Volume K Tons Forecast, by Country 2020 & 2033
- Table 53: United Kingdom Plastic Packaging Industry in Australia Revenue (Million) Forecast, by Application 2020 & 2033
- Table 54: United Kingdom Plastic Packaging Industry in Australia Volume (K Tons) Forecast, by Application 2020 & 2033
- Table 55: Germany Plastic Packaging Industry in Australia Revenue (Million) Forecast, by Application 2020 & 2033
- Table 56: Germany Plastic Packaging Industry in Australia Volume (K Tons) Forecast, by Application 2020 & 2033
- Table 57: France Plastic Packaging Industry in Australia Revenue (Million) Forecast, by Application 2020 & 2033
- Table 58: France Plastic Packaging Industry in Australia Volume (K Tons) Forecast, by Application 2020 & 2033
- Table 59: Italy Plastic Packaging Industry in Australia Revenue (Million) Forecast, by Application 2020 & 2033
- Table 60: Italy Plastic Packaging Industry in Australia Volume (K Tons) Forecast, by Application 2020 & 2033
- Table 61: Spain Plastic Packaging Industry in Australia Revenue (Million) Forecast, by Application 2020 & 2033
- Table 62: Spain Plastic Packaging Industry in Australia Volume (K Tons) Forecast, by Application 2020 & 2033
- Table 63: Russia Plastic Packaging Industry in Australia Revenue (Million) Forecast, by Application 2020 & 2033
- Table 64: Russia Plastic Packaging Industry in Australia Volume (K Tons) Forecast, by Application 2020 & 2033
- Table 65: Benelux Plastic Packaging Industry in Australia Revenue (Million) Forecast, by Application 2020 & 2033
- Table 66: Benelux Plastic Packaging Industry in Australia Volume (K Tons) Forecast, by Application 2020 & 2033
- Table 67: Nordics Plastic Packaging Industry in Australia Revenue (Million) Forecast, by Application 2020 & 2033
- Table 68: Nordics Plastic Packaging Industry in Australia Volume (K Tons) Forecast, by Application 2020 & 2033
- Table 69: Rest of Europe Plastic Packaging Industry in Australia Revenue (Million) Forecast, by Application 2020 & 2033
- Table 70: Rest of Europe Plastic Packaging Industry in Australia Volume (K Tons) Forecast, by Application 2020 & 2033
- Table 71: Global Plastic Packaging Industry in Australia Revenue Million Forecast, by Rigid Packaging 2020 & 2033
- Table 72: Global Plastic Packaging Industry in Australia Volume K Tons Forecast, by Rigid Packaging 2020 & 2033
- Table 73: Global Plastic Packaging Industry in Australia Revenue Million Forecast, by Flexible Packaging 2020 & 2033
- Table 74: Global Plastic Packaging Industry in Australia Volume K Tons Forecast, by Flexible Packaging 2020 & 2033
- Table 75: Global Plastic Packaging Industry in Australia Revenue Million Forecast, by Industrial Plastic Film Market 2020 & 2033
- Table 76: Global Plastic Packaging Industry in Australia Volume K Tons Forecast, by Industrial Plastic Film Market 2020 & 2033
- Table 77: Global Plastic Packaging Industry in Australia Revenue Million Forecast, by End-user Industry 2020 & 2033
- Table 78: Global Plastic Packaging Industry in Australia Volume K Tons Forecast, by End-user Industry 2020 & 2033
- Table 79: Global Plastic Packaging Industry in Australia Revenue Million Forecast, by Country 2020 & 2033
- Table 80: Global Plastic Packaging Industry in Australia Volume K Tons Forecast, by Country 2020 & 2033
- Table 81: Turkey Plastic Packaging Industry in Australia Revenue (Million) Forecast, by Application 2020 & 2033
- Table 82: Turkey Plastic Packaging Industry in Australia Volume (K Tons) Forecast, by Application 2020 & 2033
- Table 83: Israel Plastic Packaging Industry in Australia Revenue (Million) Forecast, by Application 2020 & 2033
- Table 84: Israel Plastic Packaging Industry in Australia Volume (K Tons) Forecast, by Application 2020 & 2033
- Table 85: GCC Plastic Packaging Industry in Australia Revenue (Million) Forecast, by Application 2020 & 2033
- Table 86: GCC Plastic Packaging Industry in Australia Volume (K Tons) Forecast, by Application 2020 & 2033
- Table 87: North Africa Plastic Packaging Industry in Australia Revenue (Million) Forecast, by Application 2020 & 2033
- Table 88: North Africa Plastic Packaging Industry in Australia Volume (K Tons) Forecast, by Application 2020 & 2033
- Table 89: South Africa Plastic Packaging Industry in Australia Revenue (Million) Forecast, by Application 2020 & 2033
- Table 90: South Africa Plastic Packaging Industry in Australia Volume (K Tons) Forecast, by Application 2020 & 2033
- Table 91: Rest of Middle East & Africa Plastic Packaging Industry in Australia Revenue (Million) Forecast, by Application 2020 & 2033
- Table 92: Rest of Middle East & Africa Plastic Packaging Industry in Australia Volume (K Tons) Forecast, by Application 2020 & 2033
- Table 93: Global Plastic Packaging Industry in Australia Revenue Million Forecast, by Rigid Packaging 2020 & 2033
- Table 94: Global Plastic Packaging Industry in Australia Volume K Tons Forecast, by Rigid Packaging 2020 & 2033
- Table 95: Global Plastic Packaging Industry in Australia Revenue Million Forecast, by Flexible Packaging 2020 & 2033
- Table 96: Global Plastic Packaging Industry in Australia Volume K Tons Forecast, by Flexible Packaging 2020 & 2033
- Table 97: Global Plastic Packaging Industry in Australia Revenue Million Forecast, by Industrial Plastic Film Market 2020 & 2033
- Table 98: Global Plastic Packaging Industry in Australia Volume K Tons Forecast, by Industrial Plastic Film Market 2020 & 2033
- Table 99: Global Plastic Packaging Industry in Australia Revenue Million Forecast, by End-user Industry 2020 & 2033
- Table 100: Global Plastic Packaging Industry in Australia Volume K Tons Forecast, by End-user Industry 2020 & 2033
- Table 101: Global Plastic Packaging Industry in Australia Revenue Million Forecast, by Country 2020 & 2033
- Table 102: Global Plastic Packaging Industry in Australia Volume K Tons Forecast, by Country 2020 & 2033
- Table 103: China Plastic Packaging Industry in Australia Revenue (Million) Forecast, by Application 2020 & 2033
- Table 104: China Plastic Packaging Industry in Australia Volume (K Tons) Forecast, by Application 2020 & 2033
- Table 105: India Plastic Packaging Industry in Australia Revenue (Million) Forecast, by Application 2020 & 2033
- Table 106: India Plastic Packaging Industry in Australia Volume (K Tons) Forecast, by Application 2020 & 2033
- Table 107: Japan Plastic Packaging Industry in Australia Revenue (Million) Forecast, by Application 2020 & 2033
- Table 108: Japan Plastic Packaging Industry in Australia Volume (K Tons) Forecast, by Application 2020 & 2033
- Table 109: South Korea Plastic Packaging Industry in Australia Revenue (Million) Forecast, by Application 2020 & 2033
- Table 110: South Korea Plastic Packaging Industry in Australia Volume (K Tons) Forecast, by Application 2020 & 2033
- Table 111: ASEAN Plastic Packaging Industry in Australia Revenue (Million) Forecast, by Application 2020 & 2033
- Table 112: ASEAN Plastic Packaging Industry in Australia Volume (K Tons) Forecast, by Application 2020 & 2033
- Table 113: Oceania Plastic Packaging Industry in Australia Revenue (Million) Forecast, by Application 2020 & 2033
- Table 114: Oceania Plastic Packaging Industry in Australia Volume (K Tons) Forecast, by Application 2020 & 2033
- Table 115: Rest of Asia Pacific Plastic Packaging Industry in Australia Revenue (Million) Forecast, by Application 2020 & 2033
- Table 116: Rest of Asia Pacific Plastic Packaging Industry in Australia Volume (K Tons) Forecast, by Application 2020 & 2033
Frequently Asked Questions
1. What is the projected Compound Annual Growth Rate (CAGR) of the Plastic Packaging Industry in Australia?
The projected CAGR is approximately 2.14%.
2. Which companies are prominent players in the Plastic Packaging Industry in Australia?
Key companies in the market include Visy Industries Australia Pty Ltd, Gravure Packaging Ltd, Cospak Pty Ltd, Plasmo Pty Ltd*List Not Exhaustive, Flexible Packaging Solutions Pty Ltd, Orora Packaging Australia Pty Ltd, A&M Packaging Pty Ltd, Pact Group Holdings Australia Pty Ltd, Caspak Products Pty Ltd, Synergy Packaging (RPC Group), Pro-Pac Packaging Pty Ltd, Filton Packaging Pty Ltd, Econopak Flexible Packaging, Vacupack Pty Ltd.
3. What are the main segments of the Plastic Packaging Industry in Australia?
The market segments include Rigid Packaging, Flexible Packaging, Industrial Plastic Film Market, End-user Industry.
4. Can you provide details about the market size?
The market size is estimated to be USD 2.79 Million as of 2022.
5. What are some drivers contributing to market growth?
Increasing Demand from the Food Industry; Increased Eco-friendly Packaging and Recycled Plastics.
6. What are the notable trends driving market growth?
Increasing Demand from the Food Industry.
7. Are there any restraints impacting market growth?
4.; Fluctuating Cost of Raw Materials.
8. Can you provide examples of recent developments in the market?
October 2022 - To meet its goals for 2025, Mondelez Australia promotes recycled soft plastic packaging. To meet the country's 2025 targets, according to Mondelez Australia, more work needs to be done to increase the recyclability of soft plastic packaging rather than viewing it as the enemy.
9. What pricing options are available for accessing the report?
Pricing options include single-user, multi-user, and enterprise licenses priced at USD 3800, USD 4500, and USD 5800 respectively.
10. Is the market size provided in terms of value or volume?
The market size is provided in terms of value, measured in Million and volume, measured in K Tons.
11. Are there any specific market keywords associated with the report?
Yes, the market keyword associated with the report is "Plastic Packaging Industry in Australia," which aids in identifying and referencing the specific market segment covered.
12. How do I determine which pricing option suits my needs best?
The pricing options vary based on user requirements and access needs. Individual users may opt for single-user licenses, while businesses requiring broader access may choose multi-user or enterprise licenses for cost-effective access to the report.
13. Are there any additional resources or data provided in the Plastic Packaging Industry in Australia report?
While the report offers comprehensive insights, it's advisable to review the specific contents or supplementary materials provided to ascertain if additional resources or data are available.
14. How can I stay updated on further developments or reports in the Plastic Packaging Industry in Australia?
To stay informed about further developments, trends, and reports in the Plastic Packaging Industry in Australia, consider subscribing to industry newsletters, following relevant companies and organizations, or regularly checking reputable industry news sources and publications.
Methodology
Step 1 - Identification of Relevant Samples Size from Population Database


Step 2 - Approaches for Defining Global Market Size (Value, Volume* & Price*)

Note*: In applicable scenarios
Step 3 - Data Sources
Primary Research
- Web Analytics
- Survey Reports
- Research Institute
- Latest Research Reports
- Opinion Leaders
Secondary Research
- Annual Reports
- White Paper
- Latest Press Release
- Industry Association
- Paid Database
- Investor Presentations

Step 4 - Data Triangulation
Involves using different sources of information in order to increase the validity of a study
These sources are likely to be stakeholders in a program - participants, other researchers, program staff, other community members, and so on.
Then we put all data in single framework & apply various statistical tools to find out the dynamic on the market.
During the analysis stage, feedback from the stakeholder groups would be compared to determine areas of agreement as well as areas of divergence