

Key Insights
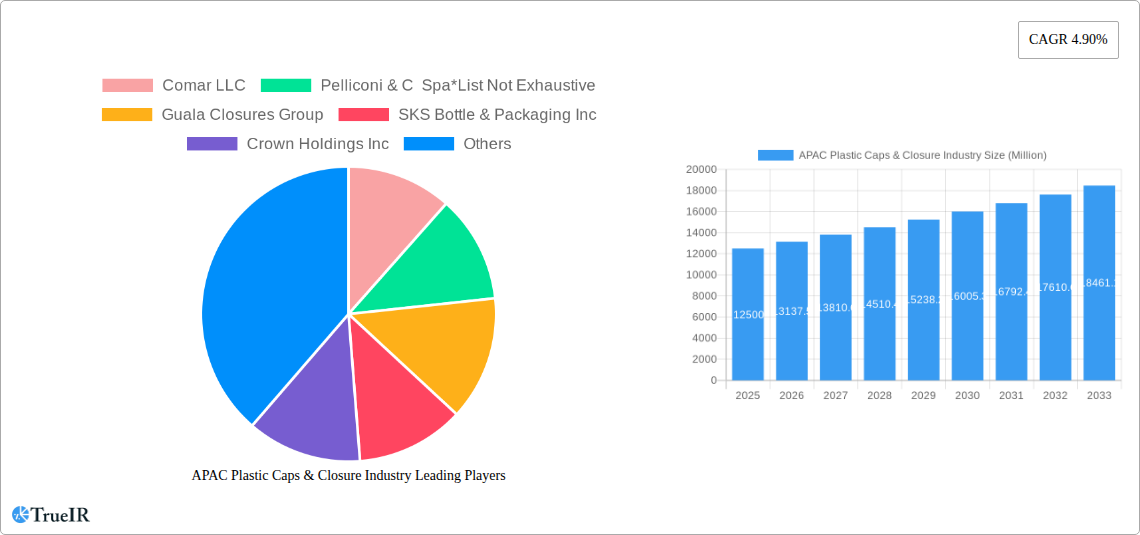
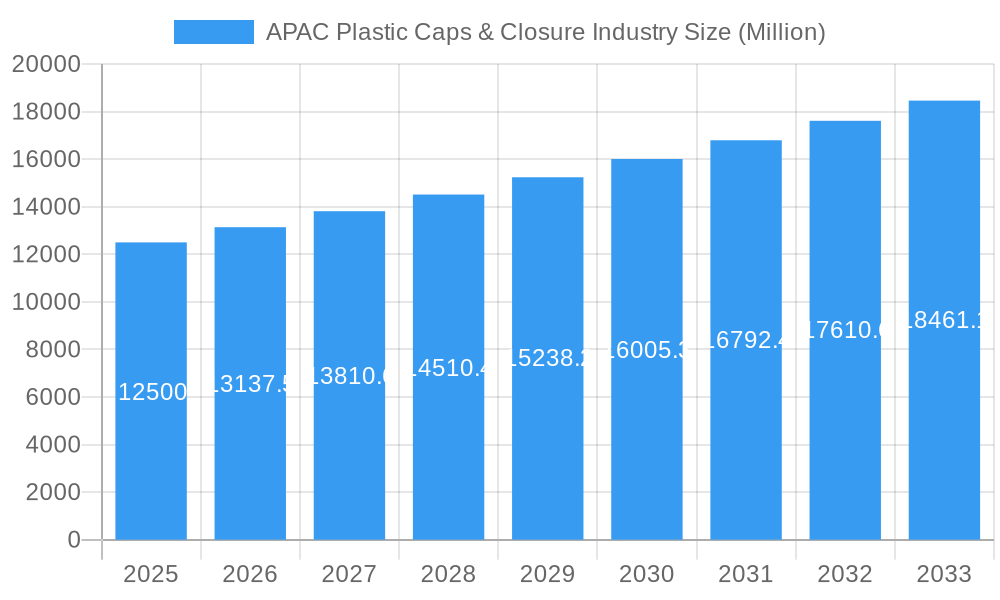
The Asia Pacific (APAC) plastic caps and closures market is projected for significant expansion, driven by expanding consumer bases and increasing demand from key industries. With an estimated market size of 85.2 billion, the region anticipates a Compound Annual Growth Rate (CAGR) of 5.52% from 2025 to 2033. Growth is largely fueled by the food and beverage sector, due to rising consumption of packaged goods. The pharmaceutical and healthcare industries also exhibit heightened demand for secure closures, supported by an aging population and increased healthcare spending. The cosmetic and toiletries segment contributes significantly, propelled by rising disposable incomes and a preference for appealing, functional packaging. Emerging economies, particularly China and India, lead this expansion, benefiting from industrialization, urbanization, and a growing middle class.
APAC Plastic Caps & Closure Industry Market Size (In Billion)
While growth drivers are strong, market restraints include raw material price fluctuations and stringent environmental regulations on plastic waste. Companies are prioritizing innovative solutions like lightweight designs, tamper-evident features, and the development of recyclable or biodegradable materials to address these challenges and align with sustainability goals. The competitive landscape features established global players and regional manufacturers, with companies like Amcor Ltd, Berry Global Inc, and Guala Closures Group investing in R&D and production capacity expansion. China and India's dominance in consumption and manufacturing will continue to shape regional dynamics.
APAC Plastic Caps & Closure Industry Company Market Share
This report offers a strategic overview of the APAC Plastic Caps & Closure industry, detailing market structure, trends, opportunities, dominant segments, and key players. Utilizing high-volume SEO keywords such as "APAC plastic caps market," "Asia Pacific closures industry," "PET caps growth," "PP closures forecast," "beverage packaging trends," "pharmaceutical caps demand," and "cosmetic closure innovation," this analysis targets industry professionals, investors, and stakeholders seeking a competitive advantage. The study includes a comprehensive historical analysis from 2019-2024, with a base year of 2025 and a forecast period extending to 2033, powered by a CAGR of 5.52%.
APAC Plastic Caps & Closure Industry Market Structure & Competitive Landscape
The APAC plastic caps and closures market exhibits a moderately concentrated structure, with a few leading global players and a significant number of regional and local manufacturers vying for market share. Innovation remains a key differentiator, driven by the demand for sustainable solutions, advanced barrier properties, and enhanced user convenience. Regulatory frameworks, particularly concerning food contact materials and environmental impact, are increasingly shaping product development and manufacturing processes. Product substitutes, such as metal closures or alternative sealing mechanisms, pose a limited threat due to the cost-effectiveness and versatility of plastic options. The end-user industry segmentation reveals the beverage sector as the largest consumer, followed by food, pharmaceutical & healthcare, and cosmetics & toiletries. Mergers and acquisitions (M&A) are active, with a notable transaction being the acquisition of Albea Group's dispensing business by Silgan Holdings Inc. for $900 million in June 2020, signaling consolidation and strategic expansion. The Herfindahl-Hirschman Index (HHI) for the market is estimated at xx, indicating a moderate level of competition. Key M&A activities in the historical period (2019-2024) amounted to an estimated value of $xx billion, driving market consolidation and technological advancements.
APAC Plastic Caps & Closure Industry Market Trends & Opportunities
The APAC plastic caps and closure market is poised for significant growth, driven by the burgeoning middle class, increasing disposable incomes, and a rising demand for packaged goods across diverse end-user industries. The market size is projected to reach an estimated $xx billion by 2033, exhibiting a Compound Annual Growth Rate (CAGR) of xx% during the forecast period of 2025–2033. Technological advancements are at the forefront of market evolution, with a strong emphasis on lightweighting, tamper-evident features, child-resistant designs, and smart closures that offer traceability and authentication. Sustainability is no longer a niche concern but a core driver, pushing manufacturers towards the adoption of recycled plastics (rPET, rPP), bio-based materials, and designs that facilitate recyclability. Consumer preferences are increasingly leaning towards convenience, ease of use, and aesthetically pleasing packaging. This has fueled the demand for specialized closures such as dispensing caps, flip-top caps, and spray caps, particularly within the cosmetics, toiletries, and household segments.
The competitive landscape is characterized by a blend of global giants and agile local players. Companies are investing heavily in R&D to develop innovative solutions that meet evolving consumer needs and stringent regulatory requirements. Market penetration rates for advanced closure technologies are steadily increasing, especially in developing economies within the APAC region, where rapid urbanization and changing lifestyles are accelerating the adoption of packaged goods. Opportunities abound in sectors like premium beverages, specialized food products, and advanced pharmaceutical packaging, where the demand for high-performance and aesthetically superior closures is high. Furthermore, the growing e-commerce sector presents a unique opportunity for specialized closure solutions that ensure product integrity during transit and handling. The integration of digital technologies, such as QR codes and NFC tags on closures for supply chain management and consumer engagement, represents another promising avenue for future growth and differentiation. The shift towards a circular economy is also creating opportunities for innovative recycling and material recovery solutions within the plastic caps and closure value chain.
Dominant Markets & Segments in APAC Plastic Caps & Closure Industry
The dominance within the APAC Plastic Caps & Closure industry is multifaceted, with distinct regional and material segments driving significant growth. Asia Pacific, as a whole, is the largest and fastest-growing regional market due to its massive population, rapid economic development, and increasing urbanization. Within this region, China stands out as the leading country, accounting for a substantial share of both production and consumption, driven by its vast manufacturing capabilities and enormous domestic market for consumer goods. India is another key growth engine, experiencing robust demand across all end-user segments.
Material Segment Dominance:
- PP (Polypropylene): Currently holds the largest market share and is projected to continue its dominance. Its versatility, cost-effectiveness, and suitability for a wide range of applications, including beverage, food, and household products, make it a preferred choice. Key growth drivers include its excellent chemical resistance and ability to be molded into complex shapes.
- HDPE (High-Density Polyethylene): A strong contender, particularly for liquid packaging in the food, beverage, and household sectors. Its rigidity and barrier properties are crucial for maintaining product integrity. Growth is fueled by its use in milk jugs, detergents, and industrial chemical containers.
- PET (Polyethylene Terephthalate): Dominates the beverage bottle closure segment, especially for carbonated and non-carbonated drinks. The demand for PET bottles, in turn, drives the demand for PET caps. Innovations in lightweighting and tamper-evident features further boost its market presence.
- LDPE (Low-Density Polyethylene): While having a smaller share compared to PP and HDPE, LDPE is essential for applications requiring flexibility, such as squeeze bottles and flexible packaging closures.
End-user Industry Dominance:
- Beverage: This segment is the largest consumer of plastic caps and closures, driven by the immense demand for bottled water, carbonated soft drinks, juices, and alcoholic beverages. Growing health consciousness and the demand for convenient on-the-go consumption are key drivers. Infrastructure development supporting beverage production and distribution networks is critical for its growth.
- Food: The second-largest segment, encompassing a wide array of products from dairy and edible oils to sauces and processed foods. The increasing adoption of ready-to-eat meals and convenience foods fuels demand for secure and tamper-evident closures.
- Pharmaceutical and Healthcare: This segment, though smaller in volume, represents a high-value market due to stringent regulatory requirements and the need for precision, safety, and child-resistance. The growing aging population and increased healthcare spending are significant growth catalysts. Policies promoting drug safety and tamper-proofing are crucial here.
- Cosmetics and Toiletries: Driven by rising disposable incomes and consumer trends towards personal grooming and beauty products, this segment demands innovative and aesthetically appealing closures. Demand for pump dispensers, flip-top caps, and spray closures is particularly strong.
APAC Plastic Caps & Closure Industry Product Analysis
Product innovation in the APAC plastic caps and closure industry is primarily focused on enhancing functionality, sustainability, and user experience. Advancements in material science allow for the development of lighter yet stronger closures, reducing material consumption and shipping costs. Tamper-evident features, such as induction seals and tear-off bands, are becoming standard across most applications to ensure product integrity and consumer safety. The industry is witnessing a surge in demand for dispensing closures, including pump dispensers, trigger sprayers, and flip-top caps, catering to the convenience-driven beverage, food, and cosmetics sectors. Furthermore, the integration of smart technologies, such as RFID tags and QR codes, is emerging for supply chain traceability and brand protection. The competitive advantage lies in offering customized solutions that meet specific packaging requirements, regulatory compliance, and brand aesthetics.
Key Drivers, Barriers & Challenges in APAC Plastic Caps & Closure Industry
Key Drivers:
- Growing Consumer Demand: Rapid population growth and increasing disposable incomes across APAC fuel the demand for packaged goods, directly impacting the caps and closures market.
- Urbanization and Changing Lifestyles: The shift towards urban living and busy lifestyles increases the reliance on convenient, pre-packaged food and beverage options.
- Technological Advancements: Innovations in material science, product design (e.g., tamper-evident, child-resistant), and manufacturing processes drive market growth and product differentiation.
- Sustainability Initiatives: The increasing global focus on environmental sustainability is pushing manufacturers to adopt recycled and bio-based materials, as well as design for recyclability.
- E-commerce Growth: The burgeoning e-commerce sector necessitates robust and secure packaging solutions, including specialized closures, to ensure product safety during transit.
Barriers & Challenges:
- Regulatory Complexities: Varying and evolving regulations across different APAC countries concerning food contact materials, recycling, and waste management can pose significant compliance challenges.
- Volatile Raw Material Prices: Fluctuations in the prices of petrochemicals, the primary raw materials for plastic caps and closures, can impact manufacturing costs and profitability. The current price of crude oil, a key determinant, is estimated to be $xx per barrel.
- Supply Chain Disruptions: Global supply chain vulnerabilities, including shipping delays and component shortages, can impact production schedules and material availability.
- Intense Competition and Price Pressure: The market is characterized by a large number of players, leading to intense price competition, particularly in commoditized segments.
- Consumer Perception of Plastic: Negative consumer perception regarding plastic waste and its environmental impact can create pressure for alternative materials or significantly improved recycling infrastructure.
Growth Drivers in the APAC Plastic Caps & Closure Industry Market
The APAC Plastic Caps & Closure industry is propelled by a confluence of factors. Economically, rising disposable incomes in emerging economies like India and Southeast Asian nations are driving increased consumption of packaged goods. Technologically, advancements in lightweighting and tamper-evident features are reducing material costs and enhancing product safety, thereby boosting adoption. Regulatory tailwinds, such as government initiatives promoting circular economy principles and responsible plastic use, are encouraging innovation in sustainable materials and recyclable designs. The booming e-commerce sector is also a significant growth catalyst, demanding more robust and secure closure solutions to prevent product damage during transit. The continued expansion of the beverage and food processing industries, driven by population growth and changing dietary habits, provides a foundational demand for caps and closures.
Challenges Impacting APAC Plastic Caps & Closure Industry Growth
Despite robust growth prospects, the APAC Plastic Caps & Closure industry faces significant hurdles. Regulatory complexities across diverse national frameworks, particularly concerning food-grade certifications and end-of-life management of plastics, can create compliance burdens and market entry barriers. Supply chain disruptions, amplified by geopolitical events and global shipping challenges, can lead to material shortages and production delays, impacting lead times and costs. For instance, a recent disruption in the polyethylene supply chain in Q1 2025 led to an estimated xx% increase in raw material costs. Intense competition, especially from lower-cost manufacturers in certain regions, exerts considerable price pressure, squeezing profit margins. Furthermore, growing public and governmental scrutiny on plastic waste and pollution necessitates substantial investment in sustainable solutions and recycling infrastructure, which can be a capital-intensive challenge for many manufacturers.
Key Players Shaping the APAC Plastic Caps & Closure Industry Market
- Comar LLC
- Pelliconi & C Spa
- Guala Closures Group
- SKS Bottle & Packaging Inc
- Crown Holdings Inc
- AptarGroup Inc
- Albea Group
- Coral Products PLC
- Evergreen Packaging Inc
- Nippon Closures Co Ltd
- BERICAP GmbH & Co KG
- Tetra Pak International SA
- Berry Global Inc
- O Berk Company LLC
- Silgan Holdings Inc
- Closure Systems International
- MJS Packaging
- Amcor Ltd
Significant APAC Plastic Caps & Closure Industry Industry Milestones
- June 2020: Silgan Holdings Inc., a leading supplier of sustainable rigid packaging solutions for consumer goods products, acquired the dispensing business of the Albea Group for $900 million. This strategic acquisition significantly consolidated Silgan's position in the dispensing closures market and expanded its geographical reach within the APAC region.
- 2021: Increased investment in R&D for bio-based and compostable closures by several major players, responding to growing consumer and regulatory pressure for sustainable packaging solutions.
- 2022: Introduction of advanced tamper-evident closure technologies with enhanced security features across the beverage and pharmaceutical sectors.
- 2023: Major manufacturers began implementing closed-loop recycling initiatives for post-consumer recycled (PCR) plastics in their closure production, aiming to improve sustainability credentials.
- 2024: Significant expansion of production capacities by key players in emerging APAC markets to meet the escalating demand for packaged goods.
Future Outlook for APAC Plastic Caps & Closure Industry Market
The future outlook for the APAC Plastic Caps & Closure industry remains exceptionally bright, characterized by sustained growth and transformative innovation. The relentless demand for packaged goods, fueled by demographic shifts and evolving consumer lifestyles, will continue to be the primary growth catalyst. Sustainability will remain at the forefront, driving the widespread adoption of recycled, renewable, and biodegradable materials. Expect significant advancements in smart closures, offering enhanced traceability, authentication, and consumer engagement features. The industry will witness further consolidation through strategic mergers and acquisitions as companies seek to expand their product portfolios and geographical footprint. Investments in advanced manufacturing technologies, including automation and digitalization, will be crucial for optimizing production efficiency and responding to dynamic market demands. The projected market size is expected to reach $xx billion by 2033, driven by a CAGR of xx%. Opportunities will emerge in specialized applications such as pharmaceutical packaging with stringent safety requirements and premium cosmetic closures.
APAC Plastic Caps & Closure Industry Segmentation
-
1. Material
- 1.1. PET
- 1.2. PP
- 1.3. LDPE and HDPE
- 1.4. Other Materials
-
2. End-user Industry
- 2.1. Beverage
- 2.2. Food
- 2.3. Pharmaceutical and Healthcare
- 2.4. Cosmetics and Toiletries
- 2.5. Househol
- 2.6. Other En
APAC Plastic Caps & Closure Industry Segmentation By Geography
-
1. North America
- 1.1. United States
- 1.2. Canada
- 1.3. Mexico
-
2. South America
- 2.1. Brazil
- 2.2. Argentina
- 2.3. Rest of South America
-
3. Europe
- 3.1. United Kingdom
- 3.2. Germany
- 3.3. France
- 3.4. Italy
- 3.5. Spain
- 3.6. Russia
- 3.7. Benelux
- 3.8. Nordics
- 3.9. Rest of Europe
-
4. Middle East & Africa
- 4.1. Turkey
- 4.2. Israel
- 4.3. GCC
- 4.4. North Africa
- 4.5. South Africa
- 4.6. Rest of Middle East & Africa
-
5. Asia Pacific
- 5.1. China
- 5.2. India
- 5.3. Japan
- 5.4. South Korea
- 5.5. ASEAN
- 5.6. Oceania
- 5.7. Rest of Asia Pacific
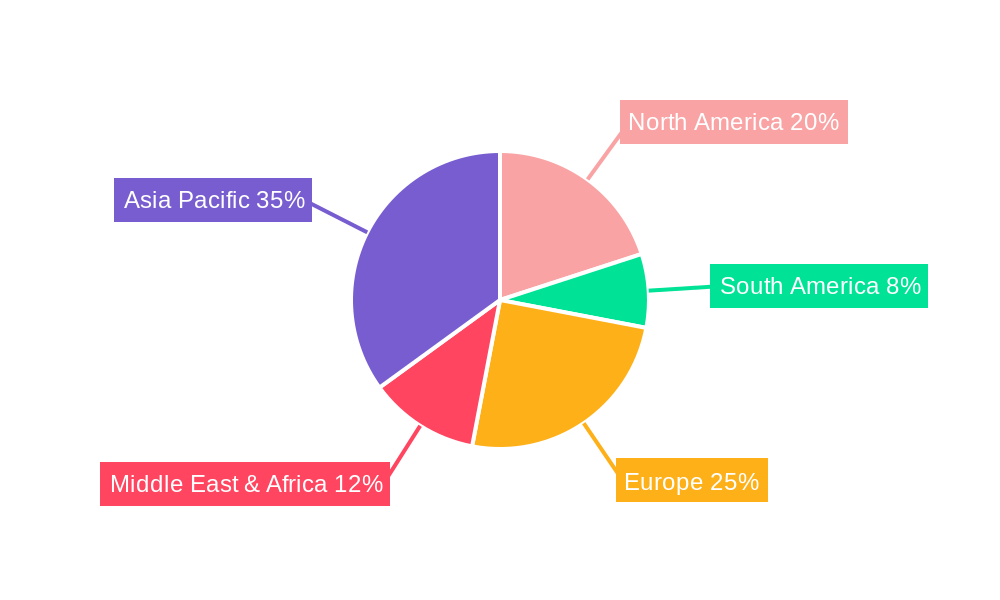
APAC Plastic Caps & Closure Industry Regional Market Share
Geographic Coverage of APAC Plastic Caps & Closure Industry
APAC Plastic Caps & Closure Industry REPORT HIGHLIGHTS
| Aspects | Details |
|---|---|
| Study Period | 2020-2034 |
| Base Year | 2025 |
| Estimated Year | 2026 |
| Forecast Period | 2026-2034 |
| Historical Period | 2020-2025 |
| Growth Rate | CAGR of 5.52% from 2020-2034 |
| Segmentation |
|
Table of Contents
- 1. Introduction
- 1.1. Research Scope
- 1.2. Market Segmentation
- 1.3. Research Objective
- 1.4. Definitions and Assumptions
- 2. Executive Summary
- 2.1. Market Snapshot
- 3. Market Dynamics
- 3.1. Market Drivers
- 3.2. Market Restrains
- 3.3. Market Trends
- 3.4. Market Opportunities
- 4. Market Factor Analysis
- 4.1. Porters Five Forces
- 4.1.1. Bargaining Power of Suppliers
- 4.1.2. Bargaining Power of Buyers
- 4.1.3. Threat of New Entrants
- 4.1.4. Threat of Substitutes
- 4.1.5. Competitive Rivalry
- 4.2. PESTEL analysis
- 4.3. BCG Analysis
- 4.3.1. Stars (High Growth, High Market Share)
- 4.3.2. Cash Cows (Low Growth, High Market Share)
- 4.3.3. Question Mark (High Growth, Low Market Share)
- 4.3.4. Dogs (Low Growth, Low Market Share)
- 4.4. Ansoff Matrix Analysis
- 4.5. Supply Chain Analysis
- 4.6. Regulatory Landscape
- 4.7. Current Market Potential and Opportunity Assessment (TAM–SAM–SOM Framework)
- 4.8. TIR Analyst Note
- 4.1. Porters Five Forces
- 5. Market Analysis, Insights and Forecast 2021-2033
- 5.1. Market Analysis, Insights and Forecast - by Material
- 5.1.1. PET
- 5.1.2. PP
- 5.1.3. LDPE and HDPE
- 5.1.4. Other Materials
- 5.2. Market Analysis, Insights and Forecast - by End-user Industry
- 5.2.1. Beverage
- 5.2.2. Food
- 5.2.3. Pharmaceutical and Healthcare
- 5.2.4. Cosmetics and Toiletries
- 5.2.5. Househol
- 5.2.6. Other En
- 5.3. Market Analysis, Insights and Forecast - by Region
- 5.3.1. North America
- 5.3.2. South America
- 5.3.3. Europe
- 5.3.4. Middle East & Africa
- 5.3.5. Asia Pacific
- 5.1. Market Analysis, Insights and Forecast - by Material
- 6. Global APAC Plastic Caps & Closure Industry Analysis, Insights and Forecast, 2021-2033
- 6.1. Market Analysis, Insights and Forecast - by Material
- 6.1.1. PET
- 6.1.2. PP
- 6.1.3. LDPE and HDPE
- 6.1.4. Other Materials
- 6.2. Market Analysis, Insights and Forecast - by End-user Industry
- 6.2.1. Beverage
- 6.2.2. Food
- 6.2.3. Pharmaceutical and Healthcare
- 6.2.4. Cosmetics and Toiletries
- 6.2.5. Househol
- 6.2.6. Other En
- 6.1. Market Analysis, Insights and Forecast - by Material
- 7. North America APAC Plastic Caps & Closure Industry Analysis, Insights and Forecast, 2020-2032
- 7.1. Market Analysis, Insights and Forecast - by Material
- 7.1.1. PET
- 7.1.2. PP
- 7.1.3. LDPE and HDPE
- 7.1.4. Other Materials
- 7.2. Market Analysis, Insights and Forecast - by End-user Industry
- 7.2.1. Beverage
- 7.2.2. Food
- 7.2.3. Pharmaceutical and Healthcare
- 7.2.4. Cosmetics and Toiletries
- 7.2.5. Househol
- 7.2.6. Other En
- 7.1. Market Analysis, Insights and Forecast - by Material
- 8. South America APAC Plastic Caps & Closure Industry Analysis, Insights and Forecast, 2020-2032
- 8.1. Market Analysis, Insights and Forecast - by Material
- 8.1.1. PET
- 8.1.2. PP
- 8.1.3. LDPE and HDPE
- 8.1.4. Other Materials
- 8.2. Market Analysis, Insights and Forecast - by End-user Industry
- 8.2.1. Beverage
- 8.2.2. Food
- 8.2.3. Pharmaceutical and Healthcare
- 8.2.4. Cosmetics and Toiletries
- 8.2.5. Househol
- 8.2.6. Other En
- 8.1. Market Analysis, Insights and Forecast - by Material
- 9. Europe APAC Plastic Caps & Closure Industry Analysis, Insights and Forecast, 2020-2032
- 9.1. Market Analysis, Insights and Forecast - by Material
- 9.1.1. PET
- 9.1.2. PP
- 9.1.3. LDPE and HDPE
- 9.1.4. Other Materials
- 9.2. Market Analysis, Insights and Forecast - by End-user Industry
- 9.2.1. Beverage
- 9.2.2. Food
- 9.2.3. Pharmaceutical and Healthcare
- 9.2.4. Cosmetics and Toiletries
- 9.2.5. Househol
- 9.2.6. Other En
- 9.1. Market Analysis, Insights and Forecast - by Material
- 10. Middle East & Africa APAC Plastic Caps & Closure Industry Analysis, Insights and Forecast, 2020-2032
- 10.1. Market Analysis, Insights and Forecast - by Material
- 10.1.1. PET
- 10.1.2. PP
- 10.1.3. LDPE and HDPE
- 10.1.4. Other Materials
- 10.2. Market Analysis, Insights and Forecast - by End-user Industry
- 10.2.1. Beverage
- 10.2.2. Food
- 10.2.3. Pharmaceutical and Healthcare
- 10.2.4. Cosmetics and Toiletries
- 10.2.5. Househol
- 10.2.6. Other En
- 10.1. Market Analysis, Insights and Forecast - by Material
- 11. Asia Pacific APAC Plastic Caps & Closure Industry Analysis, Insights and Forecast, 2020-2032
- 11.1. Market Analysis, Insights and Forecast - by Material
- 11.1.1. PET
- 11.1.2. PP
- 11.1.3. LDPE and HDPE
- 11.1.4. Other Materials
- 11.2. Market Analysis, Insights and Forecast - by End-user Industry
- 11.2.1. Beverage
- 11.2.2. Food
- 11.2.3. Pharmaceutical and Healthcare
- 11.2.4. Cosmetics and Toiletries
- 11.2.5. Househol
- 11.2.6. Other En
- 11.1. Market Analysis, Insights and Forecast - by Material
- 12. Competitive Analysis
- 12.1. Company Profiles
- 12.1.1 Comar LLC
- 12.1.1.1. Company Overview
- 12.1.1.2. Products
- 12.1.1.3. Company Financials
- 12.1.1.4. SWOT Analysis
- 12.1.2 Pelliconi & C Spa*List Not Exhaustive
- 12.1.2.1. Company Overview
- 12.1.2.2. Products
- 12.1.2.3. Company Financials
- 12.1.2.4. SWOT Analysis
- 12.1.3 Guala Closures Group
- 12.1.3.1. Company Overview
- 12.1.3.2. Products
- 12.1.3.3. Company Financials
- 12.1.3.4. SWOT Analysis
- 12.1.4 SKS Bottle & Packaging Inc
- 12.1.4.1. Company Overview
- 12.1.4.2. Products
- 12.1.4.3. Company Financials
- 12.1.4.4. SWOT Analysis
- 12.1.5 Crown Holdings Inc
- 12.1.5.1. Company Overview
- 12.1.5.2. Products
- 12.1.5.3. Company Financials
- 12.1.5.4. SWOT Analysis
- 12.1.6 AptarGroup Inc
- 12.1.6.1. Company Overview
- 12.1.6.2. Products
- 12.1.6.3. Company Financials
- 12.1.6.4. SWOT Analysis
- 12.1.7 Albea Group
- 12.1.7.1. Company Overview
- 12.1.7.2. Products
- 12.1.7.3. Company Financials
- 12.1.7.4. SWOT Analysis
- 12.1.8 Coral Products PLC
- 12.1.8.1. Company Overview
- 12.1.8.2. Products
- 12.1.8.3. Company Financials
- 12.1.8.4. SWOT Analysis
- 12.1.9 Evergreen Packaging Inc
- 12.1.9.1. Company Overview
- 12.1.9.2. Products
- 12.1.9.3. Company Financials
- 12.1.9.4. SWOT Analysis
- 12.1.10 Nippon closures Co Ltd
- 12.1.10.1. Company Overview
- 12.1.10.2. Products
- 12.1.10.3. Company Financials
- 12.1.10.4. SWOT Analysis
- 12.1.11 BERICAP GmbH & Co KG
- 12.1.11.1. Company Overview
- 12.1.11.2. Products
- 12.1.11.3. Company Financials
- 12.1.11.4. SWOT Analysis
- 12.1.12 Tetra Pak International SA
- 12.1.12.1. Company Overview
- 12.1.12.2. Products
- 12.1.12.3. Company Financials
- 12.1.12.4. SWOT Analysis
- 12.1.13 Berry Global Inc
- 12.1.13.1. Company Overview
- 12.1.13.2. Products
- 12.1.13.3. Company Financials
- 12.1.13.4. SWOT Analysis
- 12.1.14 O Berk Company LLC
- 12.1.14.1. Company Overview
- 12.1.14.2. Products
- 12.1.14.3. Company Financials
- 12.1.14.4. SWOT Analysis
- 12.1.15 Silgan Holdings Inc
- 12.1.15.1. Company Overview
- 12.1.15.2. Products
- 12.1.15.3. Company Financials
- 12.1.15.4. SWOT Analysis
- 12.1.16 Closure Systems International
- 12.1.16.1. Company Overview
- 12.1.16.2. Products
- 12.1.16.3. Company Financials
- 12.1.16.4. SWOT Analysis
- 12.1.17 MJS Packaging
- 12.1.17.1. Company Overview
- 12.1.17.2. Products
- 12.1.17.3. Company Financials
- 12.1.17.4. SWOT Analysis
- 12.1.18 Amcor Ltd
- 12.1.18.1. Company Overview
- 12.1.18.2. Products
- 12.1.18.3. Company Financials
- 12.1.18.4. SWOT Analysis
- 12.1.1 Comar LLC
- 12.2. Market Entropy
- 12.2.1 Company's Key Areas Served
- 12.2.2 Recent Developments
- 12.3. Company Market Share Analysis 2025
- 12.3.1 Top 5 Companies Market Share Analysis
- 12.3.2 Top 3 Companies Market Share Analysis
- 12.4. List of Potential Customers
- 13. Research Methodology
List of Figures
- Figure 1: Global APAC Plastic Caps & Closure Industry Revenue Breakdown (billion, %) by Region 2025 & 2033
- Figure 2: North America APAC Plastic Caps & Closure Industry Revenue (billion), by Material 2025 & 2033
- Figure 3: North America APAC Plastic Caps & Closure Industry Revenue Share (%), by Material 2025 & 2033
- Figure 4: North America APAC Plastic Caps & Closure Industry Revenue (billion), by End-user Industry 2025 & 2033
- Figure 5: North America APAC Plastic Caps & Closure Industry Revenue Share (%), by End-user Industry 2025 & 2033
- Figure 6: North America APAC Plastic Caps & Closure Industry Revenue (billion), by Country 2025 & 2033
- Figure 7: North America APAC Plastic Caps & Closure Industry Revenue Share (%), by Country 2025 & 2033
- Figure 8: South America APAC Plastic Caps & Closure Industry Revenue (billion), by Material 2025 & 2033
- Figure 9: South America APAC Plastic Caps & Closure Industry Revenue Share (%), by Material 2025 & 2033
- Figure 10: South America APAC Plastic Caps & Closure Industry Revenue (billion), by End-user Industry 2025 & 2033
- Figure 11: South America APAC Plastic Caps & Closure Industry Revenue Share (%), by End-user Industry 2025 & 2033
- Figure 12: South America APAC Plastic Caps & Closure Industry Revenue (billion), by Country 2025 & 2033
- Figure 13: South America APAC Plastic Caps & Closure Industry Revenue Share (%), by Country 2025 & 2033
- Figure 14: Europe APAC Plastic Caps & Closure Industry Revenue (billion), by Material 2025 & 2033
- Figure 15: Europe APAC Plastic Caps & Closure Industry Revenue Share (%), by Material 2025 & 2033
- Figure 16: Europe APAC Plastic Caps & Closure Industry Revenue (billion), by End-user Industry 2025 & 2033
- Figure 17: Europe APAC Plastic Caps & Closure Industry Revenue Share (%), by End-user Industry 2025 & 2033
- Figure 18: Europe APAC Plastic Caps & Closure Industry Revenue (billion), by Country 2025 & 2033
- Figure 19: Europe APAC Plastic Caps & Closure Industry Revenue Share (%), by Country 2025 & 2033
- Figure 20: Middle East & Africa APAC Plastic Caps & Closure Industry Revenue (billion), by Material 2025 & 2033
- Figure 21: Middle East & Africa APAC Plastic Caps & Closure Industry Revenue Share (%), by Material 2025 & 2033
- Figure 22: Middle East & Africa APAC Plastic Caps & Closure Industry Revenue (billion), by End-user Industry 2025 & 2033
- Figure 23: Middle East & Africa APAC Plastic Caps & Closure Industry Revenue Share (%), by End-user Industry 2025 & 2033
- Figure 24: Middle East & Africa APAC Plastic Caps & Closure Industry Revenue (billion), by Country 2025 & 2033
- Figure 25: Middle East & Africa APAC Plastic Caps & Closure Industry Revenue Share (%), by Country 2025 & 2033
- Figure 26: Asia Pacific APAC Plastic Caps & Closure Industry Revenue (billion), by Material 2025 & 2033
- Figure 27: Asia Pacific APAC Plastic Caps & Closure Industry Revenue Share (%), by Material 2025 & 2033
- Figure 28: Asia Pacific APAC Plastic Caps & Closure Industry Revenue (billion), by End-user Industry 2025 & 2033
- Figure 29: Asia Pacific APAC Plastic Caps & Closure Industry Revenue Share (%), by End-user Industry 2025 & 2033
- Figure 30: Asia Pacific APAC Plastic Caps & Closure Industry Revenue (billion), by Country 2025 & 2033
- Figure 31: Asia Pacific APAC Plastic Caps & Closure Industry Revenue Share (%), by Country 2025 & 2033
List of Tables
- Table 1: Global APAC Plastic Caps & Closure Industry Revenue billion Forecast, by Material 2020 & 2033
- Table 2: Global APAC Plastic Caps & Closure Industry Revenue billion Forecast, by End-user Industry 2020 & 2033
- Table 3: Global APAC Plastic Caps & Closure Industry Revenue billion Forecast, by Region 2020 & 2033
- Table 4: Global APAC Plastic Caps & Closure Industry Revenue billion Forecast, by Material 2020 & 2033
- Table 5: Global APAC Plastic Caps & Closure Industry Revenue billion Forecast, by End-user Industry 2020 & 2033
- Table 6: Global APAC Plastic Caps & Closure Industry Revenue billion Forecast, by Country 2020 & 2033
- Table 7: United States APAC Plastic Caps & Closure Industry Revenue (billion) Forecast, by Application 2020 & 2033
- Table 8: Canada APAC Plastic Caps & Closure Industry Revenue (billion) Forecast, by Application 2020 & 2033
- Table 9: Mexico APAC Plastic Caps & Closure Industry Revenue (billion) Forecast, by Application 2020 & 2033
- Table 10: Global APAC Plastic Caps & Closure Industry Revenue billion Forecast, by Material 2020 & 2033
- Table 11: Global APAC Plastic Caps & Closure Industry Revenue billion Forecast, by End-user Industry 2020 & 2033
- Table 12: Global APAC Plastic Caps & Closure Industry Revenue billion Forecast, by Country 2020 & 2033
- Table 13: Brazil APAC Plastic Caps & Closure Industry Revenue (billion) Forecast, by Application 2020 & 2033
- Table 14: Argentina APAC Plastic Caps & Closure Industry Revenue (billion) Forecast, by Application 2020 & 2033
- Table 15: Rest of South America APAC Plastic Caps & Closure Industry Revenue (billion) Forecast, by Application 2020 & 2033
- Table 16: Global APAC Plastic Caps & Closure Industry Revenue billion Forecast, by Material 2020 & 2033
- Table 17: Global APAC Plastic Caps & Closure Industry Revenue billion Forecast, by End-user Industry 2020 & 2033
- Table 18: Global APAC Plastic Caps & Closure Industry Revenue billion Forecast, by Country 2020 & 2033
- Table 19: United Kingdom APAC Plastic Caps & Closure Industry Revenue (billion) Forecast, by Application 2020 & 2033
- Table 20: Germany APAC Plastic Caps & Closure Industry Revenue (billion) Forecast, by Application 2020 & 2033
- Table 21: France APAC Plastic Caps & Closure Industry Revenue (billion) Forecast, by Application 2020 & 2033
- Table 22: Italy APAC Plastic Caps & Closure Industry Revenue (billion) Forecast, by Application 2020 & 2033
- Table 23: Spain APAC Plastic Caps & Closure Industry Revenue (billion) Forecast, by Application 2020 & 2033
- Table 24: Russia APAC Plastic Caps & Closure Industry Revenue (billion) Forecast, by Application 2020 & 2033
- Table 25: Benelux APAC Plastic Caps & Closure Industry Revenue (billion) Forecast, by Application 2020 & 2033
- Table 26: Nordics APAC Plastic Caps & Closure Industry Revenue (billion) Forecast, by Application 2020 & 2033
- Table 27: Rest of Europe APAC Plastic Caps & Closure Industry Revenue (billion) Forecast, by Application 2020 & 2033
- Table 28: Global APAC Plastic Caps & Closure Industry Revenue billion Forecast, by Material 2020 & 2033
- Table 29: Global APAC Plastic Caps & Closure Industry Revenue billion Forecast, by End-user Industry 2020 & 2033
- Table 30: Global APAC Plastic Caps & Closure Industry Revenue billion Forecast, by Country 2020 & 2033
- Table 31: Turkey APAC Plastic Caps & Closure Industry Revenue (billion) Forecast, by Application 2020 & 2033
- Table 32: Israel APAC Plastic Caps & Closure Industry Revenue (billion) Forecast, by Application 2020 & 2033
- Table 33: GCC APAC Plastic Caps & Closure Industry Revenue (billion) Forecast, by Application 2020 & 2033
- Table 34: North Africa APAC Plastic Caps & Closure Industry Revenue (billion) Forecast, by Application 2020 & 2033
- Table 35: South Africa APAC Plastic Caps & Closure Industry Revenue (billion) Forecast, by Application 2020 & 2033
- Table 36: Rest of Middle East & Africa APAC Plastic Caps & Closure Industry Revenue (billion) Forecast, by Application 2020 & 2033
- Table 37: Global APAC Plastic Caps & Closure Industry Revenue billion Forecast, by Material 2020 & 2033
- Table 38: Global APAC Plastic Caps & Closure Industry Revenue billion Forecast, by End-user Industry 2020 & 2033
- Table 39: Global APAC Plastic Caps & Closure Industry Revenue billion Forecast, by Country 2020 & 2033
- Table 40: China APAC Plastic Caps & Closure Industry Revenue (billion) Forecast, by Application 2020 & 2033
- Table 41: India APAC Plastic Caps & Closure Industry Revenue (billion) Forecast, by Application 2020 & 2033
- Table 42: Japan APAC Plastic Caps & Closure Industry Revenue (billion) Forecast, by Application 2020 & 2033
- Table 43: South Korea APAC Plastic Caps & Closure Industry Revenue (billion) Forecast, by Application 2020 & 2033
- Table 44: ASEAN APAC Plastic Caps & Closure Industry Revenue (billion) Forecast, by Application 2020 & 2033
- Table 45: Oceania APAC Plastic Caps & Closure Industry Revenue (billion) Forecast, by Application 2020 & 2033
- Table 46: Rest of Asia Pacific APAC Plastic Caps & Closure Industry Revenue (billion) Forecast, by Application 2020 & 2033
Frequently Asked Questions
1. What is the projected Compound Annual Growth Rate (CAGR) of the APAC Plastic Caps & Closure Industry?
The projected CAGR is approximately 5.52%.
2. Which companies are prominent players in the APAC Plastic Caps & Closure Industry?
Key companies in the market include Comar LLC, Pelliconi & C Spa*List Not Exhaustive, Guala Closures Group, SKS Bottle & Packaging Inc, Crown Holdings Inc, AptarGroup Inc, Albea Group, Coral Products PLC, Evergreen Packaging Inc, Nippon closures Co Ltd, BERICAP GmbH & Co KG, Tetra Pak International SA, Berry Global Inc, O Berk Company LLC, Silgan Holdings Inc, Closure Systems International, MJS Packaging, Amcor Ltd.
3. What are the main segments of the APAC Plastic Caps & Closure Industry?
The market segments include Material, End-user Industry.
4. Can you provide details about the market size?
The market size is estimated to be USD 85.2 billion as of 2022.
5. What are some drivers contributing to market growth?
Growing Consumption of Single Serve Beverages; Advent of Innovative Products.
6. What are the notable trends driving market growth?
PET is Expected to Witness Significant Growth.
7. Are there any restraints impacting market growth?
Regulations on Usage of Pet Bottles/Caps in Pharmaceutical Drugs and Food Packaging.
8. Can you provide examples of recent developments in the market?
June 2020 - Silgan Holdings Inc., a leading supplier of sustainable rigid packaging solutions for consumer goods products, acquired the dispensing business of the Albea Group for $900 million.
9. What pricing options are available for accessing the report?
Pricing options include single-user, multi-user, and enterprise licenses priced at USD 4750, USD 4950, and USD 6800 respectively.
10. Is the market size provided in terms of value or volume?
The market size is provided in terms of value, measured in billion.
11. Are there any specific market keywords associated with the report?
Yes, the market keyword associated with the report is "APAC Plastic Caps & Closure Industry," which aids in identifying and referencing the specific market segment covered.
12. How do I determine which pricing option suits my needs best?
The pricing options vary based on user requirements and access needs. Individual users may opt for single-user licenses, while businesses requiring broader access may choose multi-user or enterprise licenses for cost-effective access to the report.
13. Are there any additional resources or data provided in the APAC Plastic Caps & Closure Industry report?
While the report offers comprehensive insights, it's advisable to review the specific contents or supplementary materials provided to ascertain if additional resources or data are available.
14. How can I stay updated on further developments or reports in the APAC Plastic Caps & Closure Industry?
To stay informed about further developments, trends, and reports in the APAC Plastic Caps & Closure Industry, consider subscribing to industry newsletters, following relevant companies and organizations, or regularly checking reputable industry news sources and publications.
Methodology
Step 1 - Identification of Relevant Samples Size from Population Database


Step 2 - Approaches for Defining Global Market Size (Value, Volume* & Price*)

Note*: In applicable scenarios
Step 3 - Data Sources
Primary Research
- Web Analytics
- Survey Reports
- Research Institute
- Latest Research Reports
- Opinion Leaders
Secondary Research
- Annual Reports
- White Paper
- Latest Press Release
- Industry Association
- Paid Database
- Investor Presentations

Step 4 - Data Triangulation
Involves using different sources of information in order to increase the validity of a study
These sources are likely to be stakeholders in a program - participants, other researchers, program staff, other community members, and so on.
Then we put all data in single framework & apply various statistical tools to find out the dynamic on the market.
During the analysis stage, feedback from the stakeholder groups would be compared to determine areas of agreement as well as areas of divergence