

Key Insights
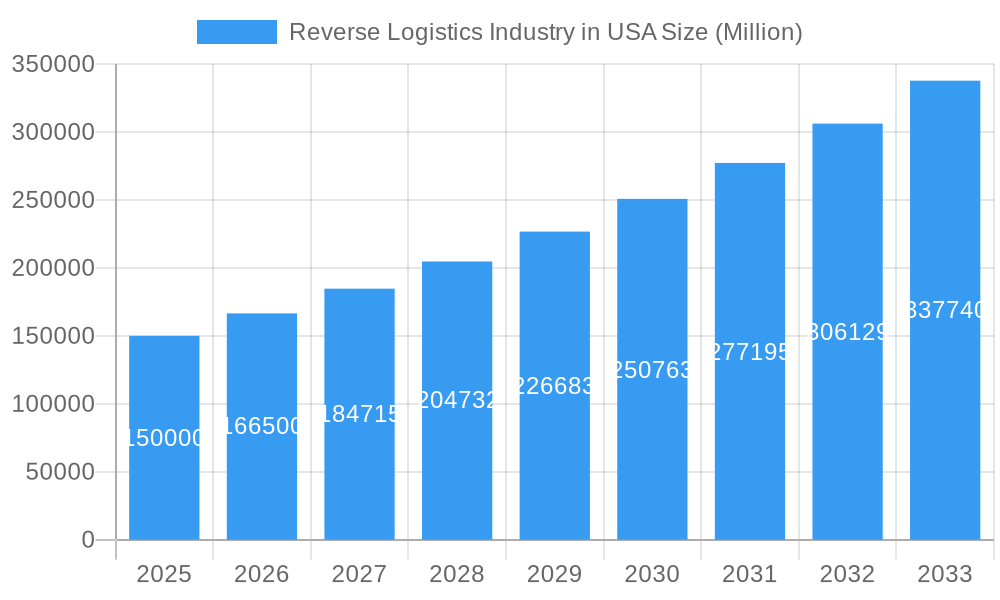
The US reverse logistics market, encompassing the processes of returning, processing, and repurposing goods, is experiencing robust growth. Driven by factors such as increasing e-commerce sales, heightened consumer expectations for convenient returns, and a growing emphasis on sustainability and reducing waste, the market is projected to maintain a Compound Annual Growth Rate (CAGR) exceeding 11% from 2025 to 2033. This expansion is fueled by several key trends: the rise of omnichannel retail, demanding efficient return management; the increasing prevalence of subscription services generating a continuous flow of returns; and the growing adoption of technology solutions like automated return portals and intelligent sorting systems that streamline operations. Significant market segments include consumer and retail (e-commerce dominating), automotive (recall management and parts returns), and healthcare (pharmaceutical returns and medical device recalls). While challenges exist, such as managing fluctuating return rates and optimizing last-mile logistics for returns, the overall market outlook is exceptionally positive, with opportunities for innovation and growth across various service functions, including warehousing, transportation, and value-added services like refurbishment and disposition. Major players like FedEx, UPS, and DHL are strategically positioning themselves to capitalize on this expansion.
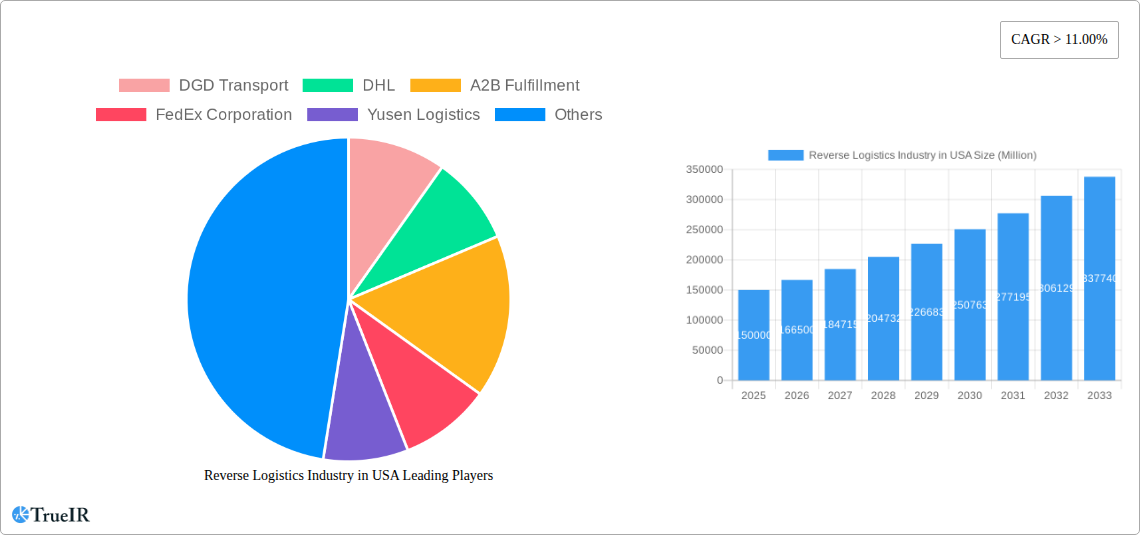
Reverse Logistics Industry in USA Market Size (In Billion)
The regional distribution within the US reflects the concentration of population and economic activity. The Northeast, West, and Southeast regions are likely to capture the largest market shares, driven by significant e-commerce activity and high population density. However, growth is expected across all regions, spurred by increasing online shopping penetration even in less densely populated areas. The market is characterized by significant fragmentation, with numerous smaller companies specializing in niche services alongside established logistics giants. Competition is fierce, necessitating the development of innovative solutions, advanced technologies, and optimized operational efficiencies to capture market share and provide superior value to customers. The ongoing investment in technological advancements, particularly in artificial intelligence and automation, promises further market expansion and efficiency improvements in the years to come.
Reverse Logistics Industry in USA Company Market Share
Reverse Logistics Industry in USA: A Comprehensive Market Report (2019-2033)
This in-depth report provides a comprehensive analysis of the Reverse Logistics industry in the USA, covering market size, growth trends, competitive landscape, key players, and future outlook. The study period spans from 2019 to 2033, with 2025 serving as the base and estimated year. The forecast period extends from 2025 to 2033, while the historical period encompasses 2019-2024. This report is crucial for businesses, investors, and stakeholders seeking to understand and navigate this rapidly evolving market. The market is valued at $xx Million in 2025 and is projected to reach $xx Million by 2033, exhibiting a CAGR of xx%.
Reverse Logistics Industry in USA Market Structure & Competitive Landscape
The US reverse logistics market is characterized by a moderately concentrated structure, with a projected Herfindahl-Hirschman Index (HHI) of approximately [Insert HHI value here, e.g., 1800] in 2025. Leading global logistics providers such as FedEx Corporation, UPS, and DHL maintain a significant presence, yet the landscape is enriched by a diverse ecosystem of specialized and agile smaller firms. Innovation is a key differentiator, fueled by rapid advancements in technologies like AI-driven route optimization for efficient return pickups, sophisticated automated warehousing and sortation systems, and advanced data analytics platforms that enhance the speed and accuracy of return processing. Evolving regulatory frameworks, particularly concerning environmental stewardship, waste reduction mandates, and increasingly consumer-friendly e-commerce return policies, exert a profound influence on operational strategies and cost structures. While direct product substitutes are limited, the competitive intensity is amplified by the emergence of new, tech-forward entrants and the strategic consideration by large, vertically integrated companies to insource their reverse logistics operations. The end-user segmentation is overwhelmingly dominated by the Consumer and Retail sector, propelled by the sustained boom in e-commerce. Merger and acquisition (M&A) activity has remained a consistent feature in recent years, with an estimated [Insert number of deals here, e.g., 45-55] deals recorded between 2019 and 2024. These transactions have predominantly centered on strategic objectives such as broadening service portfolios, enhancing technological capabilities, and expanding geographical footprints.
- Market Concentration: Projected HHI of [Insert HHI value here] in 2025, indicating a moderately concentrated market with significant room for growth for specialized players.
- Innovation Drivers: Key technological advancements include AI-powered route optimization, sophisticated automated warehousing and sortation, and predictive data analytics for proactive return management.
- Regulatory Impacts: Ongoing shifts in environmental regulations (e.g., extended producer responsibility) and consumer protection laws related to e-commerce returns are shaping operational mandates and compliance requirements.
- Competitive Dynamics: Limited direct substitutes, but evolving competitive pressures stem from new entrants and the strategic insourcing of reverse logistics by large enterprises.
- End-User Segmentation: The Consumer & Retail sector remains the largest segment, with significant contributions from Automotive, Healthcare & Pharmaceuticals, and Industrial sectors, each with unique return requirements.
- M&A Trends: Approximately [Insert number of deals here] M&A deals between 2019-2024, signaling a trend towards consolidation for service expansion, technological integration, and market penetration.
Reverse Logistics Industry in USA Market Trends & Opportunities
The US reverse logistics market is experiencing significant growth, driven by the booming e-commerce sector, increasing consumer returns, and a growing focus on sustainability. The market size is projected to expand at a CAGR of xx% from 2025 to 2033, reaching $xx Million by 2033. Technological advancements, such as the Internet of Things (IoT) and blockchain technology, are streamlining reverse logistics processes, improving efficiency, and reducing costs. Changing consumer preferences, including increased demand for convenient return options and sustainable practices, are shaping market dynamics. Competitive dynamics are intensifying, with established players investing in technology and expanding their service offerings while new entrants emerge, offering specialized solutions. Market penetration rates for advanced technologies like AI-powered route optimization are still relatively low but are expected to grow rapidly in the coming years.
Dominant Markets & Segments in Reverse Logistics Industry in USA
The Consumer and Retail segment, particularly e-commerce, represents the largest and fastest-growing segment within the US reverse logistics market, accounting for approximately xx% of the total market value in 2025. Within this segment, apparel and consumer electronics contribute significantly to return volumes. Geographically, the market is concentrated in major metropolitan areas with high population density and robust e-commerce activity.
Key Growth Drivers in the Consumer & Retail Segment:
- Increased e-commerce sales.
- Higher return rates in apparel and electronics.
- Growing consumer demand for convenient returns.
Key Growth Drivers in Warehousing:
- Need for efficient storage, distribution, and consolidation of returned goods.
- Rise of omnichannel retail models.
- Expansion of e-commerce fulfillment centers.
Market Dominance Analysis: The dominance of the Consumer & Retail segment is primarily driven by the explosive growth of e-commerce, resulting in a large volume of returns. The warehousing function is crucial in managing these returns effectively.
Reverse Logistics Industry in USA Product Analysis
Product innovation within the US reverse logistics sector is sharply focused on elevating operational efficiency, enhancing sustainability, and maximizing value recovery from returned goods. Leading-edge solutions encompass intelligent AI-powered software platforms designed to meticulously optimize every stage of the reverse supply chain, from collection to disposition. Advanced automated sorting and processing systems are revolutionizing handling speeds and accuracy, while the development and adoption of sustainable packaging solutions for returned items are gaining significant traction. These innovations collectively deliver a potent competitive advantage by substantially reducing operational costs, accelerating turnaround times for processing returns, and bolstering corporate environmental credentials. Furthermore, the industry is increasingly emphasizing the development of sophisticated value-added services. This includes robust refurbishment programs, expert repair services, and strategic resale channels for returned products, which not only create new, profitable revenue streams but also significantly contribute to waste minimization and a more circular economy.
Key Drivers, Barriers & Challenges in Reverse Logistics Industry in USA
Key Drivers: The rapid expansion of e-commerce, growing consumer expectations for easy returns, increasing focus on sustainability, and technological advancements in automation and data analytics are key drivers.
Challenges: Increasing transportation costs, regulatory complexity concerning waste disposal and hazardous materials, and the need for efficient and cost-effective return processes pose significant challenges. Supply chain disruptions, like those experienced in recent years, can severely impact operational efficiency and profitability. The competitive pressure from both established players and new entrants further increases the challenge for companies in this sector. These challenges represent an estimated $xx Million loss annually to the industry.
Growth Drivers in the Reverse Logistics Industry in USA Market
The burgeoning e-commerce landscape, characterized by ever-increasing return rates, stands as a primary catalyst for market expansion. Concurrently, a heightened societal and corporate emphasis on sustainability and environmental responsibility is compelling businesses to adopt more efficient and eco-friendly reverse logistics practices. Continuous technological advancements, particularly in areas like automation, artificial intelligence, and data analytics, are further streamlining operations and enabling new service models. Additionally, supportive government regulations aimed at promoting responsible waste management, fostering supply chain transparency, and encouraging circular economy principles are providing a favorable regulatory tailwind for the industry's growth.
Challenges Impacting Reverse Logistics Industry in USA Growth
Regulatory hurdles surrounding waste disposal and hazardous materials pose a significant challenge. Inefficient and costly return processes, coupled with fluctuating fuel costs and supply chain disruptions, hinder growth. The competitive landscape, with established players and emerging startups, creates intense pressure on profit margins.
Key Players Shaping the Reverse Logistics Industry in USA Market
- DGD Transport
- DHL
- A2B Fulfillment
- FedEx Corporation
- Yusen Logistics
- United Parcel Service (UPS)
- YRC Worldwide Inc
- 7 COMPANY PROFILES
- C.H. Robinson Worldwide Inc
- XPO Logistics
- Excelsior Integrated LLC
- Happy Returns Inc
- American Distribution Inc
- FW Logistics
- Newgistics Inc
- United States Postal Service (USPS)
- Optoro
Significant Reverse Logistics Industry in USA Industry Milestones
- 2020: A pronounced surge in the prioritization of sustainable reverse logistics practices, driven by amplified global environmental awareness and consumer demand for eco-conscious brands.
- 2021: A wave of substantial investments by major industry players into cutting-edge automation technologies and AI solutions to significantly optimize the efficiency and cost-effectiveness of reverse logistics operations.
- 2022: A notable period of consolidation, marked by several strategic mergers and acquisitions among smaller, specialized reverse logistics companies seeking to scale operations and expand service capabilities.
- 2023: The introduction of a new generation of sophisticated and user-friendly software platforms specifically designed to enhance returns management processes and improve customer experience.
- 2024: Demonstrated increase in the adoption of blockchain technology across the supply chain, fostering greater transparency, traceability, and security in the handling of returned goods.
Future Outlook for Reverse Logistics Industry in USA Market
The future trajectory of the US reverse logistics market is exceptionally robust and poised for sustained, significant expansion. The relentless growth of e-commerce, coupled with ongoing, transformative technological innovation and an unwavering commitment to sustainability, will be the principal engines driving this growth. Strategic opportunities abound in the development and deployment of novel solutions for streamlined returns management, optimizing the complexities of last-mile delivery for returns, and leveraging advanced data analytics to foster more informed and proactive decision-making across the entire reverse supply chain. The market is ideally positioned for substantial growth, presenting a fertile ground for both established industry leaders and agile new entrants to thrive and innovate.
Reverse Logistics Industry in USA Segmentation
-
1. Function
-
1.1. Transportation
- 1.1.1. Road
- 1.1.2. Air
- 1.1.3. Other Modes of Transportation
- 1.2. Warehous
- 1.3. Other Va
-
1.1. Transportation
-
2. End User
- 2.1. Consumer
- 2.2. Automotive
- 2.3. Healthcare and Pharmaceuticals
- 2.4. Other Industrial Activity Sectors
- 2.5. Other End Users
Reverse Logistics Industry in USA Segmentation By Geography
-
1. North America
- 1.1. United States
- 1.2. Canada
- 1.3. Mexico
-
2. South America
- 2.1. Brazil
- 2.2. Argentina
- 2.3. Rest of South America
-
3. Europe
- 3.1. United Kingdom
- 3.2. Germany
- 3.3. France
- 3.4. Italy
- 3.5. Spain
- 3.6. Russia
- 3.7. Benelux
- 3.8. Nordics
- 3.9. Rest of Europe
-
4. Middle East & Africa
- 4.1. Turkey
- 4.2. Israel
- 4.3. GCC
- 4.4. North Africa
- 4.5. South Africa
- 4.6. Rest of Middle East & Africa
-
5. Asia Pacific
- 5.1. China
- 5.2. India
- 5.3. Japan
- 5.4. South Korea
- 5.5. ASEAN
- 5.6. Oceania
- 5.7. Rest of Asia Pacific
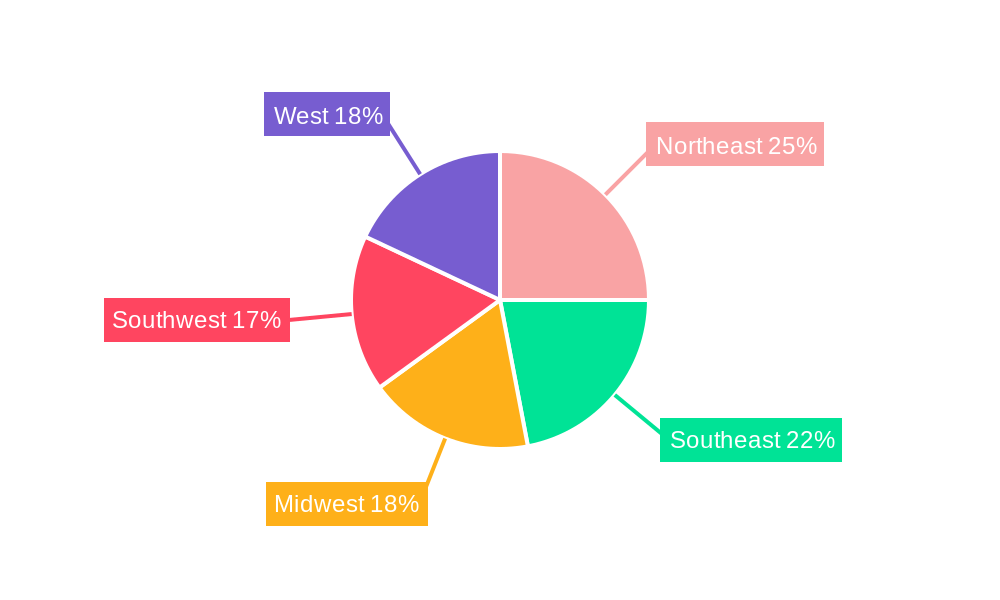
Reverse Logistics Industry in USA Regional Market Share
Geographic Coverage of Reverse Logistics Industry in USA
Reverse Logistics Industry in USA REPORT HIGHLIGHTS
| Aspects | Details |
|---|---|
| Study Period | 2020-2034 |
| Base Year | 2025 |
| Estimated Year | 2026 |
| Forecast Period | 2026-2034 |
| Historical Period | 2020-2025 |
| Growth Rate | CAGR of 6.2% from 2020-2034 |
| Segmentation |
|
Table of Contents
- 1. Introduction
- 1.1. Research Scope
- 1.2. Market Segmentation
- 1.3. Research Objective
- 1.4. Definitions and Assumptions
- 2. Executive Summary
- 2.1. Market Snapshot
- 3. Market Dynamics
- 3.1. Market Drivers
- 3.2. Market Restrains
- 3.3. Market Trends
- 3.4. Market Opportunities
- 4. Market Factor Analysis
- 4.1. Porters Five Forces
- 4.1.1. Bargaining Power of Suppliers
- 4.1.2. Bargaining Power of Buyers
- 4.1.3. Threat of New Entrants
- 4.1.4. Threat of Substitutes
- 4.1.5. Competitive Rivalry
- 4.2. PESTEL analysis
- 4.3. BCG Analysis
- 4.3.1. Stars (High Growth, High Market Share)
- 4.3.2. Cash Cows (Low Growth, High Market Share)
- 4.3.3. Question Mark (High Growth, Low Market Share)
- 4.3.4. Dogs (Low Growth, Low Market Share)
- 4.4. Ansoff Matrix Analysis
- 4.5. Supply Chain Analysis
- 4.6. Regulatory Landscape
- 4.7. Current Market Potential and Opportunity Assessment (TAM–SAM–SOM Framework)
- 4.8. TIR Analyst Note
- 4.1. Porters Five Forces
- 5. Market Analysis, Insights and Forecast 2021-2033
- 5.1. Market Analysis, Insights and Forecast - by Function
- 5.1.1. Transportation
- 5.1.1.1. Road
- 5.1.1.2. Air
- 5.1.1.3. Other Modes of Transportation
- 5.1.2. Warehous
- 5.1.3. Other Va
- 5.1.1. Transportation
- 5.2. Market Analysis, Insights and Forecast - by End User
- 5.2.1. Consumer
- 5.2.2. Automotive
- 5.2.3. Healthcare and Pharmaceuticals
- 5.2.4. Other Industrial Activity Sectors
- 5.2.5. Other End Users
- 5.3. Market Analysis, Insights and Forecast - by Region
- 5.3.1. North America
- 5.3.2. South America
- 5.3.3. Europe
- 5.3.4. Middle East & Africa
- 5.3.5. Asia Pacific
- 5.1. Market Analysis, Insights and Forecast - by Function
- 6. Global Reverse Logistics Industry in USA Analysis, Insights and Forecast, 2021-2033
- 6.1. Market Analysis, Insights and Forecast - by Function
- 6.1.1. Transportation
- 6.1.1.1. Road
- 6.1.1.2. Air
- 6.1.1.3. Other Modes of Transportation
- 6.1.2. Warehous
- 6.1.3. Other Va
- 6.1.1. Transportation
- 6.2. Market Analysis, Insights and Forecast - by End User
- 6.2.1. Consumer
- 6.2.2. Automotive
- 6.2.3. Healthcare and Pharmaceuticals
- 6.2.4. Other Industrial Activity Sectors
- 6.2.5. Other End Users
- 6.1. Market Analysis, Insights and Forecast - by Function
- 7. North America Reverse Logistics Industry in USA Analysis, Insights and Forecast, 2020-2032
- 7.1. Market Analysis, Insights and Forecast - by Function
- 7.1.1. Transportation
- 7.1.1.1. Road
- 7.1.1.2. Air
- 7.1.1.3. Other Modes of Transportation
- 7.1.2. Warehous
- 7.1.3. Other Va
- 7.1.1. Transportation
- 7.2. Market Analysis, Insights and Forecast - by End User
- 7.2.1. Consumer
- 7.2.2. Automotive
- 7.2.3. Healthcare and Pharmaceuticals
- 7.2.4. Other Industrial Activity Sectors
- 7.2.5. Other End Users
- 7.1. Market Analysis, Insights and Forecast - by Function
- 8. South America Reverse Logistics Industry in USA Analysis, Insights and Forecast, 2020-2032
- 8.1. Market Analysis, Insights and Forecast - by Function
- 8.1.1. Transportation
- 8.1.1.1. Road
- 8.1.1.2. Air
- 8.1.1.3. Other Modes of Transportation
- 8.1.2. Warehous
- 8.1.3. Other Va
- 8.1.1. Transportation
- 8.2. Market Analysis, Insights and Forecast - by End User
- 8.2.1. Consumer
- 8.2.2. Automotive
- 8.2.3. Healthcare and Pharmaceuticals
- 8.2.4. Other Industrial Activity Sectors
- 8.2.5. Other End Users
- 8.1. Market Analysis, Insights and Forecast - by Function
- 9. Europe Reverse Logistics Industry in USA Analysis, Insights and Forecast, 2020-2032
- 9.1. Market Analysis, Insights and Forecast - by Function
- 9.1.1. Transportation
- 9.1.1.1. Road
- 9.1.1.2. Air
- 9.1.1.3. Other Modes of Transportation
- 9.1.2. Warehous
- 9.1.3. Other Va
- 9.1.1. Transportation
- 9.2. Market Analysis, Insights and Forecast - by End User
- 9.2.1. Consumer
- 9.2.2. Automotive
- 9.2.3. Healthcare and Pharmaceuticals
- 9.2.4. Other Industrial Activity Sectors
- 9.2.5. Other End Users
- 9.1. Market Analysis, Insights and Forecast - by Function
- 10. Middle East & Africa Reverse Logistics Industry in USA Analysis, Insights and Forecast, 2020-2032
- 10.1. Market Analysis, Insights and Forecast - by Function
- 10.1.1. Transportation
- 10.1.1.1. Road
- 10.1.1.2. Air
- 10.1.1.3. Other Modes of Transportation
- 10.1.2. Warehous
- 10.1.3. Other Va
- 10.1.1. Transportation
- 10.2. Market Analysis, Insights and Forecast - by End User
- 10.2.1. Consumer
- 10.2.2. Automotive
- 10.2.3. Healthcare and Pharmaceuticals
- 10.2.4. Other Industrial Activity Sectors
- 10.2.5. Other End Users
- 10.1. Market Analysis, Insights and Forecast - by Function
- 11. Asia Pacific Reverse Logistics Industry in USA Analysis, Insights and Forecast, 2020-2032
- 11.1. Market Analysis, Insights and Forecast - by Function
- 11.1.1. Transportation
- 11.1.1.1. Road
- 11.1.1.2. Air
- 11.1.1.3. Other Modes of Transportation
- 11.1.2. Warehous
- 11.1.3. Other Va
- 11.1.1. Transportation
- 11.2. Market Analysis, Insights and Forecast - by End User
- 11.2.1. Consumer
- 11.2.2. Automotive
- 11.2.3. Healthcare and Pharmaceuticals
- 11.2.4. Other Industrial Activity Sectors
- 11.2.5. Other End Users
- 11.1. Market Analysis, Insights and Forecast - by Function
- 12. Competitive Analysis
- 12.1. Company Profiles
- 12.1.1 DGD Transport
- 12.1.1.1. Company Overview
- 12.1.1.2. Products
- 12.1.1.3. Company Financials
- 12.1.1.4. SWOT Analysis
- 12.1.2 DHL
- 12.1.2.1. Company Overview
- 12.1.2.2. Products
- 12.1.2.3. Company Financials
- 12.1.2.4. SWOT Analysis
- 12.1.3 A2B Fulfillment
- 12.1.3.1. Company Overview
- 12.1.3.2. Products
- 12.1.3.3. Company Financials
- 12.1.3.4. SWOT Analysis
- 12.1.4 FedEx Corporation
- 12.1.4.1. Company Overview
- 12.1.4.2. Products
- 12.1.4.3. Company Financials
- 12.1.4.4. SWOT Analysis
- 12.1.5 Yusen Logistics
- 12.1.5.1. Company Overview
- 12.1.5.2. Products
- 12.1.5.3. Company Financials
- 12.1.5.4. SWOT Analysis
- 12.1.6 United Parcel Service (UPS)
- 12.1.6.1. Company Overview
- 12.1.6.2. Products
- 12.1.6.3. Company Financials
- 12.1.6.4. SWOT Analysis
- 12.1.7 YRC Worldwide Inc
- 12.1.7.1. Company Overview
- 12.1.7.2. Products
- 12.1.7.3. Company Financials
- 12.1.7.4. SWOT Analysis
- 12.1.8 7 COMPANY PROFILES
- 12.1.8.1. Company Overview
- 12.1.8.2. Products
- 12.1.8.3. Company Financials
- 12.1.8.4. SWOT Analysis
- 12.1.9 C H Robinson Worldwide Inc
- 12.1.9.1. Company Overview
- 12.1.9.2. Products
- 12.1.9.3. Company Financials
- 12.1.9.4. SWOT Analysis
- 12.1.10 XPO Logistics
- 12.1.10.1. Company Overview
- 12.1.10.2. Products
- 12.1.10.3. Company Financials
- 12.1.10.4. SWOT Analysis
- 12.1.11 Excelsior Integrated LLC
- 12.1.11.1. Company Overview
- 12.1.11.2. Products
- 12.1.11.3. Company Financials
- 12.1.11.4. SWOT Analysis
- 12.1.12 Happy Returns Inc
- 12.1.12.1. Company Overview
- 12.1.12.2. Products
- 12.1.12.3. Company Financials
- 12.1.12.4. SWOT Analysis
- 12.1.13 American Distribution Inc
- 12.1.13.1. Company Overview
- 12.1.13.2. Products
- 12.1.13.3. Company Financials
- 12.1.13.4. SWOT Analysis
- 12.1.14 FW Logistics
- 12.1.14.1. Company Overview
- 12.1.14.2. Products
- 12.1.14.3. Company Financials
- 12.1.14.4. SWOT Analysis
- 12.1.15 Newgistics Inc
- 12.1.15.1. Company Overview
- 12.1.15.2. Products
- 12.1.15.3. Company Financials
- 12.1.15.4. SWOT Analysis
- 12.1.16 United States Postal Service (USPS)
- 12.1.16.1. Company Overview
- 12.1.16.2. Products
- 12.1.16.3. Company Financials
- 12.1.16.4. SWOT Analysis
- 12.1.17 Optoro
- 12.1.17.1. Company Overview
- 12.1.17.2. Products
- 12.1.17.3. Company Financials
- 12.1.17.4. SWOT Analysis
- 12.1.1 DGD Transport
- 12.2. Market Entropy
- 12.2.1 Company's Key Areas Served
- 12.2.2 Recent Developments
- 12.3. Company Market Share Analysis 2025
- 12.3.1 Top 5 Companies Market Share Analysis
- 12.3.2 Top 3 Companies Market Share Analysis
- 12.4. List of Potential Customers
- 13. Research Methodology
List of Figures
- Figure 1: Global Reverse Logistics Industry in USA Revenue Breakdown (undefined, %) by Region 2025 & 2033
- Figure 2: North America Reverse Logistics Industry in USA Revenue (undefined), by Function 2025 & 2033
- Figure 3: North America Reverse Logistics Industry in USA Revenue Share (%), by Function 2025 & 2033
- Figure 4: North America Reverse Logistics Industry in USA Revenue (undefined), by End User 2025 & 2033
- Figure 5: North America Reverse Logistics Industry in USA Revenue Share (%), by End User 2025 & 2033
- Figure 6: North America Reverse Logistics Industry in USA Revenue (undefined), by Country 2025 & 2033
- Figure 7: North America Reverse Logistics Industry in USA Revenue Share (%), by Country 2025 & 2033
- Figure 8: South America Reverse Logistics Industry in USA Revenue (undefined), by Function 2025 & 2033
- Figure 9: South America Reverse Logistics Industry in USA Revenue Share (%), by Function 2025 & 2033
- Figure 10: South America Reverse Logistics Industry in USA Revenue (undefined), by End User 2025 & 2033
- Figure 11: South America Reverse Logistics Industry in USA Revenue Share (%), by End User 2025 & 2033
- Figure 12: South America Reverse Logistics Industry in USA Revenue (undefined), by Country 2025 & 2033
- Figure 13: South America Reverse Logistics Industry in USA Revenue Share (%), by Country 2025 & 2033
- Figure 14: Europe Reverse Logistics Industry in USA Revenue (undefined), by Function 2025 & 2033
- Figure 15: Europe Reverse Logistics Industry in USA Revenue Share (%), by Function 2025 & 2033
- Figure 16: Europe Reverse Logistics Industry in USA Revenue (undefined), by End User 2025 & 2033
- Figure 17: Europe Reverse Logistics Industry in USA Revenue Share (%), by End User 2025 & 2033
- Figure 18: Europe Reverse Logistics Industry in USA Revenue (undefined), by Country 2025 & 2033
- Figure 19: Europe Reverse Logistics Industry in USA Revenue Share (%), by Country 2025 & 2033
- Figure 20: Middle East & Africa Reverse Logistics Industry in USA Revenue (undefined), by Function 2025 & 2033
- Figure 21: Middle East & Africa Reverse Logistics Industry in USA Revenue Share (%), by Function 2025 & 2033
- Figure 22: Middle East & Africa Reverse Logistics Industry in USA Revenue (undefined), by End User 2025 & 2033
- Figure 23: Middle East & Africa Reverse Logistics Industry in USA Revenue Share (%), by End User 2025 & 2033
- Figure 24: Middle East & Africa Reverse Logistics Industry in USA Revenue (undefined), by Country 2025 & 2033
- Figure 25: Middle East & Africa Reverse Logistics Industry in USA Revenue Share (%), by Country 2025 & 2033
- Figure 26: Asia Pacific Reverse Logistics Industry in USA Revenue (undefined), by Function 2025 & 2033
- Figure 27: Asia Pacific Reverse Logistics Industry in USA Revenue Share (%), by Function 2025 & 2033
- Figure 28: Asia Pacific Reverse Logistics Industry in USA Revenue (undefined), by End User 2025 & 2033
- Figure 29: Asia Pacific Reverse Logistics Industry in USA Revenue Share (%), by End User 2025 & 2033
- Figure 30: Asia Pacific Reverse Logistics Industry in USA Revenue (undefined), by Country 2025 & 2033
- Figure 31: Asia Pacific Reverse Logistics Industry in USA Revenue Share (%), by Country 2025 & 2033
List of Tables
- Table 1: Global Reverse Logistics Industry in USA Revenue undefined Forecast, by Function 2020 & 2033
- Table 2: Global Reverse Logistics Industry in USA Revenue undefined Forecast, by End User 2020 & 2033
- Table 3: Global Reverse Logistics Industry in USA Revenue undefined Forecast, by Region 2020 & 2033
- Table 4: Global Reverse Logistics Industry in USA Revenue undefined Forecast, by Function 2020 & 2033
- Table 5: Global Reverse Logistics Industry in USA Revenue undefined Forecast, by End User 2020 & 2033
- Table 6: Global Reverse Logistics Industry in USA Revenue undefined Forecast, by Country 2020 & 2033
- Table 7: United States Reverse Logistics Industry in USA Revenue (undefined) Forecast, by Application 2020 & 2033
- Table 8: Canada Reverse Logistics Industry in USA Revenue (undefined) Forecast, by Application 2020 & 2033
- Table 9: Mexico Reverse Logistics Industry in USA Revenue (undefined) Forecast, by Application 2020 & 2033
- Table 10: Global Reverse Logistics Industry in USA Revenue undefined Forecast, by Function 2020 & 2033
- Table 11: Global Reverse Logistics Industry in USA Revenue undefined Forecast, by End User 2020 & 2033
- Table 12: Global Reverse Logistics Industry in USA Revenue undefined Forecast, by Country 2020 & 2033
- Table 13: Brazil Reverse Logistics Industry in USA Revenue (undefined) Forecast, by Application 2020 & 2033
- Table 14: Argentina Reverse Logistics Industry in USA Revenue (undefined) Forecast, by Application 2020 & 2033
- Table 15: Rest of South America Reverse Logistics Industry in USA Revenue (undefined) Forecast, by Application 2020 & 2033
- Table 16: Global Reverse Logistics Industry in USA Revenue undefined Forecast, by Function 2020 & 2033
- Table 17: Global Reverse Logistics Industry in USA Revenue undefined Forecast, by End User 2020 & 2033
- Table 18: Global Reverse Logistics Industry in USA Revenue undefined Forecast, by Country 2020 & 2033
- Table 19: United Kingdom Reverse Logistics Industry in USA Revenue (undefined) Forecast, by Application 2020 & 2033
- Table 20: Germany Reverse Logistics Industry in USA Revenue (undefined) Forecast, by Application 2020 & 2033
- Table 21: France Reverse Logistics Industry in USA Revenue (undefined) Forecast, by Application 2020 & 2033
- Table 22: Italy Reverse Logistics Industry in USA Revenue (undefined) Forecast, by Application 2020 & 2033
- Table 23: Spain Reverse Logistics Industry in USA Revenue (undefined) Forecast, by Application 2020 & 2033
- Table 24: Russia Reverse Logistics Industry in USA Revenue (undefined) Forecast, by Application 2020 & 2033
- Table 25: Benelux Reverse Logistics Industry in USA Revenue (undefined) Forecast, by Application 2020 & 2033
- Table 26: Nordics Reverse Logistics Industry in USA Revenue (undefined) Forecast, by Application 2020 & 2033
- Table 27: Rest of Europe Reverse Logistics Industry in USA Revenue (undefined) Forecast, by Application 2020 & 2033
- Table 28: Global Reverse Logistics Industry in USA Revenue undefined Forecast, by Function 2020 & 2033
- Table 29: Global Reverse Logistics Industry in USA Revenue undefined Forecast, by End User 2020 & 2033
- Table 30: Global Reverse Logistics Industry in USA Revenue undefined Forecast, by Country 2020 & 2033
- Table 31: Turkey Reverse Logistics Industry in USA Revenue (undefined) Forecast, by Application 2020 & 2033
- Table 32: Israel Reverse Logistics Industry in USA Revenue (undefined) Forecast, by Application 2020 & 2033
- Table 33: GCC Reverse Logistics Industry in USA Revenue (undefined) Forecast, by Application 2020 & 2033
- Table 34: North Africa Reverse Logistics Industry in USA Revenue (undefined) Forecast, by Application 2020 & 2033
- Table 35: South Africa Reverse Logistics Industry in USA Revenue (undefined) Forecast, by Application 2020 & 2033
- Table 36: Rest of Middle East & Africa Reverse Logistics Industry in USA Revenue (undefined) Forecast, by Application 2020 & 2033
- Table 37: Global Reverse Logistics Industry in USA Revenue undefined Forecast, by Function 2020 & 2033
- Table 38: Global Reverse Logistics Industry in USA Revenue undefined Forecast, by End User 2020 & 2033
- Table 39: Global Reverse Logistics Industry in USA Revenue undefined Forecast, by Country 2020 & 2033
- Table 40: China Reverse Logistics Industry in USA Revenue (undefined) Forecast, by Application 2020 & 2033
- Table 41: India Reverse Logistics Industry in USA Revenue (undefined) Forecast, by Application 2020 & 2033
- Table 42: Japan Reverse Logistics Industry in USA Revenue (undefined) Forecast, by Application 2020 & 2033
- Table 43: South Korea Reverse Logistics Industry in USA Revenue (undefined) Forecast, by Application 2020 & 2033
- Table 44: ASEAN Reverse Logistics Industry in USA Revenue (undefined) Forecast, by Application 2020 & 2033
- Table 45: Oceania Reverse Logistics Industry in USA Revenue (undefined) Forecast, by Application 2020 & 2033
- Table 46: Rest of Asia Pacific Reverse Logistics Industry in USA Revenue (undefined) Forecast, by Application 2020 & 2033
Frequently Asked Questions
1. What is the projected Compound Annual Growth Rate (CAGR) of the Reverse Logistics Industry in USA?
The projected CAGR is approximately 6.2%.
2. Which companies are prominent players in the Reverse Logistics Industry in USA?
Key companies in the market include DGD Transport, DHL, A2B Fulfillment, FedEx Corporation, Yusen Logistics, United Parcel Service (UPS), YRC Worldwide Inc, 7 COMPANY PROFILES, C H Robinson Worldwide Inc, XPO Logistics, Excelsior Integrated LLC, Happy Returns Inc, American Distribution Inc, FW Logistics, Newgistics Inc, United States Postal Service (USPS), Optoro.
3. What are the main segments of the Reverse Logistics Industry in USA?
The market segments include Function, End User.
4. Can you provide details about the market size?
The market size is estimated to be USD XXX N/A as of 2022.
5. What are some drivers contributing to market growth?
N/A
6. What are the notable trends driving market growth?
Growth in E-commerce and Technology Propels the Demand for Efficient Return Logistics.
7. Are there any restraints impacting market growth?
N/A
8. Can you provide examples of recent developments in the market?
N/A
9. What pricing options are available for accessing the report?
Pricing options include single-user, multi-user, and enterprise licenses priced at USD 3800, USD 4500, and USD 5800 respectively.
10. Is the market size provided in terms of value or volume?
The market size is provided in terms of value, measured in N/A.
11. Are there any specific market keywords associated with the report?
Yes, the market keyword associated with the report is "Reverse Logistics Industry in USA," which aids in identifying and referencing the specific market segment covered.
12. How do I determine which pricing option suits my needs best?
The pricing options vary based on user requirements and access needs. Individual users may opt for single-user licenses, while businesses requiring broader access may choose multi-user or enterprise licenses for cost-effective access to the report.
13. Are there any additional resources or data provided in the Reverse Logistics Industry in USA report?
While the report offers comprehensive insights, it's advisable to review the specific contents or supplementary materials provided to ascertain if additional resources or data are available.
14. How can I stay updated on further developments or reports in the Reverse Logistics Industry in USA?
To stay informed about further developments, trends, and reports in the Reverse Logistics Industry in USA, consider subscribing to industry newsletters, following relevant companies and organizations, or regularly checking reputable industry news sources and publications.
Methodology
Step 1 - Identification of Relevant Samples Size from Population Database


Step 2 - Approaches for Defining Global Market Size (Value, Volume* & Price*)

Note*: In applicable scenarios
Step 3 - Data Sources
Primary Research
- Web Analytics
- Survey Reports
- Research Institute
- Latest Research Reports
- Opinion Leaders
Secondary Research
- Annual Reports
- White Paper
- Latest Press Release
- Industry Association
- Paid Database
- Investor Presentations

Step 4 - Data Triangulation
Involves using different sources of information in order to increase the validity of a study
These sources are likely to be stakeholders in a program - participants, other researchers, program staff, other community members, and so on.
Then we put all data in single framework & apply various statistical tools to find out the dynamic on the market.
During the analysis stage, feedback from the stakeholder groups would be compared to determine areas of agreement as well as areas of divergence