

Key Insights
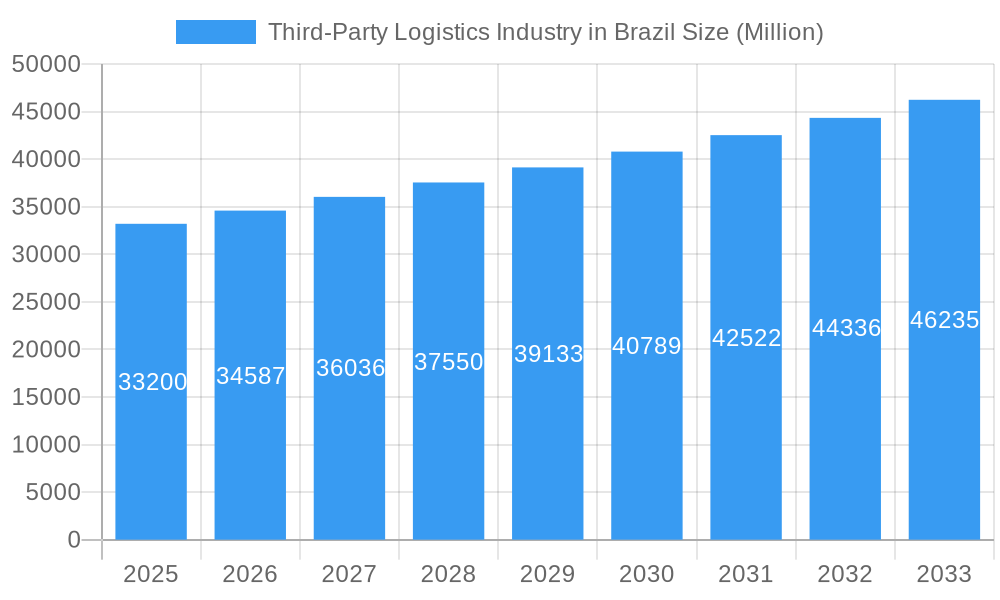
The Brazilian third-party logistics (3PL) market, valued at $33.20 billion in 2025, is experiencing robust growth, projected to expand at a compound annual growth rate (CAGR) of 4.26% from 2025 to 2033. This growth is fueled by several key factors. The burgeoning e-commerce sector in Brazil significantly increases demand for efficient warehousing, distribution, and last-mile delivery solutions, driving adoption of 3PL services. Furthermore, the increasing complexity of global supply chains, coupled with a desire for enhanced operational efficiency and cost reduction among businesses across sectors like automotive, chemicals, consumer goods, and healthcare, is pushing companies to outsource logistics functions to specialized 3PL providers. This trend is particularly pronounced amongst larger enterprises seeking to focus on core competencies. While regulatory hurdles and infrastructure limitations in certain regions present challenges, the overall market outlook remains positive, underpinned by Brazil's expanding economy and growing integration into global trade networks.
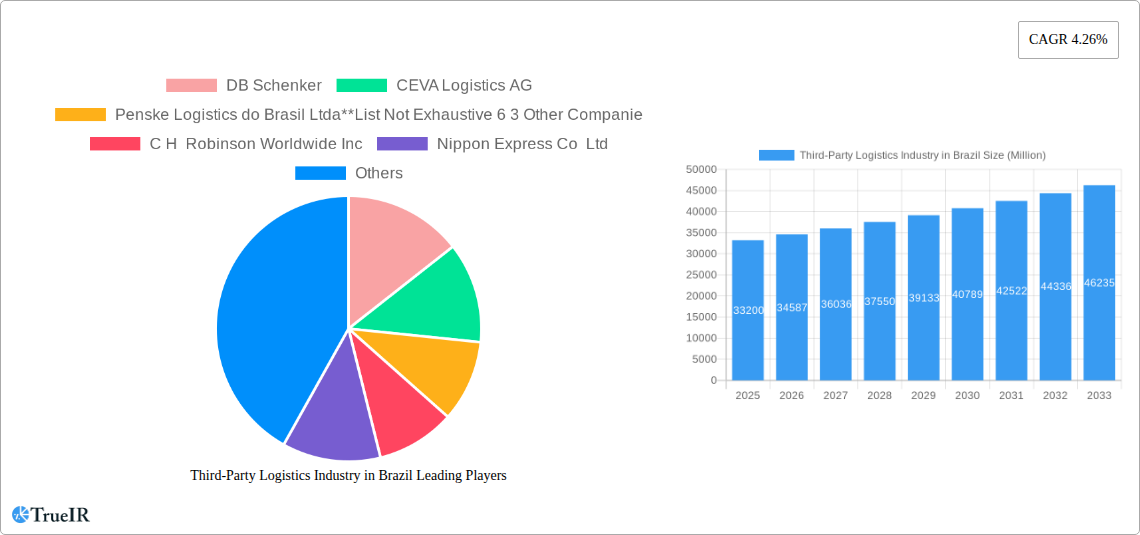
Third-Party Logistics Industry in Brazil Market Size (In Billion)
The competitive landscape is characterized by a mix of large multinational players like DB Schenker, CEVA Logistics, Kuehne + Nagel, and FedEx, alongside significant domestic providers such as BBM Logística and Gafor. This competitive dynamic fosters innovation and drives improvements in service offerings and pricing. While international transportation management and value-added warehousing services represent significant revenue streams, the market is witnessing increasing demand for specialized solutions tailored to specific industry needs. Growth in sectors like life sciences and healthcare, for example, is driving expansion within the 3PL segment focusing on temperature-controlled logistics and specialized handling requirements. This market segmentation strategy reflects an increasingly sophisticated need for 3PL providers to offer customized, value-added services to maintain their competitive advantage in a dynamic market environment.
Third-Party Logistics Industry in Brazil Company Market Share
Third-Party Logistics Industry in Brazil: A Comprehensive Market Report (2019-2033)
This dynamic report provides a comprehensive analysis of the Third-Party Logistics (3PL) industry in Brazil, projecting robust growth from 2025 to 2033. Leveraging extensive market research and data analysis from the historical period (2019-2024), the report offers invaluable insights for businesses, investors, and stakeholders seeking to understand and capitalize on the opportunities within this rapidly evolving sector. The study period covers 2019-2033, with 2025 serving as both the base and estimated year. This report utilizes rigorous methodology to forecast market trends until 2033.
Third-Party Logistics Industry in Brazil Market Structure & Competitive Landscape
The Brazilian 3PL market showcases a moderately concentrated structure, with a handful of major global players and a larger number of smaller, regional operators. The market's value in 2025 is estimated at $XX Million. Key players such as DB Schenker, CEVA Logistics AG, and Penske Logistics do Brasil Ltda hold significant market share, contributing to a Herfindahl-Hirschman Index (HHI) of approximately XX. However, the market also displays a high degree of dynamism, influenced by several factors:
- Innovation Drivers: Technological advancements in areas like automation, IoT, and AI are driving efficiency gains and transforming the industry's offerings.
- Regulatory Impacts: Government regulations impacting transportation, warehousing, and customs procedures significantly influence operational costs and market access. Recent reforms aimed at streamlining logistics have had a positive yet uneven impact across the sector.
- Product Substitutes: The emergence of specialized niche players and innovative solutions presents a competitive challenge to traditional 3PL providers.
- End-User Segmentation: The Brazilian 3PL market caters to diverse sectors, including automotive, chemicals, consumer and retail, energy, engineering and manufacturing, and life sciences. Each sector displays unique logistics demands and growth trajectories.
- M&A Trends: Consolidation is apparent, with larger players seeking to expand their market presence through acquisitions. The total value of M&A transactions in the sector between 2019 and 2024 reached approximately $XX Million, indicating a growing trend toward consolidation.
Third-Party Logistics Industry in Brazil Market Trends & Opportunities
The Brazilian 3PL market is poised for significant expansion, driven by factors such as the growth of e-commerce, the increasing complexity of global supply chains, and rising demand for value-added services. The market is expected to exhibit a Compound Annual Growth Rate (CAGR) of XX% during the forecast period (2025-2033), reaching an estimated value of $XX Million by 2033. This growth is fueled by several key trends:
The rapid expansion of e-commerce in Brazil is demanding more efficient and reliable logistics solutions. This translates into heightened demand for last-mile delivery services, warehousing, and order fulfillment capabilities, boosting the 3PL market's growth. Consumer preferences are shifting towards faster and more transparent delivery options, which necessitates the adoption of innovative technologies and streamlined processes by 3PL providers. The competitive landscape is characterized by intense rivalry, with both established players and new entrants vying for market share through technological innovation and service differentiation. Market penetration rates for various 3PL services are expected to increase substantially in the coming years, particularly within the rapidly developing e-commerce segment. This growth is significantly influenced by the rise of digital transformation, propelling innovation and operational efficiency.
Dominant Markets & Segments in Third-Party Logistics Industry in Brazil
While the Brazilian 3PL market displays robust growth across various segments, specific areas demonstrate more pronounced expansion.
- By Services: Value-added warehousing and distribution is experiencing particularly strong growth, fueled by the increasing sophistication of supply chains and the need for specialized services like inventory management, order fulfillment, and packaging. International transportation management also showcases significant growth potential, driven by Brazil's increasing trade integration with global markets.
- By End User: The consumer and retail sector represents a substantial portion of the market, driven by the surge in e-commerce and the ever-increasing demand for fast and efficient delivery services. The automotive and manufacturing sectors also exhibit significant demand for sophisticated 3PL solutions.
Key Growth Drivers:
- Infrastructure Development: Investments in port infrastructure, road networks, and intermodal transport systems are facilitating the smoother movement of goods and enhancing logistics efficiency.
- Government Policies: Initiatives aimed at simplifying customs procedures and reducing bureaucratic bottlenecks are creating a more favorable environment for 3PL providers.
Third-Party Logistics Industry in Brazil Product Analysis
The Brazilian 3PL market is witnessing continuous product innovation, characterized by the integration of cutting-edge technologies such as warehouse management systems (WMS), transportation management systems (TMS), and advanced analytics. These tools improve operational efficiency, reduce costs, and enhance transparency across the supply chain. The key differentiators in this competitive market are speed, reliability, scalability, and cost-effectiveness, which enables 3PL providers to offer comprehensive, customized logistics solutions tailored to the specific needs of diverse industries and clients.
Key Drivers, Barriers & Challenges in Third-Party Logistics Industry in Brazil
Key Drivers: Technological advancements such as AI and machine learning drive operational efficiency and cost optimization, while favorable government policies encourage investments in infrastructure. The rising growth of e-commerce and the associated demand for robust logistics and delivery services serve as a primary catalyst for market expansion.
Key Challenges: Infrastructure limitations in certain regions, particularly regarding last-mile delivery, present significant hurdles. Bureaucratic hurdles and regulatory complexities add to operational costs and delays. Furthermore, intense competition and fluctuating fuel prices exert pressure on profit margins.
Growth Drivers in the Third-Party Logistics Industry in Brazil Market
The Brazilian 3PL market is fueled by strong growth in e-commerce, ongoing infrastructural improvements, and government policies focused on trade facilitation. Technological advancements, such as automation and data analytics, further enhance efficiency and service capabilities.
Challenges Impacting Third-Party Logistics Industry in Brazil Growth
Despite considerable potential, the Brazilian 3PL market faces challenges such as uneven infrastructure development, particularly in less-developed regions, resulting in operational inefficiencies. Regulatory complexities and unpredictable policy changes create operational uncertainties and add to costs. Intense competition from both domestic and international players pressures pricing and necessitates continuous investment in service innovation.
Key Players Shaping the Third-Party Logistics Industry in Brazil Market
- DB Schenker
- CEVA Logistics AG
- Penske Logistics do Brasil Ltda
- C H Robinson Worldwide Inc
- Nippon Express Co Ltd
- Kuehne + Nagel International AG
- FedEx
- BBM Logística SA
- DSV AS
- Deutsche Post AG
- Gafor SA
Significant Third-Party Logistics Industry in Brazil Industry Milestones
- 2020: Implementation of significant infrastructure improvements in key logistics hubs.
- 2021: Launch of a major e-commerce platform, significantly impacting 3PL demand.
- 2022: Merger of two prominent regional 3PL providers, creating a larger, more integrated entity.
- 2023: Introduction of new regulations aimed at improving transparency in the logistics sector.
- 2024: Significant investment in technology by leading 3PL players.
Future Outlook for Third-Party Logistics Industry in Brazil Market
The Brazilian 3PL market is projected to experience robust growth, driven by continued e-commerce expansion, infrastructure development, and technological advancements. The increasing adoption of automation and AI-powered solutions will optimize operational efficiency and enhance service offerings. Strategic partnerships and acquisitions will play a vital role in shaping the industry's competitive landscape, unlocking significant market opportunities and driving further growth in the coming years.
Third-Party Logistics Industry in Brazil Segmentation
-
1. Services
- 1.1. Domestic Transportation Management
- 1.2. International Transportation Management
- 1.3. Value-added Warehousing and Distribution
-
2. End User
- 2.1. Automobile
- 2.2. Chemicals
- 2.3. Consumer and Retail
- 2.4. Energy
- 2.5. Engineering and Manufacturing
- 2.6. Life Science and Healthcare
- 2.7. Other End User
Third-Party Logistics Industry in Brazil Segmentation By Geography
-
1. North America
- 1.1. United States
- 1.2. Canada
- 1.3. Mexico
-
2. South America
- 2.1. Brazil
- 2.2. Argentina
- 2.3. Rest of South America
-
3. Europe
- 3.1. United Kingdom
- 3.2. Germany
- 3.3. France
- 3.4. Italy
- 3.5. Spain
- 3.6. Russia
- 3.7. Benelux
- 3.8. Nordics
- 3.9. Rest of Europe
-
4. Middle East & Africa
- 4.1. Turkey
- 4.2. Israel
- 4.3. GCC
- 4.4. North Africa
- 4.5. South Africa
- 4.6. Rest of Middle East & Africa
-
5. Asia Pacific
- 5.1. China
- 5.2. India
- 5.3. Japan
- 5.4. South Korea
- 5.5. ASEAN
- 5.6. Oceania
- 5.7. Rest of Asia Pacific
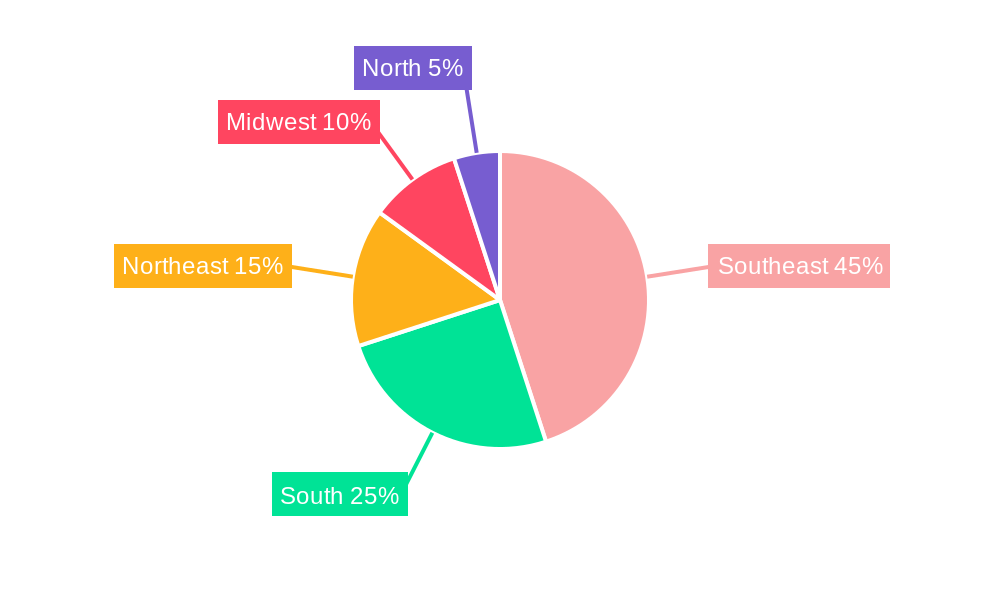
Third-Party Logistics Industry in Brazil Regional Market Share
Geographic Coverage of Third-Party Logistics Industry in Brazil
Third-Party Logistics Industry in Brazil REPORT HIGHLIGHTS
| Aspects | Details |
|---|---|
| Study Period | 2020-2034 |
| Base Year | 2025 |
| Estimated Year | 2026 |
| Forecast Period | 2026-2034 |
| Historical Period | 2020-2025 |
| Growth Rate | CAGR of 4.26% from 2020-2034 |
| Segmentation |
|
Table of Contents
- 1. Introduction
- 1.1. Research Scope
- 1.2. Market Segmentation
- 1.3. Research Objective
- 1.4. Definitions and Assumptions
- 2. Executive Summary
- 2.1. Market Snapshot
- 3. Market Dynamics
- 3.1. Market Drivers
- 3.2. Market Restrains
- 3.3. Market Trends
- 3.4. Market Opportunities
- 4. Market Factor Analysis
- 4.1. Porters Five Forces
- 4.1.1. Bargaining Power of Suppliers
- 4.1.2. Bargaining Power of Buyers
- 4.1.3. Threat of New Entrants
- 4.1.4. Threat of Substitutes
- 4.1.5. Competitive Rivalry
- 4.2. PESTEL analysis
- 4.3. BCG Analysis
- 4.3.1. Stars (High Growth, High Market Share)
- 4.3.2. Cash Cows (Low Growth, High Market Share)
- 4.3.3. Question Mark (High Growth, Low Market Share)
- 4.3.4. Dogs (Low Growth, Low Market Share)
- 4.4. Ansoff Matrix Analysis
- 4.5. Supply Chain Analysis
- 4.6. Regulatory Landscape
- 4.7. Current Market Potential and Opportunity Assessment (TAM–SAM–SOM Framework)
- 4.8. TIR Analyst Note
- 4.1. Porters Five Forces
- 5. Market Analysis, Insights and Forecast 2021-2033
- 5.1. Market Analysis, Insights and Forecast - by Services
- 5.1.1. Domestic Transportation Management
- 5.1.2. International Transportation Management
- 5.1.3. Value-added Warehousing and Distribution
- 5.2. Market Analysis, Insights and Forecast - by End User
- 5.2.1. Automobile
- 5.2.2. Chemicals
- 5.2.3. Consumer and Retail
- 5.2.4. Energy
- 5.2.5. Engineering and Manufacturing
- 5.2.6. Life Science and Healthcare
- 5.2.7. Other End User
- 5.3. Market Analysis, Insights and Forecast - by Region
- 5.3.1. North America
- 5.3.2. South America
- 5.3.3. Europe
- 5.3.4. Middle East & Africa
- 5.3.5. Asia Pacific
- 5.1. Market Analysis, Insights and Forecast - by Services
- 6. Global Third-Party Logistics Industry in Brazil Analysis, Insights and Forecast, 2021-2033
- 6.1. Market Analysis, Insights and Forecast - by Services
- 6.1.1. Domestic Transportation Management
- 6.1.2. International Transportation Management
- 6.1.3. Value-added Warehousing and Distribution
- 6.2. Market Analysis, Insights and Forecast - by End User
- 6.2.1. Automobile
- 6.2.2. Chemicals
- 6.2.3. Consumer and Retail
- 6.2.4. Energy
- 6.2.5. Engineering and Manufacturing
- 6.2.6. Life Science and Healthcare
- 6.2.7. Other End User
- 6.1. Market Analysis, Insights and Forecast - by Services
- 7. North America Third-Party Logistics Industry in Brazil Analysis, Insights and Forecast, 2020-2032
- 7.1. Market Analysis, Insights and Forecast - by Services
- 7.1.1. Domestic Transportation Management
- 7.1.2. International Transportation Management
- 7.1.3. Value-added Warehousing and Distribution
- 7.2. Market Analysis, Insights and Forecast - by End User
- 7.2.1. Automobile
- 7.2.2. Chemicals
- 7.2.3. Consumer and Retail
- 7.2.4. Energy
- 7.2.5. Engineering and Manufacturing
- 7.2.6. Life Science and Healthcare
- 7.2.7. Other End User
- 7.1. Market Analysis, Insights and Forecast - by Services
- 8. South America Third-Party Logistics Industry in Brazil Analysis, Insights and Forecast, 2020-2032
- 8.1. Market Analysis, Insights and Forecast - by Services
- 8.1.1. Domestic Transportation Management
- 8.1.2. International Transportation Management
- 8.1.3. Value-added Warehousing and Distribution
- 8.2. Market Analysis, Insights and Forecast - by End User
- 8.2.1. Automobile
- 8.2.2. Chemicals
- 8.2.3. Consumer and Retail
- 8.2.4. Energy
- 8.2.5. Engineering and Manufacturing
- 8.2.6. Life Science and Healthcare
- 8.2.7. Other End User
- 8.1. Market Analysis, Insights and Forecast - by Services
- 9. Europe Third-Party Logistics Industry in Brazil Analysis, Insights and Forecast, 2020-2032
- 9.1. Market Analysis, Insights and Forecast - by Services
- 9.1.1. Domestic Transportation Management
- 9.1.2. International Transportation Management
- 9.1.3. Value-added Warehousing and Distribution
- 9.2. Market Analysis, Insights and Forecast - by End User
- 9.2.1. Automobile
- 9.2.2. Chemicals
- 9.2.3. Consumer and Retail
- 9.2.4. Energy
- 9.2.5. Engineering and Manufacturing
- 9.2.6. Life Science and Healthcare
- 9.2.7. Other End User
- 9.1. Market Analysis, Insights and Forecast - by Services
- 10. Middle East & Africa Third-Party Logistics Industry in Brazil Analysis, Insights and Forecast, 2020-2032
- 10.1. Market Analysis, Insights and Forecast - by Services
- 10.1.1. Domestic Transportation Management
- 10.1.2. International Transportation Management
- 10.1.3. Value-added Warehousing and Distribution
- 10.2. Market Analysis, Insights and Forecast - by End User
- 10.2.1. Automobile
- 10.2.2. Chemicals
- 10.2.3. Consumer and Retail
- 10.2.4. Energy
- 10.2.5. Engineering and Manufacturing
- 10.2.6. Life Science and Healthcare
- 10.2.7. Other End User
- 10.1. Market Analysis, Insights and Forecast - by Services
- 11. Asia Pacific Third-Party Logistics Industry in Brazil Analysis, Insights and Forecast, 2020-2032
- 11.1. Market Analysis, Insights and Forecast - by Services
- 11.1.1. Domestic Transportation Management
- 11.1.2. International Transportation Management
- 11.1.3. Value-added Warehousing and Distribution
- 11.2. Market Analysis, Insights and Forecast - by End User
- 11.2.1. Automobile
- 11.2.2. Chemicals
- 11.2.3. Consumer and Retail
- 11.2.4. Energy
- 11.2.5. Engineering and Manufacturing
- 11.2.6. Life Science and Healthcare
- 11.2.7. Other End User
- 11.1. Market Analysis, Insights and Forecast - by Services
- 12. Competitive Analysis
- 12.1. Company Profiles
- 12.1.1 DB Schenker
- 12.1.1.1. Company Overview
- 12.1.1.2. Products
- 12.1.1.3. Company Financials
- 12.1.1.4. SWOT Analysis
- 12.1.2 CEVA Logistics AG
- 12.1.2.1. Company Overview
- 12.1.2.2. Products
- 12.1.2.3. Company Financials
- 12.1.2.4. SWOT Analysis
- 12.1.3 Penske Logistics do Brasil Ltda**List Not Exhaustive 6 3 Other Companie
- 12.1.3.1. Company Overview
- 12.1.3.2. Products
- 12.1.3.3. Company Financials
- 12.1.3.4. SWOT Analysis
- 12.1.4 C H Robinson Worldwide Inc
- 12.1.4.1. Company Overview
- 12.1.4.2. Products
- 12.1.4.3. Company Financials
- 12.1.4.4. SWOT Analysis
- 12.1.5 Nippon Express Co Ltd
- 12.1.5.1. Company Overview
- 12.1.5.2. Products
- 12.1.5.3. Company Financials
- 12.1.5.4. SWOT Analysis
- 12.1.6 Kuehne + Nagel International AG
- 12.1.6.1. Company Overview
- 12.1.6.2. Products
- 12.1.6.3. Company Financials
- 12.1.6.4. SWOT Analysis
- 12.1.7 FedEx
- 12.1.7.1. Company Overview
- 12.1.7.2. Products
- 12.1.7.3. Company Financials
- 12.1.7.4. SWOT Analysis
- 12.1.8 BBM Logística SA
- 12.1.8.1. Company Overview
- 12.1.8.2. Products
- 12.1.8.3. Company Financials
- 12.1.8.4. SWOT Analysis
- 12.1.9 DSV AS
- 12.1.9.1. Company Overview
- 12.1.9.2. Products
- 12.1.9.3. Company Financials
- 12.1.9.4. SWOT Analysis
- 12.1.10 Deutsche Post AG
- 12.1.10.1. Company Overview
- 12.1.10.2. Products
- 12.1.10.3. Company Financials
- 12.1.10.4. SWOT Analysis
- 12.1.11 Gafor SA
- 12.1.11.1. Company Overview
- 12.1.11.2. Products
- 12.1.11.3. Company Financials
- 12.1.11.4. SWOT Analysis
- 12.1.1 DB Schenker
- 12.2. Market Entropy
- 12.2.1 Company's Key Areas Served
- 12.2.2 Recent Developments
- 12.3. Company Market Share Analysis 2025
- 12.3.1 Top 5 Companies Market Share Analysis
- 12.3.2 Top 3 Companies Market Share Analysis
- 12.4. List of Potential Customers
- 13. Research Methodology
List of Figures
- Figure 1: Global Third-Party Logistics Industry in Brazil Revenue Breakdown (Million, %) by Region 2025 & 2033
- Figure 2: North America Third-Party Logistics Industry in Brazil Revenue (Million), by Services 2025 & 2033
- Figure 3: North America Third-Party Logistics Industry in Brazil Revenue Share (%), by Services 2025 & 2033
- Figure 4: North America Third-Party Logistics Industry in Brazil Revenue (Million), by End User 2025 & 2033
- Figure 5: North America Third-Party Logistics Industry in Brazil Revenue Share (%), by End User 2025 & 2033
- Figure 6: North America Third-Party Logistics Industry in Brazil Revenue (Million), by Country 2025 & 2033
- Figure 7: North America Third-Party Logistics Industry in Brazil Revenue Share (%), by Country 2025 & 2033
- Figure 8: South America Third-Party Logistics Industry in Brazil Revenue (Million), by Services 2025 & 2033
- Figure 9: South America Third-Party Logistics Industry in Brazil Revenue Share (%), by Services 2025 & 2033
- Figure 10: South America Third-Party Logistics Industry in Brazil Revenue (Million), by End User 2025 & 2033
- Figure 11: South America Third-Party Logistics Industry in Brazil Revenue Share (%), by End User 2025 & 2033
- Figure 12: South America Third-Party Logistics Industry in Brazil Revenue (Million), by Country 2025 & 2033
- Figure 13: South America Third-Party Logistics Industry in Brazil Revenue Share (%), by Country 2025 & 2033
- Figure 14: Europe Third-Party Logistics Industry in Brazil Revenue (Million), by Services 2025 & 2033
- Figure 15: Europe Third-Party Logistics Industry in Brazil Revenue Share (%), by Services 2025 & 2033
- Figure 16: Europe Third-Party Logistics Industry in Brazil Revenue (Million), by End User 2025 & 2033
- Figure 17: Europe Third-Party Logistics Industry in Brazil Revenue Share (%), by End User 2025 & 2033
- Figure 18: Europe Third-Party Logistics Industry in Brazil Revenue (Million), by Country 2025 & 2033
- Figure 19: Europe Third-Party Logistics Industry in Brazil Revenue Share (%), by Country 2025 & 2033
- Figure 20: Middle East & Africa Third-Party Logistics Industry in Brazil Revenue (Million), by Services 2025 & 2033
- Figure 21: Middle East & Africa Third-Party Logistics Industry in Brazil Revenue Share (%), by Services 2025 & 2033
- Figure 22: Middle East & Africa Third-Party Logistics Industry in Brazil Revenue (Million), by End User 2025 & 2033
- Figure 23: Middle East & Africa Third-Party Logistics Industry in Brazil Revenue Share (%), by End User 2025 & 2033
- Figure 24: Middle East & Africa Third-Party Logistics Industry in Brazil Revenue (Million), by Country 2025 & 2033
- Figure 25: Middle East & Africa Third-Party Logistics Industry in Brazil Revenue Share (%), by Country 2025 & 2033
- Figure 26: Asia Pacific Third-Party Logistics Industry in Brazil Revenue (Million), by Services 2025 & 2033
- Figure 27: Asia Pacific Third-Party Logistics Industry in Brazil Revenue Share (%), by Services 2025 & 2033
- Figure 28: Asia Pacific Third-Party Logistics Industry in Brazil Revenue (Million), by End User 2025 & 2033
- Figure 29: Asia Pacific Third-Party Logistics Industry in Brazil Revenue Share (%), by End User 2025 & 2033
- Figure 30: Asia Pacific Third-Party Logistics Industry in Brazil Revenue (Million), by Country 2025 & 2033
- Figure 31: Asia Pacific Third-Party Logistics Industry in Brazil Revenue Share (%), by Country 2025 & 2033
List of Tables
- Table 1: Global Third-Party Logistics Industry in Brazil Revenue Million Forecast, by Services 2020 & 2033
- Table 2: Global Third-Party Logistics Industry in Brazil Revenue Million Forecast, by End User 2020 & 2033
- Table 3: Global Third-Party Logistics Industry in Brazil Revenue Million Forecast, by Region 2020 & 2033
- Table 4: Global Third-Party Logistics Industry in Brazil Revenue Million Forecast, by Services 2020 & 2033
- Table 5: Global Third-Party Logistics Industry in Brazil Revenue Million Forecast, by End User 2020 & 2033
- Table 6: Global Third-Party Logistics Industry in Brazil Revenue Million Forecast, by Country 2020 & 2033
- Table 7: United States Third-Party Logistics Industry in Brazil Revenue (Million) Forecast, by Application 2020 & 2033
- Table 8: Canada Third-Party Logistics Industry in Brazil Revenue (Million) Forecast, by Application 2020 & 2033
- Table 9: Mexico Third-Party Logistics Industry in Brazil Revenue (Million) Forecast, by Application 2020 & 2033
- Table 10: Global Third-Party Logistics Industry in Brazil Revenue Million Forecast, by Services 2020 & 2033
- Table 11: Global Third-Party Logistics Industry in Brazil Revenue Million Forecast, by End User 2020 & 2033
- Table 12: Global Third-Party Logistics Industry in Brazil Revenue Million Forecast, by Country 2020 & 2033
- Table 13: Brazil Third-Party Logistics Industry in Brazil Revenue (Million) Forecast, by Application 2020 & 2033
- Table 14: Argentina Third-Party Logistics Industry in Brazil Revenue (Million) Forecast, by Application 2020 & 2033
- Table 15: Rest of South America Third-Party Logistics Industry in Brazil Revenue (Million) Forecast, by Application 2020 & 2033
- Table 16: Global Third-Party Logistics Industry in Brazil Revenue Million Forecast, by Services 2020 & 2033
- Table 17: Global Third-Party Logistics Industry in Brazil Revenue Million Forecast, by End User 2020 & 2033
- Table 18: Global Third-Party Logistics Industry in Brazil Revenue Million Forecast, by Country 2020 & 2033
- Table 19: United Kingdom Third-Party Logistics Industry in Brazil Revenue (Million) Forecast, by Application 2020 & 2033
- Table 20: Germany Third-Party Logistics Industry in Brazil Revenue (Million) Forecast, by Application 2020 & 2033
- Table 21: France Third-Party Logistics Industry in Brazil Revenue (Million) Forecast, by Application 2020 & 2033
- Table 22: Italy Third-Party Logistics Industry in Brazil Revenue (Million) Forecast, by Application 2020 & 2033
- Table 23: Spain Third-Party Logistics Industry in Brazil Revenue (Million) Forecast, by Application 2020 & 2033
- Table 24: Russia Third-Party Logistics Industry in Brazil Revenue (Million) Forecast, by Application 2020 & 2033
- Table 25: Benelux Third-Party Logistics Industry in Brazil Revenue (Million) Forecast, by Application 2020 & 2033
- Table 26: Nordics Third-Party Logistics Industry in Brazil Revenue (Million) Forecast, by Application 2020 & 2033
- Table 27: Rest of Europe Third-Party Logistics Industry in Brazil Revenue (Million) Forecast, by Application 2020 & 2033
- Table 28: Global Third-Party Logistics Industry in Brazil Revenue Million Forecast, by Services 2020 & 2033
- Table 29: Global Third-Party Logistics Industry in Brazil Revenue Million Forecast, by End User 2020 & 2033
- Table 30: Global Third-Party Logistics Industry in Brazil Revenue Million Forecast, by Country 2020 & 2033
- Table 31: Turkey Third-Party Logistics Industry in Brazil Revenue (Million) Forecast, by Application 2020 & 2033
- Table 32: Israel Third-Party Logistics Industry in Brazil Revenue (Million) Forecast, by Application 2020 & 2033
- Table 33: GCC Third-Party Logistics Industry in Brazil Revenue (Million) Forecast, by Application 2020 & 2033
- Table 34: North Africa Third-Party Logistics Industry in Brazil Revenue (Million) Forecast, by Application 2020 & 2033
- Table 35: South Africa Third-Party Logistics Industry in Brazil Revenue (Million) Forecast, by Application 2020 & 2033
- Table 36: Rest of Middle East & Africa Third-Party Logistics Industry in Brazil Revenue (Million) Forecast, by Application 2020 & 2033
- Table 37: Global Third-Party Logistics Industry in Brazil Revenue Million Forecast, by Services 2020 & 2033
- Table 38: Global Third-Party Logistics Industry in Brazil Revenue Million Forecast, by End User 2020 & 2033
- Table 39: Global Third-Party Logistics Industry in Brazil Revenue Million Forecast, by Country 2020 & 2033
- Table 40: China Third-Party Logistics Industry in Brazil Revenue (Million) Forecast, by Application 2020 & 2033
- Table 41: India Third-Party Logistics Industry in Brazil Revenue (Million) Forecast, by Application 2020 & 2033
- Table 42: Japan Third-Party Logistics Industry in Brazil Revenue (Million) Forecast, by Application 2020 & 2033
- Table 43: South Korea Third-Party Logistics Industry in Brazil Revenue (Million) Forecast, by Application 2020 & 2033
- Table 44: ASEAN Third-Party Logistics Industry in Brazil Revenue (Million) Forecast, by Application 2020 & 2033
- Table 45: Oceania Third-Party Logistics Industry in Brazil Revenue (Million) Forecast, by Application 2020 & 2033
- Table 46: Rest of Asia Pacific Third-Party Logistics Industry in Brazil Revenue (Million) Forecast, by Application 2020 & 2033
Frequently Asked Questions
1. What is the projected Compound Annual Growth Rate (CAGR) of the Third-Party Logistics Industry in Brazil?
The projected CAGR is approximately 4.26%.
2. Which companies are prominent players in the Third-Party Logistics Industry in Brazil?
Key companies in the market include DB Schenker, CEVA Logistics AG, Penske Logistics do Brasil Ltda**List Not Exhaustive 6 3 Other Companie, C H Robinson Worldwide Inc, Nippon Express Co Ltd, Kuehne + Nagel International AG, FedEx, BBM Logística SA, DSV AS, Deutsche Post AG, Gafor SA.
3. What are the main segments of the Third-Party Logistics Industry in Brazil?
The market segments include Services, End User.
4. Can you provide details about the market size?
The market size is estimated to be USD 33.20 Million as of 2022.
5. What are some drivers contributing to market growth?
E-commerce Fueling the Growth of 3PL Market.
6. What are the notable trends driving market growth?
Increasing Freight Trucking is Driving Market Growth.
7. Are there any restraints impacting market growth?
Slow Infrastructure Development.
8. Can you provide examples of recent developments in the market?
N/A
9. What pricing options are available for accessing the report?
Pricing options include single-user, multi-user, and enterprise licenses priced at USD 3800, USD 4500, and USD 5800 respectively.
10. Is the market size provided in terms of value or volume?
The market size is provided in terms of value, measured in Million.
11. Are there any specific market keywords associated with the report?
Yes, the market keyword associated with the report is "Third-Party Logistics Industry in Brazil," which aids in identifying and referencing the specific market segment covered.
12. How do I determine which pricing option suits my needs best?
The pricing options vary based on user requirements and access needs. Individual users may opt for single-user licenses, while businesses requiring broader access may choose multi-user or enterprise licenses for cost-effective access to the report.
13. Are there any additional resources or data provided in the Third-Party Logistics Industry in Brazil report?
While the report offers comprehensive insights, it's advisable to review the specific contents or supplementary materials provided to ascertain if additional resources or data are available.
14. How can I stay updated on further developments or reports in the Third-Party Logistics Industry in Brazil?
To stay informed about further developments, trends, and reports in the Third-Party Logistics Industry in Brazil, consider subscribing to industry newsletters, following relevant companies and organizations, or regularly checking reputable industry news sources and publications.
Methodology
Step 1 - Identification of Relevant Samples Size from Population Database


Step 2 - Approaches for Defining Global Market Size (Value, Volume* & Price*)

Note*: In applicable scenarios
Step 3 - Data Sources
Primary Research
- Web Analytics
- Survey Reports
- Research Institute
- Latest Research Reports
- Opinion Leaders
Secondary Research
- Annual Reports
- White Paper
- Latest Press Release
- Industry Association
- Paid Database
- Investor Presentations

Step 4 - Data Triangulation
Involves using different sources of information in order to increase the validity of a study
These sources are likely to be stakeholders in a program - participants, other researchers, program staff, other community members, and so on.
Then we put all data in single framework & apply various statistical tools to find out the dynamic on the market.
During the analysis stage, feedback from the stakeholder groups would be compared to determine areas of agreement as well as areas of divergence