

Key Insights
The US digital freight management market is experiencing robust growth, projected to reach a substantial size driven by increasing adoption of technology within the logistics sector. The market's Compound Annual Growth Rate (CAGR) of 21.72% from 2019 to 2024 suggests significant expansion, with a market size of $6.89 billion in 2024. This growth is fueled by several key factors. Firstly, the increasing demand for enhanced supply chain visibility and efficiency is driving businesses to adopt digital freight management platforms. These platforms offer real-time tracking, automated processes, and data-driven insights, ultimately reducing operational costs and improving delivery times. Secondly, the rise of e-commerce and the consequent surge in freight volumes are creating a need for sophisticated management systems capable of handling the complexity of modern logistics. Thirdly, the increasing adoption of digital tools by SMEs, large enterprises, and government agencies, across all modes of transportation (ocean, air, and land), is accelerating market penetration. The competitive landscape includes both established players like Kuehne + Nagel, DHL, and Expeditors, and innovative startups like Flexport and Forto, each vying for market share with their unique offerings. The regional distribution within the US likely reflects the concentration of economic activity, with regions like the Northeast and West potentially holding larger market shares due to higher population density and industrial activity.
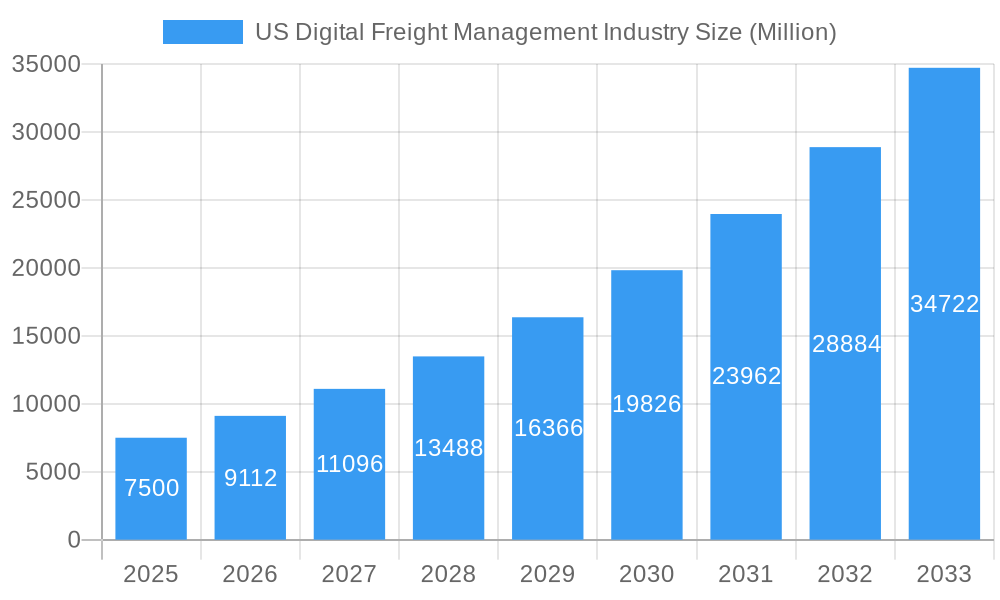
US Digital Freight Management Industry Market Size (In Billion)
Looking forward, the market's trajectory indicates continued strong growth through 2033. The ongoing digitalization of the logistics sector, coupled with advancements in artificial intelligence and machine learning, will further enhance the capabilities of digital freight management solutions, leading to increased adoption rates. While potential restraints like cybersecurity concerns and the need for seamless integration with existing systems exist, the overall market outlook remains positive, with significant opportunities for growth and innovation. The fragmented nature of the market provides ample space for market players to explore niche segments, potentially focusing on specific industry verticals or transportation modes, to gain a competitive edge. The continuous development of advanced technologies, such as blockchain for enhanced security and IoT for real-time tracking, will further shape the market's future.
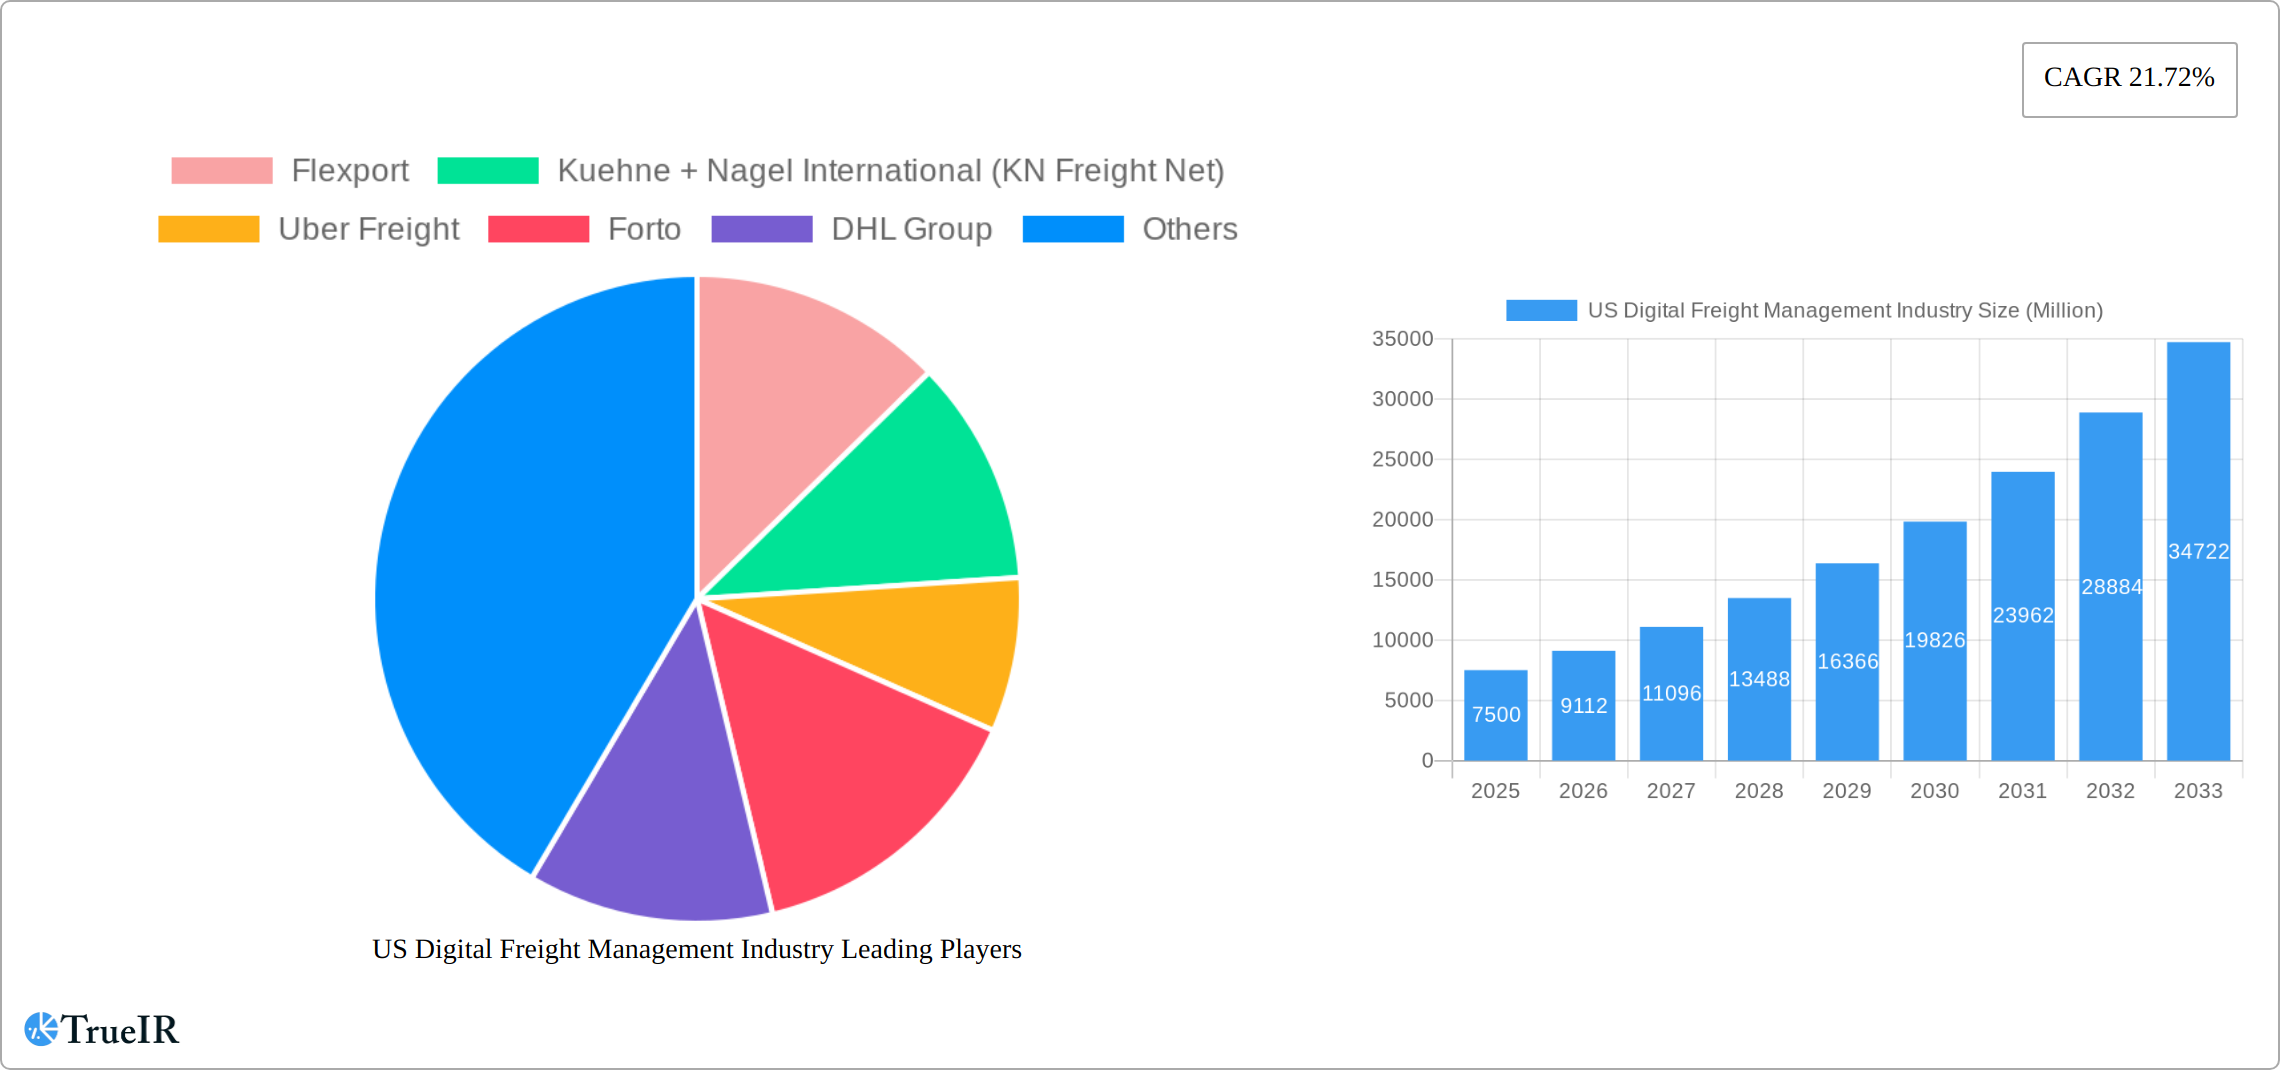
US Digital Freight Management Industry Company Market Share
US Digital Freight Management Industry: Market Report 2019-2033
This comprehensive report provides a detailed analysis of the dynamic US digital freight management industry, offering invaluable insights for stakeholders seeking to navigate this rapidly evolving landscape. With a focus on market size, key players, emerging trends, and future projections, this report is an essential resource for investors, businesses, and policymakers. The study period spans 2019-2033, with 2025 serving as the base and estimated year.
US Digital Freight Management Industry Market Structure & Competitive Landscape
The US digital freight management market is characterized by a mix of established industry giants and agile startups, creating a dynamic and competitive landscape. Market concentration is moderate, with a few dominant players holding significant market share but a substantial number of smaller companies actively competing. The Herfindahl-Hirschman Index (HHI) for 2024 is estimated at xx, indicating a moderately concentrated market. Innovation is a key driver, fueled by advancements in technologies like AI, blockchain, and IoT, which are transforming logistics operations and enhancing efficiency.
Regulatory changes, including those related to data privacy and cybersecurity, significantly impact market players. The emergence of substitute products and services, such as alternative transportation modes and optimized routing software, also presents challenges. The market is segmented by firm type (SMEs, large enterprises, and governments) and mode of transportation (ocean, air, and land). Mergers and acquisitions (M&A) activity is substantial, with xx deals recorded in the past five years, indicating a drive towards consolidation and expansion. For instance, the recent merger of Transplace and Uber Freight in 2022 signifies a significant shift in the market structure. This activity is driven by the need to enhance technological capabilities and scale operations to compete effectively.
US Digital Freight Management Industry Market Trends & Opportunities
The US digital freight management market is experiencing robust growth, with the market size estimated at $xx Million in 2025. The Compound Annual Growth Rate (CAGR) is projected at xx% from 2025 to 2033, driven by several factors. Technological advancements, particularly in areas like AI-powered route optimization and predictive analytics, are improving efficiency and reducing costs, creating significant opportunities for growth. A shift in consumer preferences towards faster and more transparent shipping options is also boosting demand for digital freight management solutions. Increased e-commerce activity, especially during and after the pandemic, has further fueled market expansion. The market penetration rate for digital freight management solutions is currently at xx% and expected to reach xx% by 2033. Competitive dynamics are highly active, with established players facing pressure from innovative startups and new entrants. This necessitates continuous technological advancements and diversification of service offerings to maintain a competitive edge.
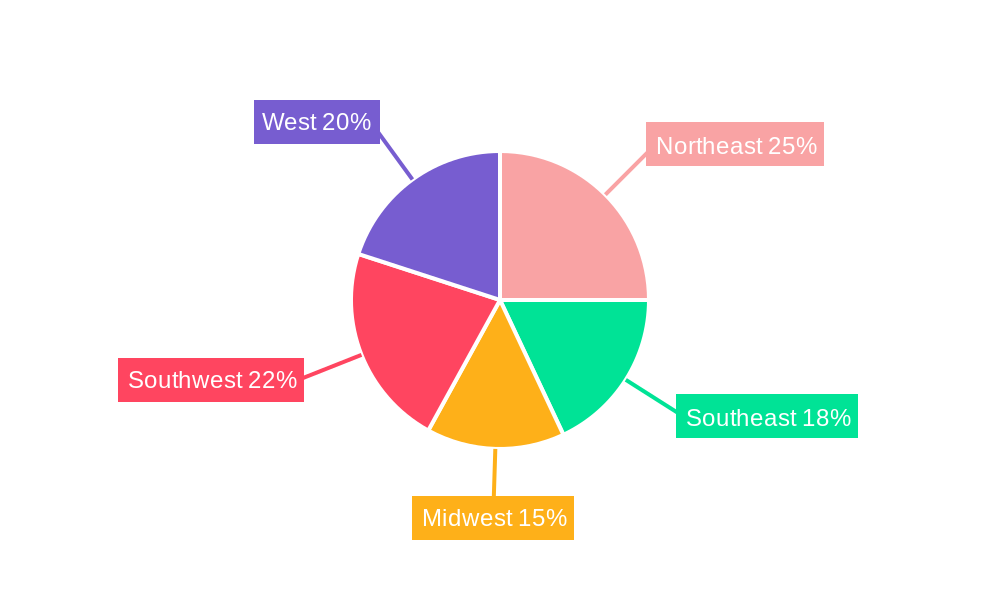
Dominant Markets & Segments in US Digital Freight Management Industry
The US digital freight management market is geographically diverse, with significant growth observed across various regions. However, the largest segment is currently the land transportation sector, due to the extensive road network and high volume of domestic shipments. The market is also segmented by firm type:
- Large Enterprises: This segment constitutes the largest portion of the market, driven by the need for efficient logistics solutions to manage complex supply chains. Key growth drivers include investments in advanced technologies, and the ongoing focus on supply chain optimization and efficiency.
- SMEs: This segment is characterized by rapid growth due to increasing adoption of digital freight management solutions to compete effectively and reduce costs. Government initiatives and programs promoting digitalization play an important role.
- Government: Government agencies are increasingly adopting digital freight management tools to improve the efficiency and transparency of their logistics operations. This segment experiences moderate yet stable growth.
By mode of transportation:
- Land: This dominates the market due to its widespread use for intra-state and interstate shipping, driving strong demand for digital freight solutions. Growth is driven by increasing e-commerce activities and expansion of road infrastructure.
- Ocean: This segment showcases significant growth potential, driven by globalization of trade and increasing demand for efficient and reliable ocean freight transportation.
- Air: This segment demonstrates moderate growth, primarily driven by the need for fast delivery of time-sensitive goods. However, higher costs and stringent regulations limit the market size.
US Digital Freight Management Industry Product Analysis
The US digital freight management market encompasses a diverse range of products, including Transportation Management Systems (TMS), Freight Brokerage Platforms, Visibility and Tracking Solutions, and specialized software for specific freight modes. These solutions leverage cutting-edge technologies such as Artificial Intelligence (AI), machine learning (ML), blockchain, and the Internet of Things (IoT) to deliver unparalleled efficiency, transparency, and cost optimization throughout the supply chain. A key competitive differentiator lies in the sophistication of algorithms employed for route optimization, predictive maintenance, and real-time tracking, alongside the breadth of network coverage and seamless integration of data analytics. This enables superior decision-making, proactive risk management, and dynamic adjustments to fluctuating market conditions. The market is characterized by continuous product innovation, with new features and functionalities regularly introduced to address evolving industry demands and maintain a competitive edge. This includes features such as advanced predictive modeling for capacity planning, enhanced driver management tools, and improved integration with existing enterprise resource planning (ERP) systems.
Key Drivers, Barriers & Challenges in US Digital Freight Management Industry
Key Drivers:
- Technological Advancements: AI-powered route optimization, predictive analytics, real-time tracking, and advanced automation are significantly increasing efficiency and lowering operational costs. The integration of IoT devices provides granular visibility into asset location and condition.
- E-commerce Growth: The unrelenting surge in online retail continues to fuel demand for faster, more reliable, and cost-effective shipping options, driving adoption of digital freight management solutions.
- Government Initiatives: Regulatory changes and financial incentives designed to promote digital adoption and infrastructure improvements are fostering market expansion and encouraging the integration of new technologies.
- Demand for Supply Chain Resilience: Recent global disruptions have underscored the critical need for robust and adaptable digital solutions capable of mitigating risks and improving supply chain visibility, leading to increased investment in these technologies.
Challenges:
- Supply Chain Disruptions: Geopolitical instability, unforeseen events (like pandemics), and extreme weather patterns continue to disrupt supply chains, emphasizing the need for resilient digital solutions. These disruptions lead to increased operational costs and require agile responses.
- Cybersecurity and Data Privacy: Growing concerns about data breaches and compliance with stringent cybersecurity regulations present significant challenges for businesses adopting digital freight management solutions, necessitating robust security measures and compliance frameworks.
- Integration Complexity: Integrating digital freight management systems with legacy systems and diverse data sources can be complex and time-consuming, requiring substantial investment in IT infrastructure and expertise.
- Talent Acquisition and Retention: The industry faces a shortage of skilled professionals proficient in managing and interpreting the vast amounts of data generated by these systems. Attracting and retaining this talent is critical for successful implementation and utilization.
Growth Drivers in the US Digital Freight Management Industry Market
The US digital freight management market is experiencing robust growth driven by a confluence of factors. Technological advancements, including AI, blockchain, and IoT, are revolutionizing logistics operations. The explosive growth of the e-commerce sector fuels demand for efficient and reliable shipping, while government initiatives promoting digital adoption further accelerate market expansion. Increased focus on sustainability and carbon footprint reduction is also driving adoption of technologies that optimize routes and reduce fuel consumption. Furthermore, the need for enhanced supply chain visibility and resilience in the face of global uncertainties significantly contributes to market growth.
Challenges Impacting US Digital Freight Management Industry Growth
Regulatory complexities, especially those surrounding data privacy and cybersecurity, create barriers. Supply chain disruptions cause delays and increased costs. Intense competition puts pressure on profit margins.
Key Players Shaping the US Digital Freight Management Industry Market
- Flexport
- Kuehne + Nagel International (KN Freight Net)
- Uber Freight
- Forto
- DHL Group
- Agility Logistics Pvt Ltd
- Expeditors International
- InstaFreight
- Turvo
- iContainers
- Twill
- NYSHEX
- Transporteca
- uShip
- Convoy
- Kontainers
- Project44
- FourKites
Significant US Digital Freight Management Industry Industry Milestones
- October 2022: Transplace and Uber Freight merger, creating a large network demand and supply platform.
- September 2022: Kuehne+Nagel announces a new healthcare contract logistics network in the US.
Future Outlook for US Digital Freight Management Industry Market
The US digital freight management market is poised for continued strong growth, driven by technological innovations, e-commerce expansion, and supportive government policies. Strategic opportunities exist for companies focusing on automation, AI-driven optimization, and enhanced supply chain visibility. The market's potential is vast, with increasing adoption expected across all segments, paving the way for further consolidation and growth in the coming years.
US Digital Freight Management Industry Segmentation
-
1. Mode of Transportation
- 1.1. Ocean
- 1.2. Air
- 1.3. Land
-
2. Firm Type
- 2.1. SMEs
- 2.2. Large Enterprises and Governments
US Digital Freight Management Industry Segmentation By Geography
-
1. North America
- 1.1. United States
- 1.2. Canada
- 1.3. Mexico
-
2. South America
- 2.1. Brazil
- 2.2. Argentina
- 2.3. Rest of South America
-
3. Europe
- 3.1. United Kingdom
- 3.2. Germany
- 3.3. France
- 3.4. Italy
- 3.5. Spain
- 3.6. Russia
- 3.7. Benelux
- 3.8. Nordics
- 3.9. Rest of Europe
-
4. Middle East & Africa
- 4.1. Turkey
- 4.2. Israel
- 4.3. GCC
- 4.4. North Africa
- 4.5. South Africa
- 4.6. Rest of Middle East & Africa
-
5. Asia Pacific
- 5.1. China
- 5.2. India
- 5.3. Japan
- 5.4. South Korea
- 5.5. ASEAN
- 5.6. Oceania
- 5.7. Rest of Asia Pacific
US Digital Freight Management Industry Regional Market Share
Geographic Coverage of US Digital Freight Management Industry
US Digital Freight Management Industry REPORT HIGHLIGHTS
| Aspects | Details |
|---|---|
| Study Period | 2020-2034 |
| Base Year | 2025 |
| Estimated Year | 2026 |
| Forecast Period | 2026-2034 |
| Historical Period | 2020-2025 |
| Growth Rate | CAGR of 21.72% from 2020-2034 |
| Segmentation |
|
Table of Contents
- 1. Introduction
- 1.1. Research Scope
- 1.2. Market Segmentation
- 1.3. Research Objective
- 1.4. Definitions and Assumptions
- 2. Executive Summary
- 2.1. Market Snapshot
- 3. Market Dynamics
- 3.1. Market Drivers
- 3.2. Market Restrains
- 3.3. Market Trends
- 3.4. Market Opportunities
- 4. Market Factor Analysis
- 4.1. Porters Five Forces
- 4.1.1. Bargaining Power of Suppliers
- 4.1.2. Bargaining Power of Buyers
- 4.1.3. Threat of New Entrants
- 4.1.4. Threat of Substitutes
- 4.1.5. Competitive Rivalry
- 4.2. PESTEL analysis
- 4.3. BCG Analysis
- 4.3.1. Stars (High Growth, High Market Share)
- 4.3.2. Cash Cows (Low Growth, High Market Share)
- 4.3.3. Question Mark (High Growth, Low Market Share)
- 4.3.4. Dogs (Low Growth, Low Market Share)
- 4.4. Ansoff Matrix Analysis
- 4.5. Supply Chain Analysis
- 4.6. Regulatory Landscape
- 4.7. Current Market Potential and Opportunity Assessment (TAM–SAM–SOM Framework)
- 4.8. TIR Analyst Note
- 4.1. Porters Five Forces
- 5. Market Analysis, Insights and Forecast 2021-2033
- 5.1. Market Analysis, Insights and Forecast - by Mode of Transportation
- 5.1.1. Ocean
- 5.1.2. Air
- 5.1.3. Land
- 5.2. Market Analysis, Insights and Forecast - by Firm Type
- 5.2.1. SMEs
- 5.2.2. Large Enterprises and Governments
- 5.3. Market Analysis, Insights and Forecast - by Region
- 5.3.1. North America
- 5.3.2. South America
- 5.3.3. Europe
- 5.3.4. Middle East & Africa
- 5.3.5. Asia Pacific
- 5.1. Market Analysis, Insights and Forecast - by Mode of Transportation
- 6. Global US Digital Freight Management Industry Analysis, Insights and Forecast, 2021-2033
- 6.1. Market Analysis, Insights and Forecast - by Mode of Transportation
- 6.1.1. Ocean
- 6.1.2. Air
- 6.1.3. Land
- 6.2. Market Analysis, Insights and Forecast - by Firm Type
- 6.2.1. SMEs
- 6.2.2. Large Enterprises and Governments
- 6.1. Market Analysis, Insights and Forecast - by Mode of Transportation
- 7. North America US Digital Freight Management Industry Analysis, Insights and Forecast, 2020-2032
- 7.1. Market Analysis, Insights and Forecast - by Mode of Transportation
- 7.1.1. Ocean
- 7.1.2. Air
- 7.1.3. Land
- 7.2. Market Analysis, Insights and Forecast - by Firm Type
- 7.2.1. SMEs
- 7.2.2. Large Enterprises and Governments
- 7.1. Market Analysis, Insights and Forecast - by Mode of Transportation
- 8. South America US Digital Freight Management Industry Analysis, Insights and Forecast, 2020-2032
- 8.1. Market Analysis, Insights and Forecast - by Mode of Transportation
- 8.1.1. Ocean
- 8.1.2. Air
- 8.1.3. Land
- 8.2. Market Analysis, Insights and Forecast - by Firm Type
- 8.2.1. SMEs
- 8.2.2. Large Enterprises and Governments
- 8.1. Market Analysis, Insights and Forecast - by Mode of Transportation
- 9. Europe US Digital Freight Management Industry Analysis, Insights and Forecast, 2020-2032
- 9.1. Market Analysis, Insights and Forecast - by Mode of Transportation
- 9.1.1. Ocean
- 9.1.2. Air
- 9.1.3. Land
- 9.2. Market Analysis, Insights and Forecast - by Firm Type
- 9.2.1. SMEs
- 9.2.2. Large Enterprises and Governments
- 9.1. Market Analysis, Insights and Forecast - by Mode of Transportation
- 10. Middle East & Africa US Digital Freight Management Industry Analysis, Insights and Forecast, 2020-2032
- 10.1. Market Analysis, Insights and Forecast - by Mode of Transportation
- 10.1.1. Ocean
- 10.1.2. Air
- 10.1.3. Land
- 10.2. Market Analysis, Insights and Forecast - by Firm Type
- 10.2.1. SMEs
- 10.2.2. Large Enterprises and Governments
- 10.1. Market Analysis, Insights and Forecast - by Mode of Transportation
- 11. Asia Pacific US Digital Freight Management Industry Analysis, Insights and Forecast, 2020-2032
- 11.1. Market Analysis, Insights and Forecast - by Mode of Transportation
- 11.1.1. Ocean
- 11.1.2. Air
- 11.1.3. Land
- 11.2. Market Analysis, Insights and Forecast - by Firm Type
- 11.2.1. SMEs
- 11.2.2. Large Enterprises and Governments
- 11.1. Market Analysis, Insights and Forecast - by Mode of Transportation
- 12. Competitive Analysis
- 12.1. Company Profiles
- 12.1.1 Flexport
- 12.1.1.1. Company Overview
- 12.1.1.2. Products
- 12.1.1.3. Company Financials
- 12.1.1.4. SWOT Analysis
- 12.1.2 Kuehne + Nagel International (KN Freight Net)
- 12.1.2.1. Company Overview
- 12.1.2.2. Products
- 12.1.2.3. Company Financials
- 12.1.2.4. SWOT Analysis
- 12.1.3 Uber Freight
- 12.1.3.1. Company Overview
- 12.1.3.2. Products
- 12.1.3.3. Company Financials
- 12.1.3.4. SWOT Analysis
- 12.1.4 Forto
- 12.1.4.1. Company Overview
- 12.1.4.2. Products
- 12.1.4.3. Company Financials
- 12.1.4.4. SWOT Analysis
- 12.1.5 DHL Group
- 12.1.5.1. Company Overview
- 12.1.5.2. Products
- 12.1.5.3. Company Financials
- 12.1.5.4. SWOT Analysis
- 12.1.6 Agility Logistics Pvt Ltd
- 12.1.6.1. Company Overview
- 12.1.6.2. Products
- 12.1.6.3. Company Financials
- 12.1.6.4. SWOT Analysis
- 12.1.7 Expeditors International
- 12.1.7.1. Company Overview
- 12.1.7.2. Products
- 12.1.7.3. Company Financials
- 12.1.7.4. SWOT Analysis
- 12.1.8 InstaFreight
- 12.1.8.1. Company Overview
- 12.1.8.2. Products
- 12.1.8.3. Company Financials
- 12.1.8.4. SWOT Analysis
- 12.1.9 Turvo
- 12.1.9.1. Company Overview
- 12.1.9.2. Products
- 12.1.9.3. Company Financials
- 12.1.9.4. SWOT Analysis
- 12.1.10 iContainers
- 12.1.10.1. Company Overview
- 12.1.10.2. Products
- 12.1.10.3. Company Financials
- 12.1.10.4. SWOT Analysis
- 12.1.11 Twill
- 12.1.11.1. Company Overview
- 12.1.11.2. Products
- 12.1.11.3. Company Financials
- 12.1.11.4. SWOT Analysis
- 12.1.12 NYSHEX
- 12.1.12.1. Company Overview
- 12.1.12.2. Products
- 12.1.12.3. Company Financials
- 12.1.12.4. SWOT Analysis
- 12.1.13 Transporteca
- 12.1.13.1. Company Overview
- 12.1.13.2. Products
- 12.1.13.3. Company Financials
- 12.1.13.4. SWOT Analysis
- 12.1.14 uShip**List Not Exhaustive
- 12.1.14.1. Company Overview
- 12.1.14.2. Products
- 12.1.14.3. Company Financials
- 12.1.14.4. SWOT Analysis
- 12.1.15 Convoy
- 12.1.15.1. Company Overview
- 12.1.15.2. Products
- 12.1.15.3. Company Financials
- 12.1.15.4. SWOT Analysis
- 12.1.16 Kontainers
- 12.1.16.1. Company Overview
- 12.1.16.2. Products
- 12.1.16.3. Company Financials
- 12.1.16.4. SWOT Analysis
- 12.1.1 Flexport
- 12.2. Market Entropy
- 12.2.1 Company's Key Areas Served
- 12.2.2 Recent Developments
- 12.3. Company Market Share Analysis 2025
- 12.3.1 Top 5 Companies Market Share Analysis
- 12.3.2 Top 3 Companies Market Share Analysis
- 12.4. List of Potential Customers
- 13. Research Methodology
List of Figures
- Figure 1: Global US Digital Freight Management Industry Revenue Breakdown (Million, %) by Region 2025 & 2033
- Figure 2: North America US Digital Freight Management Industry Revenue (Million), by Mode of Transportation 2025 & 2033
- Figure 3: North America US Digital Freight Management Industry Revenue Share (%), by Mode of Transportation 2025 & 2033
- Figure 4: North America US Digital Freight Management Industry Revenue (Million), by Firm Type 2025 & 2033
- Figure 5: North America US Digital Freight Management Industry Revenue Share (%), by Firm Type 2025 & 2033
- Figure 6: North America US Digital Freight Management Industry Revenue (Million), by Country 2025 & 2033
- Figure 7: North America US Digital Freight Management Industry Revenue Share (%), by Country 2025 & 2033
- Figure 8: South America US Digital Freight Management Industry Revenue (Million), by Mode of Transportation 2025 & 2033
- Figure 9: South America US Digital Freight Management Industry Revenue Share (%), by Mode of Transportation 2025 & 2033
- Figure 10: South America US Digital Freight Management Industry Revenue (Million), by Firm Type 2025 & 2033
- Figure 11: South America US Digital Freight Management Industry Revenue Share (%), by Firm Type 2025 & 2033
- Figure 12: South America US Digital Freight Management Industry Revenue (Million), by Country 2025 & 2033
- Figure 13: South America US Digital Freight Management Industry Revenue Share (%), by Country 2025 & 2033
- Figure 14: Europe US Digital Freight Management Industry Revenue (Million), by Mode of Transportation 2025 & 2033
- Figure 15: Europe US Digital Freight Management Industry Revenue Share (%), by Mode of Transportation 2025 & 2033
- Figure 16: Europe US Digital Freight Management Industry Revenue (Million), by Firm Type 2025 & 2033
- Figure 17: Europe US Digital Freight Management Industry Revenue Share (%), by Firm Type 2025 & 2033
- Figure 18: Europe US Digital Freight Management Industry Revenue (Million), by Country 2025 & 2033
- Figure 19: Europe US Digital Freight Management Industry Revenue Share (%), by Country 2025 & 2033
- Figure 20: Middle East & Africa US Digital Freight Management Industry Revenue (Million), by Mode of Transportation 2025 & 2033
- Figure 21: Middle East & Africa US Digital Freight Management Industry Revenue Share (%), by Mode of Transportation 2025 & 2033
- Figure 22: Middle East & Africa US Digital Freight Management Industry Revenue (Million), by Firm Type 2025 & 2033
- Figure 23: Middle East & Africa US Digital Freight Management Industry Revenue Share (%), by Firm Type 2025 & 2033
- Figure 24: Middle East & Africa US Digital Freight Management Industry Revenue (Million), by Country 2025 & 2033
- Figure 25: Middle East & Africa US Digital Freight Management Industry Revenue Share (%), by Country 2025 & 2033
- Figure 26: Asia Pacific US Digital Freight Management Industry Revenue (Million), by Mode of Transportation 2025 & 2033
- Figure 27: Asia Pacific US Digital Freight Management Industry Revenue Share (%), by Mode of Transportation 2025 & 2033
- Figure 28: Asia Pacific US Digital Freight Management Industry Revenue (Million), by Firm Type 2025 & 2033
- Figure 29: Asia Pacific US Digital Freight Management Industry Revenue Share (%), by Firm Type 2025 & 2033
- Figure 30: Asia Pacific US Digital Freight Management Industry Revenue (Million), by Country 2025 & 2033
- Figure 31: Asia Pacific US Digital Freight Management Industry Revenue Share (%), by Country 2025 & 2033
List of Tables
- Table 1: Global US Digital Freight Management Industry Revenue Million Forecast, by Mode of Transportation 2020 & 2033
- Table 2: Global US Digital Freight Management Industry Revenue Million Forecast, by Firm Type 2020 & 2033
- Table 3: Global US Digital Freight Management Industry Revenue Million Forecast, by Region 2020 & 2033
- Table 4: Global US Digital Freight Management Industry Revenue Million Forecast, by Mode of Transportation 2020 & 2033
- Table 5: Global US Digital Freight Management Industry Revenue Million Forecast, by Firm Type 2020 & 2033
- Table 6: Global US Digital Freight Management Industry Revenue Million Forecast, by Country 2020 & 2033
- Table 7: United States US Digital Freight Management Industry Revenue (Million) Forecast, by Application 2020 & 2033
- Table 8: Canada US Digital Freight Management Industry Revenue (Million) Forecast, by Application 2020 & 2033
- Table 9: Mexico US Digital Freight Management Industry Revenue (Million) Forecast, by Application 2020 & 2033
- Table 10: Global US Digital Freight Management Industry Revenue Million Forecast, by Mode of Transportation 2020 & 2033
- Table 11: Global US Digital Freight Management Industry Revenue Million Forecast, by Firm Type 2020 & 2033
- Table 12: Global US Digital Freight Management Industry Revenue Million Forecast, by Country 2020 & 2033
- Table 13: Brazil US Digital Freight Management Industry Revenue (Million) Forecast, by Application 2020 & 2033
- Table 14: Argentina US Digital Freight Management Industry Revenue (Million) Forecast, by Application 2020 & 2033
- Table 15: Rest of South America US Digital Freight Management Industry Revenue (Million) Forecast, by Application 2020 & 2033
- Table 16: Global US Digital Freight Management Industry Revenue Million Forecast, by Mode of Transportation 2020 & 2033
- Table 17: Global US Digital Freight Management Industry Revenue Million Forecast, by Firm Type 2020 & 2033
- Table 18: Global US Digital Freight Management Industry Revenue Million Forecast, by Country 2020 & 2033
- Table 19: United Kingdom US Digital Freight Management Industry Revenue (Million) Forecast, by Application 2020 & 2033
- Table 20: Germany US Digital Freight Management Industry Revenue (Million) Forecast, by Application 2020 & 2033
- Table 21: France US Digital Freight Management Industry Revenue (Million) Forecast, by Application 2020 & 2033
- Table 22: Italy US Digital Freight Management Industry Revenue (Million) Forecast, by Application 2020 & 2033
- Table 23: Spain US Digital Freight Management Industry Revenue (Million) Forecast, by Application 2020 & 2033
- Table 24: Russia US Digital Freight Management Industry Revenue (Million) Forecast, by Application 2020 & 2033
- Table 25: Benelux US Digital Freight Management Industry Revenue (Million) Forecast, by Application 2020 & 2033
- Table 26: Nordics US Digital Freight Management Industry Revenue (Million) Forecast, by Application 2020 & 2033
- Table 27: Rest of Europe US Digital Freight Management Industry Revenue (Million) Forecast, by Application 2020 & 2033
- Table 28: Global US Digital Freight Management Industry Revenue Million Forecast, by Mode of Transportation 2020 & 2033
- Table 29: Global US Digital Freight Management Industry Revenue Million Forecast, by Firm Type 2020 & 2033
- Table 30: Global US Digital Freight Management Industry Revenue Million Forecast, by Country 2020 & 2033
- Table 31: Turkey US Digital Freight Management Industry Revenue (Million) Forecast, by Application 2020 & 2033
- Table 32: Israel US Digital Freight Management Industry Revenue (Million) Forecast, by Application 2020 & 2033
- Table 33: GCC US Digital Freight Management Industry Revenue (Million) Forecast, by Application 2020 & 2033
- Table 34: North Africa US Digital Freight Management Industry Revenue (Million) Forecast, by Application 2020 & 2033
- Table 35: South Africa US Digital Freight Management Industry Revenue (Million) Forecast, by Application 2020 & 2033
- Table 36: Rest of Middle East & Africa US Digital Freight Management Industry Revenue (Million) Forecast, by Application 2020 & 2033
- Table 37: Global US Digital Freight Management Industry Revenue Million Forecast, by Mode of Transportation 2020 & 2033
- Table 38: Global US Digital Freight Management Industry Revenue Million Forecast, by Firm Type 2020 & 2033
- Table 39: Global US Digital Freight Management Industry Revenue Million Forecast, by Country 2020 & 2033
- Table 40: China US Digital Freight Management Industry Revenue (Million) Forecast, by Application 2020 & 2033
- Table 41: India US Digital Freight Management Industry Revenue (Million) Forecast, by Application 2020 & 2033
- Table 42: Japan US Digital Freight Management Industry Revenue (Million) Forecast, by Application 2020 & 2033
- Table 43: South Korea US Digital Freight Management Industry Revenue (Million) Forecast, by Application 2020 & 2033
- Table 44: ASEAN US Digital Freight Management Industry Revenue (Million) Forecast, by Application 2020 & 2033
- Table 45: Oceania US Digital Freight Management Industry Revenue (Million) Forecast, by Application 2020 & 2033
- Table 46: Rest of Asia Pacific US Digital Freight Management Industry Revenue (Million) Forecast, by Application 2020 & 2033
Frequently Asked Questions
1. What is the projected Compound Annual Growth Rate (CAGR) of the US Digital Freight Management Industry?
The projected CAGR is approximately 21.72%.
2. Which companies are prominent players in the US Digital Freight Management Industry?
Key companies in the market include Flexport, Kuehne + Nagel International (KN Freight Net), Uber Freight, Forto, DHL Group, Agility Logistics Pvt Ltd, Expeditors International, InstaFreight, Turvo, iContainers, Twill, NYSHEX, Transporteca, uShip**List Not Exhaustive, Convoy, Kontainers.
3. What are the main segments of the US Digital Freight Management Industry?
The market segments include Mode of Transportation, Firm Type.
4. Can you provide details about the market size?
The market size is estimated to be USD 6.89 Million as of 2022.
5. What are some drivers contributing to market growth?
4.; PHARMACEUTICAL INDUSTRY GROWTH4.; RISING FRESH PRODUCE IMPORTS FROM MEXICO4.; INCREASING POPULARITY OF FROZEN FOODS.
6. What are the notable trends driving market growth?
E- Commerce is driving the market.
7. Are there any restraints impacting market growth?
4.; EMISSIONS FROM COLD CHAIN OPERATIONS4.; LABOUR SHORTAGES.
8. Can you provide examples of recent developments in the market?
October 2022: Transplace and Uber Freight just completed their merger. It will bring all lower-tier carriers together under the banner of "the world's largest network demand platform meeting the world's largest supply platform," enabling them to benefit from the technological advancement necessary to participate in the global network platform.
9. What pricing options are available for accessing the report?
Pricing options include single-user, multi-user, and enterprise licenses priced at USD 3800, USD 4500, and USD 5800 respectively.
10. Is the market size provided in terms of value or volume?
The market size is provided in terms of value, measured in Million.
11. Are there any specific market keywords associated with the report?
Yes, the market keyword associated with the report is "US Digital Freight Management Industry," which aids in identifying and referencing the specific market segment covered.
12. How do I determine which pricing option suits my needs best?
The pricing options vary based on user requirements and access needs. Individual users may opt for single-user licenses, while businesses requiring broader access may choose multi-user or enterprise licenses for cost-effective access to the report.
13. Are there any additional resources or data provided in the US Digital Freight Management Industry report?
While the report offers comprehensive insights, it's advisable to review the specific contents or supplementary materials provided to ascertain if additional resources or data are available.
14. How can I stay updated on further developments or reports in the US Digital Freight Management Industry?
To stay informed about further developments, trends, and reports in the US Digital Freight Management Industry, consider subscribing to industry newsletters, following relevant companies and organizations, or regularly checking reputable industry news sources and publications.
Methodology
Step 1 - Identification of Relevant Samples Size from Population Database


Step 2 - Approaches for Defining Global Market Size (Value, Volume* & Price*)

Note*: In applicable scenarios
Step 3 - Data Sources
Primary Research
- Web Analytics
- Survey Reports
- Research Institute
- Latest Research Reports
- Opinion Leaders
Secondary Research
- Annual Reports
- White Paper
- Latest Press Release
- Industry Association
- Paid Database
- Investor Presentations

Step 4 - Data Triangulation
Involves using different sources of information in order to increase the validity of a study
These sources are likely to be stakeholders in a program - participants, other researchers, program staff, other community members, and so on.
Then we put all data in single framework & apply various statistical tools to find out the dynamic on the market.
During the analysis stage, feedback from the stakeholder groups would be compared to determine areas of agreement as well as areas of divergence