

Key Insights
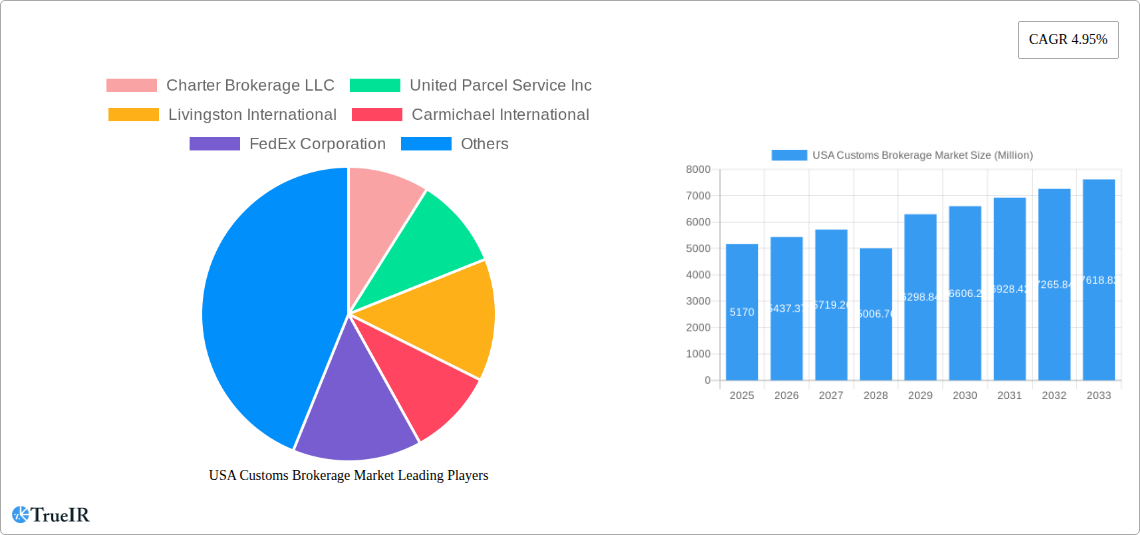
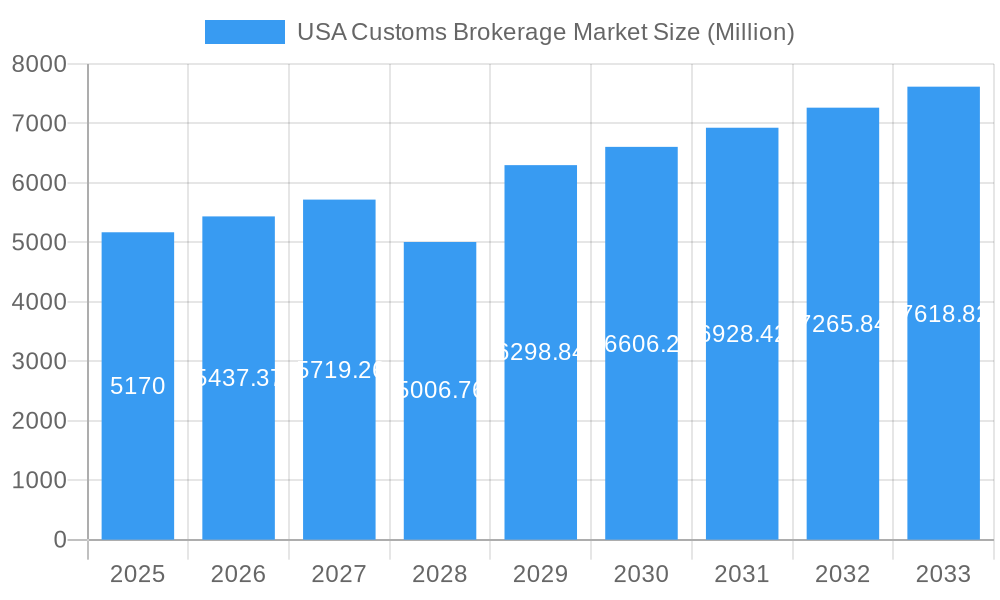
The US Customs Brokerage market, valued at $5.17 billion in 2025, is projected to experience robust growth, driven by the increasing volume of international trade and the complexity of customs regulations. A Compound Annual Growth Rate (CAGR) of 4.95% is anticipated from 2025 to 2033, indicating a significant expansion of the market. Key drivers include the rise in e-commerce, necessitating efficient customs clearance processes for a larger volume of smaller shipments; growing globalization and increased cross-border trade; and the increasing demand for specialized services like customs compliance consulting and supply chain optimization. The market is segmented by mode of transport (sea, air, and cross-border land transport), with sea freight likely dominating due to its high volume in international trade. Leading players such as FedEx, DHL, and UPS, alongside specialized brokerage firms like Livingston International and Expeditors International, compete for market share. Regional variations exist, with higher activity anticipated in states with major ports and international trade hubs like California, New York, and Texas. While regulatory changes and economic fluctuations present potential restraints, the overall outlook remains positive, fueled by the long-term growth trajectory of global commerce.
USA Customs Brokerage Market Market Size (In Billion)
The competitive landscape features both large multinational logistics providers and smaller, specialized brokerage firms. The presence of these varied players suggests opportunities for both consolidation and niche specialization within the market. Further market segmentation could consider industry vertical (e.g., automotive, technology, healthcare) as diverse sectors exhibit unique customs requirements. Future growth will depend on the ability of companies to adapt to evolving regulations, leverage technology for increased efficiency, and cater to the specific needs of their clientele. The continued growth of e-commerce, particularly cross-border B2C sales, presents a significant opportunity for customs brokerage firms that can effectively manage the complexities of smaller package shipments and associated compliance needs.
USA Customs Brokerage Market Company Market Share
USA Customs Brokerage Market: A Comprehensive Report (2019-2033)
This dynamic report provides a detailed analysis of the USA Customs Brokerage Market, offering invaluable insights for industry professionals, investors, and strategic decision-makers. Leveraging extensive research and data spanning the period 2019-2033 (Base Year: 2025, Forecast Period: 2025-2033), this report unveils the market's structure, competitive dynamics, growth drivers, and future outlook. The market is projected to reach xx Million by 2033, exhibiting a CAGR of xx% during the forecast period.
USA Customs Brokerage Market Market Structure & Competitive Landscape
The USA Customs Brokerage Market exhibits a moderately consolidated structure, with several large players holding significant market share. The Herfindahl-Hirschman Index (HHI) is estimated at xx, indicating a moderately concentrated market. However, the presence of numerous smaller, specialized brokers fosters competition. Key innovation drivers include advancements in customs technology, digitalization of processes, and the growing adoption of AI and machine learning for improved efficiency and compliance. Regulatory changes, such as updates to import/export regulations and trade agreements (e.g., USMCA), significantly impact market dynamics. Product substitutes are limited, primarily focusing on in-house customs management for larger corporations. The market displays strong end-user segmentation across various industries, including manufacturing, retail, technology, and healthcare. Mergers and acquisitions (M&A) activity has been notable, particularly in recent years, as larger players seek to expand their service offerings and geographical reach. The total value of M&A transactions in the last five years is estimated at xx Million.
- Market Concentration: Moderately Consolidated (HHI: xx)
- Innovation Drivers: Technological advancements, digitalization, AI/ML
- Regulatory Impact: Significant influence from import/export regulations and trade agreements
- Product Substitutes: Limited, mainly in-house customs management for larger firms
- End-User Segmentation: Diverse across various industries
- M&A Activity: High, with transactions valued at xx Million in the last 5 years
USA Customs Brokerage Market Market Trends & Opportunities
The USA Customs Brokerage Market is experiencing a dynamic period of robust expansion, fueled by consistently increasing global trade volumes, the inherent complexities of evolving customs regulations, and a heightened demand for exceptionally efficient and meticulously compliant logistics solutions. The market has demonstrated a strong historical growth trajectory, with its size expanding from approximately **[Insert Previous Market Size Figure] Million USD in 2019 to an estimated [Insert Current Market Size Figure] Million USD in 2024**. Key market shapers include significant technological advancements, such as the integration of blockchain technology for unparalleled supply chain transparency and the widespread adoption of automated customs clearance systems. Consumer preferences are increasingly aligning with a demand for faster, demonstrably more reliable, and seamlessly digitally enabled customs brokerage services. The competitive landscape is characterized by a notable intensity of rivalry among well-established industry stalwarts and the agile emergence of innovative, technology-forward startups. This competitive pressure is contributing to pricing considerations and a pronounced emphasis on delivering superior value-added services. The penetration rates for digital customs solutions are steadily ascending, signaling considerable untapped future potential within the market.
Dominant Markets & Segments in USA Customs Brokerage Market
The Sea freight segment currently dominates the USA Customs Brokerage Market, accounting for xx% of total market share in 2024. This is largely attributable to the high volume of seaborne trade entering and exiting the United States. However, the Air freight segment is exhibiting the fastest growth rate, driven by the increasing preference for expedited delivery services. The Cross-border Land Transport segment is also witnessing substantial growth, fueled by expanding trade with neighboring countries, particularly Canada and Mexico.
- Sea Freight:
- Growth Drivers: High volume of seaborne trade, established infrastructure.
- Air Freight:
- Growth Drivers: Demand for speed and efficiency, technological advancements in air cargo handling.
- Cross-border Land Transport:
- Growth Drivers: Increased trade with Canada and Mexico, improving border infrastructure and processes.
USA Customs Brokerage Market Product Analysis
The market offers a range of services, including customs clearance, documentation preparation, tariff classification, compliance advisory, and bonded warehousing. Recent product innovations focus on incorporating advanced technologies such as AI, blockchain, and automation to streamline processes, enhance accuracy, and reduce processing times. These innovations provide competitive advantages by offering clients faster turnaround times, lower costs, and improved compliance. The market fit for these technological advancements is strong, driven by client demand for enhanced efficiency and transparency.
Key Drivers, Barriers & Challenges in USA Customs Brokerage Market
Key Drivers:
- Sustained and increasing global trade volumes, underscoring the fundamental need for efficient import/export processes.
- The escalating complexity and ever-evolving nature of customs regulations, necessitating expert navigation and compliance.
- Pervasive technological advancements that are instrumental in enhancing operational efficiency, improving data accuracy, and fostering greater transparency across the supply chain.
- A growing and persistent demand for comprehensive, value-added logistics services that extend beyond basic customs clearance.
Challenges and Restraints:
- The inherent complexities and frequent, sometimes abrupt, changes in regulatory frameworks, which pose ongoing compliance hurdles for businesses.
- The increasing frequency and impact of global supply chain disruptions, which can significantly impede timely customs clearance and delivery.
- Intense and persistent competition from both long-standing, established market players and agile new entrants, creating pressure on margins.
- The ever-present and growing threat of cybersecurity vulnerabilities and potential data breaches within increasingly digitized systems, representing a significant and quantifiable risk to the industry, estimated to incur costs of approximately **[Insert Estimated Annual Cost Figure] Million USD annually**.
Growth Drivers in the USA Customs Brokerage Market Market
The relentless march of globalization, characterized by ever-expanding international trade networks, coupled with the dynamic and frequently shifting landscape of customs regulations, fundamentally necessitates the engagement of specialized expertise in customs brokerage. This inherent demand serves as a primary engine for market expansion. Furthermore, the strategic adoption of automation and cutting-edge technological advancements, including the transformative capabilities of Artificial Intelligence (AI), are demonstrably enhancing operational efficiency and attracting a growing number of businesses actively seeking streamlined and optimized import/export processes. Government-led initiatives specifically designed to modernize and digitize customs procedures are also providing a positive impetus for market growth.
Challenges Impacting USA Customs Brokerage Market Growth
Navigating the intricacies of US customs regulations presents a major hurdle. Supply chain disruptions cause delays and increased costs. Finally, fierce competition among established players and new entrants puts pressure on pricing and margins.
Key Players Shaping the USA Customs Brokerage Market Market
- Charter Brokerage LLC
- United Parcel Service Inc
- Livingston International
- Carmichael International
- FedEx Corporation
- Deutsche Post DHL group
- Trans American Customhouse Brokers Inc
- GHY International
- Flexport Inc
- Purolator International
- Samuel Shapiro & Company Inc
- Scarbrough International Ltd
- Expeditors International
- A N Deringer
- C H Robinson
- CH Powell Company
- 8 Other Companies (Key Information/Overview)
Significant USA Customs Brokerage Market Industry Milestones
- November 2023: Kuehne+Nagel significantly bolstered its cross-border capabilities with the strategic acquisition of Farrow, a prominent Canadian customs broker.
- October 2023: Rock-It Global strategically expanded its footprint within the motorsports sector through the acquisition of the established customs broker, Dell Will.
- [Insert another significant milestone with date and brief description]
- [Insert another significant milestone with date and brief description]
Future Outlook for USA Customs Brokerage Market Market
The USA Customs Brokerage Market is robustly positioned for sustained and significant growth in the coming years. This upward trajectory is underpinned by the continued expansion of global trade volumes, the relentless pace of technological innovation, and the ever-evolving nature of regulatory landscapes. Strategic opportunities abound for forward-thinking companies that are adept at leveraging advanced technology to amplify efficiency, enhance transparency throughout the supply chain, and ensure unwavering compliance. The market's inherent potential is substantial, offering considerable scope for further expansion, deep-seated innovation, and the development of advanced, value-driven service offerings.
USA Customs Brokerage Market Segmentation
-
1. Mode of Transport
- 1.1. Sea
- 1.2. Air
- 1.3. Cross-border Land Transport
USA Customs Brokerage Market Segmentation By Geography
-
1. North America
- 1.1. United States
- 1.2. Canada
- 1.3. Mexico
-
2. South America
- 2.1. Brazil
- 2.2. Argentina
- 2.3. Rest of South America
-
3. Europe
- 3.1. United Kingdom
- 3.2. Germany
- 3.3. France
- 3.4. Italy
- 3.5. Spain
- 3.6. Russia
- 3.7. Benelux
- 3.8. Nordics
- 3.9. Rest of Europe
-
4. Middle East & Africa
- 4.1. Turkey
- 4.2. Israel
- 4.3. GCC
- 4.4. North Africa
- 4.5. South Africa
- 4.6. Rest of Middle East & Africa
-
5. Asia Pacific
- 5.1. China
- 5.2. India
- 5.3. Japan
- 5.4. South Korea
- 5.5. ASEAN
- 5.6. Oceania
- 5.7. Rest of Asia Pacific
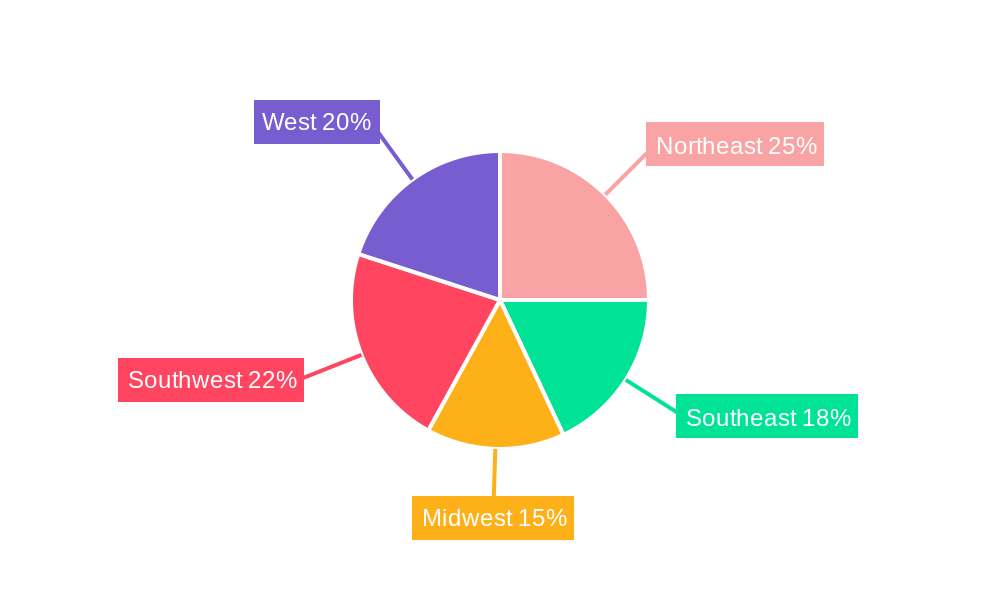
USA Customs Brokerage Market Regional Market Share
Geographic Coverage of USA Customs Brokerage Market
USA Customs Brokerage Market REPORT HIGHLIGHTS
| Aspects | Details |
|---|---|
| Study Period | 2020-2034 |
| Base Year | 2025 |
| Estimated Year | 2026 |
| Forecast Period | 2026-2034 |
| Historical Period | 2020-2025 |
| Growth Rate | CAGR of 4.95% from 2020-2034 |
| Segmentation |
|
Table of Contents
- 1. Introduction
- 1.1. Research Scope
- 1.2. Market Segmentation
- 1.3. Research Objective
- 1.4. Definitions and Assumptions
- 2. Executive Summary
- 2.1. Market Snapshot
- 3. Market Dynamics
- 3.1. Market Drivers
- 3.2. Market Restrains
- 3.3. Market Trends
- 3.4. Market Opportunities
- 4. Market Factor Analysis
- 4.1. Porters Five Forces
- 4.1.1. Bargaining Power of Suppliers
- 4.1.2. Bargaining Power of Buyers
- 4.1.3. Threat of New Entrants
- 4.1.4. Threat of Substitutes
- 4.1.5. Competitive Rivalry
- 4.2. PESTEL analysis
- 4.3. BCG Analysis
- 4.3.1. Stars (High Growth, High Market Share)
- 4.3.2. Cash Cows (Low Growth, High Market Share)
- 4.3.3. Question Mark (High Growth, Low Market Share)
- 4.3.4. Dogs (Low Growth, Low Market Share)
- 4.4. Ansoff Matrix Analysis
- 4.5. Supply Chain Analysis
- 4.6. Regulatory Landscape
- 4.7. Current Market Potential and Opportunity Assessment (TAM–SAM–SOM Framework)
- 4.8. TIR Analyst Note
- 4.1. Porters Five Forces
- 5. Market Analysis, Insights and Forecast 2021-2033
- 5.1. Market Analysis, Insights and Forecast - by Mode of Transport
- 5.1.1. Sea
- 5.1.2. Air
- 5.1.3. Cross-border Land Transport
- 5.2. Market Analysis, Insights and Forecast - by Region
- 5.2.1. North America
- 5.2.2. South America
- 5.2.3. Europe
- 5.2.4. Middle East & Africa
- 5.2.5. Asia Pacific
- 5.1. Market Analysis, Insights and Forecast - by Mode of Transport
- 6. Global USA Customs Brokerage Market Analysis, Insights and Forecast, 2021-2033
- 6.1. Market Analysis, Insights and Forecast - by Mode of Transport
- 6.1.1. Sea
- 6.1.2. Air
- 6.1.3. Cross-border Land Transport
- 6.1. Market Analysis, Insights and Forecast - by Mode of Transport
- 7. North America USA Customs Brokerage Market Analysis, Insights and Forecast, 2020-2032
- 7.1. Market Analysis, Insights and Forecast - by Mode of Transport
- 7.1.1. Sea
- 7.1.2. Air
- 7.1.3. Cross-border Land Transport
- 7.1. Market Analysis, Insights and Forecast - by Mode of Transport
- 8. South America USA Customs Brokerage Market Analysis, Insights and Forecast, 2020-2032
- 8.1. Market Analysis, Insights and Forecast - by Mode of Transport
- 8.1.1. Sea
- 8.1.2. Air
- 8.1.3. Cross-border Land Transport
- 8.1. Market Analysis, Insights and Forecast - by Mode of Transport
- 9. Europe USA Customs Brokerage Market Analysis, Insights and Forecast, 2020-2032
- 9.1. Market Analysis, Insights and Forecast - by Mode of Transport
- 9.1.1. Sea
- 9.1.2. Air
- 9.1.3. Cross-border Land Transport
- 9.1. Market Analysis, Insights and Forecast - by Mode of Transport
- 10. Middle East & Africa USA Customs Brokerage Market Analysis, Insights and Forecast, 2020-2032
- 10.1. Market Analysis, Insights and Forecast - by Mode of Transport
- 10.1.1. Sea
- 10.1.2. Air
- 10.1.3. Cross-border Land Transport
- 10.1. Market Analysis, Insights and Forecast - by Mode of Transport
- 11. Asia Pacific USA Customs Brokerage Market Analysis, Insights and Forecast, 2020-2032
- 11.1. Market Analysis, Insights and Forecast - by Mode of Transport
- 11.1.1. Sea
- 11.1.2. Air
- 11.1.3. Cross-border Land Transport
- 11.1. Market Analysis, Insights and Forecast - by Mode of Transport
- 12. Competitive Analysis
- 12.1. Company Profiles
- 12.1.1 Charter Brokerage LLC
- 12.1.1.1. Company Overview
- 12.1.1.2. Products
- 12.1.1.3. Company Financials
- 12.1.1.4. SWOT Analysis
- 12.1.2 United Parcel Service Inc
- 12.1.2.1. Company Overview
- 12.1.2.2. Products
- 12.1.2.3. Company Financials
- 12.1.2.4. SWOT Analysis
- 12.1.3 Livingston International
- 12.1.3.1. Company Overview
- 12.1.3.2. Products
- 12.1.3.3. Company Financials
- 12.1.3.4. SWOT Analysis
- 12.1.4 Carmichael International
- 12.1.4.1. Company Overview
- 12.1.4.2. Products
- 12.1.4.3. Company Financials
- 12.1.4.4. SWOT Analysis
- 12.1.5 FedEx Corporation
- 12.1.5.1. Company Overview
- 12.1.5.2. Products
- 12.1.5.3. Company Financials
- 12.1.5.4. SWOT Analysis
- 12.1.6 Deutsche Post DHL group
- 12.1.6.1. Company Overview
- 12.1.6.2. Products
- 12.1.6.3. Company Financials
- 12.1.6.4. SWOT Analysis
- 12.1.7 Trans American Customhouse Brokers Inc GHY International Flexport Inc Purolator International Samuel Shapiro & Company Inc Scarbrough International Ltd
- 12.1.7.1. Company Overview
- 12.1.7.2. Products
- 12.1.7.3. Company Financials
- 12.1.7.4. SWOT Analysis
- 12.1.8 Expeditors International
- 12.1.8.1. Company Overview
- 12.1.8.2. Products
- 12.1.8.3. Company Financials
- 12.1.8.4. SWOT Analysis
- 12.1.9 A N Deringer
- 12.1.9.1. Company Overview
- 12.1.9.2. Products
- 12.1.9.3. Company Financials
- 12.1.9.4. SWOT Analysis
- 12.1.10 C H Robinson
- 12.1.10.1. Company Overview
- 12.1.10.2. Products
- 12.1.10.3. Company Financials
- 12.1.10.4. SWOT Analysis
- 12.1.11 CH Powell Company**List Not Exhaustive 8 3 Other Companies (Key Information/Overview)
- 12.1.11.1. Company Overview
- 12.1.11.2. Products
- 12.1.11.3. Company Financials
- 12.1.11.4. SWOT Analysis
- 12.1.1 Charter Brokerage LLC
- 12.2. Market Entropy
- 12.2.1 Company's Key Areas Served
- 12.2.2 Recent Developments
- 12.3. Company Market Share Analysis 2025
- 12.3.1 Top 5 Companies Market Share Analysis
- 12.3.2 Top 3 Companies Market Share Analysis
- 12.4. List of Potential Customers
- 13. Research Methodology
List of Figures
- Figure 1: Global USA Customs Brokerage Market Revenue Breakdown (Million, %) by Region 2025 & 2033
- Figure 2: North America USA Customs Brokerage Market Revenue (Million), by Mode of Transport 2025 & 2033
- Figure 3: North America USA Customs Brokerage Market Revenue Share (%), by Mode of Transport 2025 & 2033
- Figure 4: North America USA Customs Brokerage Market Revenue (Million), by Country 2025 & 2033
- Figure 5: North America USA Customs Brokerage Market Revenue Share (%), by Country 2025 & 2033
- Figure 6: South America USA Customs Brokerage Market Revenue (Million), by Mode of Transport 2025 & 2033
- Figure 7: South America USA Customs Brokerage Market Revenue Share (%), by Mode of Transport 2025 & 2033
- Figure 8: South America USA Customs Brokerage Market Revenue (Million), by Country 2025 & 2033
- Figure 9: South America USA Customs Brokerage Market Revenue Share (%), by Country 2025 & 2033
- Figure 10: Europe USA Customs Brokerage Market Revenue (Million), by Mode of Transport 2025 & 2033
- Figure 11: Europe USA Customs Brokerage Market Revenue Share (%), by Mode of Transport 2025 & 2033
- Figure 12: Europe USA Customs Brokerage Market Revenue (Million), by Country 2025 & 2033
- Figure 13: Europe USA Customs Brokerage Market Revenue Share (%), by Country 2025 & 2033
- Figure 14: Middle East & Africa USA Customs Brokerage Market Revenue (Million), by Mode of Transport 2025 & 2033
- Figure 15: Middle East & Africa USA Customs Brokerage Market Revenue Share (%), by Mode of Transport 2025 & 2033
- Figure 16: Middle East & Africa USA Customs Brokerage Market Revenue (Million), by Country 2025 & 2033
- Figure 17: Middle East & Africa USA Customs Brokerage Market Revenue Share (%), by Country 2025 & 2033
- Figure 18: Asia Pacific USA Customs Brokerage Market Revenue (Million), by Mode of Transport 2025 & 2033
- Figure 19: Asia Pacific USA Customs Brokerage Market Revenue Share (%), by Mode of Transport 2025 & 2033
- Figure 20: Asia Pacific USA Customs Brokerage Market Revenue (Million), by Country 2025 & 2033
- Figure 21: Asia Pacific USA Customs Brokerage Market Revenue Share (%), by Country 2025 & 2033
List of Tables
- Table 1: Global USA Customs Brokerage Market Revenue Million Forecast, by Mode of Transport 2020 & 2033
- Table 2: Global USA Customs Brokerage Market Revenue Million Forecast, by Region 2020 & 2033
- Table 3: Global USA Customs Brokerage Market Revenue Million Forecast, by Mode of Transport 2020 & 2033
- Table 4: Global USA Customs Brokerage Market Revenue Million Forecast, by Country 2020 & 2033
- Table 5: United States USA Customs Brokerage Market Revenue (Million) Forecast, by Application 2020 & 2033
- Table 6: Canada USA Customs Brokerage Market Revenue (Million) Forecast, by Application 2020 & 2033
- Table 7: Mexico USA Customs Brokerage Market Revenue (Million) Forecast, by Application 2020 & 2033
- Table 8: Global USA Customs Brokerage Market Revenue Million Forecast, by Mode of Transport 2020 & 2033
- Table 9: Global USA Customs Brokerage Market Revenue Million Forecast, by Country 2020 & 2033
- Table 10: Brazil USA Customs Brokerage Market Revenue (Million) Forecast, by Application 2020 & 2033
- Table 11: Argentina USA Customs Brokerage Market Revenue (Million) Forecast, by Application 2020 & 2033
- Table 12: Rest of South America USA Customs Brokerage Market Revenue (Million) Forecast, by Application 2020 & 2033
- Table 13: Global USA Customs Brokerage Market Revenue Million Forecast, by Mode of Transport 2020 & 2033
- Table 14: Global USA Customs Brokerage Market Revenue Million Forecast, by Country 2020 & 2033
- Table 15: United Kingdom USA Customs Brokerage Market Revenue (Million) Forecast, by Application 2020 & 2033
- Table 16: Germany USA Customs Brokerage Market Revenue (Million) Forecast, by Application 2020 & 2033
- Table 17: France USA Customs Brokerage Market Revenue (Million) Forecast, by Application 2020 & 2033
- Table 18: Italy USA Customs Brokerage Market Revenue (Million) Forecast, by Application 2020 & 2033
- Table 19: Spain USA Customs Brokerage Market Revenue (Million) Forecast, by Application 2020 & 2033
- Table 20: Russia USA Customs Brokerage Market Revenue (Million) Forecast, by Application 2020 & 2033
- Table 21: Benelux USA Customs Brokerage Market Revenue (Million) Forecast, by Application 2020 & 2033
- Table 22: Nordics USA Customs Brokerage Market Revenue (Million) Forecast, by Application 2020 & 2033
- Table 23: Rest of Europe USA Customs Brokerage Market Revenue (Million) Forecast, by Application 2020 & 2033
- Table 24: Global USA Customs Brokerage Market Revenue Million Forecast, by Mode of Transport 2020 & 2033
- Table 25: Global USA Customs Brokerage Market Revenue Million Forecast, by Country 2020 & 2033
- Table 26: Turkey USA Customs Brokerage Market Revenue (Million) Forecast, by Application 2020 & 2033
- Table 27: Israel USA Customs Brokerage Market Revenue (Million) Forecast, by Application 2020 & 2033
- Table 28: GCC USA Customs Brokerage Market Revenue (Million) Forecast, by Application 2020 & 2033
- Table 29: North Africa USA Customs Brokerage Market Revenue (Million) Forecast, by Application 2020 & 2033
- Table 30: South Africa USA Customs Brokerage Market Revenue (Million) Forecast, by Application 2020 & 2033
- Table 31: Rest of Middle East & Africa USA Customs Brokerage Market Revenue (Million) Forecast, by Application 2020 & 2033
- Table 32: Global USA Customs Brokerage Market Revenue Million Forecast, by Mode of Transport 2020 & 2033
- Table 33: Global USA Customs Brokerage Market Revenue Million Forecast, by Country 2020 & 2033
- Table 34: China USA Customs Brokerage Market Revenue (Million) Forecast, by Application 2020 & 2033
- Table 35: India USA Customs Brokerage Market Revenue (Million) Forecast, by Application 2020 & 2033
- Table 36: Japan USA Customs Brokerage Market Revenue (Million) Forecast, by Application 2020 & 2033
- Table 37: South Korea USA Customs Brokerage Market Revenue (Million) Forecast, by Application 2020 & 2033
- Table 38: ASEAN USA Customs Brokerage Market Revenue (Million) Forecast, by Application 2020 & 2033
- Table 39: Oceania USA Customs Brokerage Market Revenue (Million) Forecast, by Application 2020 & 2033
- Table 40: Rest of Asia Pacific USA Customs Brokerage Market Revenue (Million) Forecast, by Application 2020 & 2033
Frequently Asked Questions
1. What is the projected Compound Annual Growth Rate (CAGR) of the USA Customs Brokerage Market?
The projected CAGR is approximately 4.95%.
2. Which companies are prominent players in the USA Customs Brokerage Market?
Key companies in the market include Charter Brokerage LLC, United Parcel Service Inc, Livingston International, Carmichael International, FedEx Corporation, Deutsche Post DHL group, Trans American Customhouse Brokers Inc GHY International Flexport Inc Purolator International Samuel Shapiro & Company Inc Scarbrough International Ltd, Expeditors International, A N Deringer, C H Robinson, CH Powell Company**List Not Exhaustive 8 3 Other Companies (Key Information/Overview).
3. What are the main segments of the USA Customs Brokerage Market?
The market segments include Mode of Transport.
4. Can you provide details about the market size?
The market size is estimated to be USD 5.17 Million as of 2022.
5. What are some drivers contributing to market growth?
Increasing international trade; Advancements in technology.
6. What are the notable trends driving market growth?
Growth in Imports Driving the US Customs Brokerage Market.
7. Are there any restraints impacting market growth?
Geopolitical uncertainities; Changing trade policies.
8. Can you provide examples of recent developments in the market?
November 2023: Kuehne+Nagel completed the acquisition of Farrow, a Canada-based customs broker. This strategic move enhances cross-border capabilities at the US borders with Canada and Mexico.
9. What pricing options are available for accessing the report?
Pricing options include single-user, multi-user, and enterprise licenses priced at USD 3800, USD 4500, and USD 5800 respectively.
10. Is the market size provided in terms of value or volume?
The market size is provided in terms of value, measured in Million.
11. Are there any specific market keywords associated with the report?
Yes, the market keyword associated with the report is "USA Customs Brokerage Market," which aids in identifying and referencing the specific market segment covered.
12. How do I determine which pricing option suits my needs best?
The pricing options vary based on user requirements and access needs. Individual users may opt for single-user licenses, while businesses requiring broader access may choose multi-user or enterprise licenses for cost-effective access to the report.
13. Are there any additional resources or data provided in the USA Customs Brokerage Market report?
While the report offers comprehensive insights, it's advisable to review the specific contents or supplementary materials provided to ascertain if additional resources or data are available.
14. How can I stay updated on further developments or reports in the USA Customs Brokerage Market?
To stay informed about further developments, trends, and reports in the USA Customs Brokerage Market, consider subscribing to industry newsletters, following relevant companies and organizations, or regularly checking reputable industry news sources and publications.
Methodology
Step 1 - Identification of Relevant Samples Size from Population Database


Step 2 - Approaches for Defining Global Market Size (Value, Volume* & Price*)

Note*: In applicable scenarios
Step 3 - Data Sources
Primary Research
- Web Analytics
- Survey Reports
- Research Institute
- Latest Research Reports
- Opinion Leaders
Secondary Research
- Annual Reports
- White Paper
- Latest Press Release
- Industry Association
- Paid Database
- Investor Presentations

Step 4 - Data Triangulation
Involves using different sources of information in order to increase the validity of a study
These sources are likely to be stakeholders in a program - participants, other researchers, program staff, other community members, and so on.
Then we put all data in single framework & apply various statistical tools to find out the dynamic on the market.
During the analysis stage, feedback from the stakeholder groups would be compared to determine areas of agreement as well as areas of divergence