

Key Insights
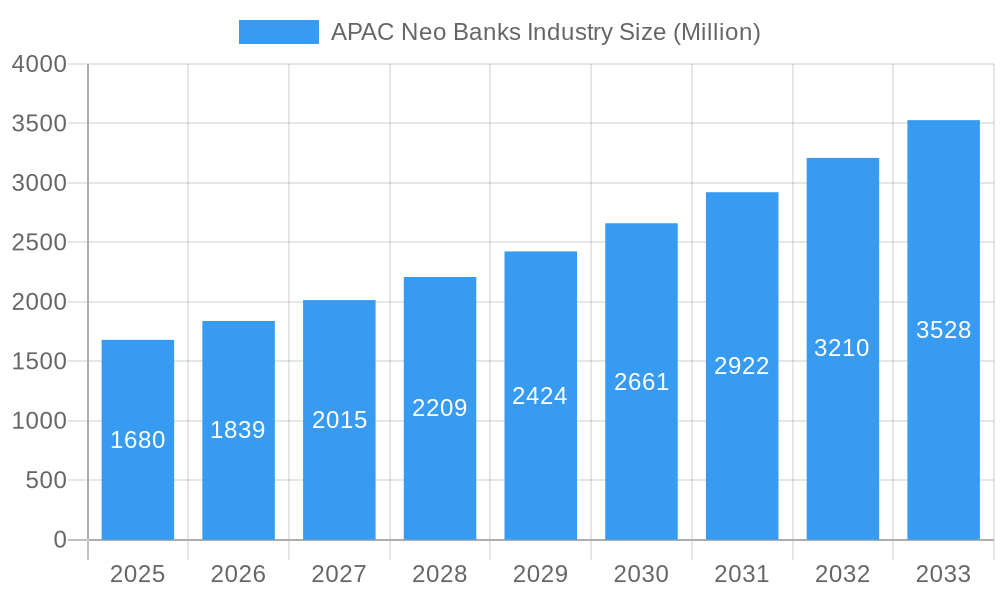
The APAC neo-banking industry is experiencing explosive growth, projected to reach a market size of $1.68 billion in 2025 and maintain a Compound Annual Growth Rate (CAGR) exceeding 9% through 2033. This surge is fueled by several key factors. Firstly, the region's burgeoning digital adoption, particularly among millennials and Gen Z, creates a fertile ground for digitally-native banking solutions. Secondly, the increasing demand for convenient, personalized, and fee-transparent financial services is driving customer migration away from traditional banks. Thirdly, innovative features like AI-powered financial management tools, integrated investment platforms, and seamless cross-border payment solutions offered by neo-banks are proving highly attractive to a tech-savvy customer base. Competition is fierce, with established players like WE Bank and Paytm Payments Bank vying for market share alongside a wave of agile startups such as Timo, Volt, and BigPay. Regulatory frameworks across the region are evolving to accommodate this rapid innovation, creating both opportunities and challenges for neo-banks. However, challenges such as maintaining robust cybersecurity infrastructure, managing regulatory compliance across diverse markets, and achieving profitability in a highly competitive landscape remain crucial considerations.
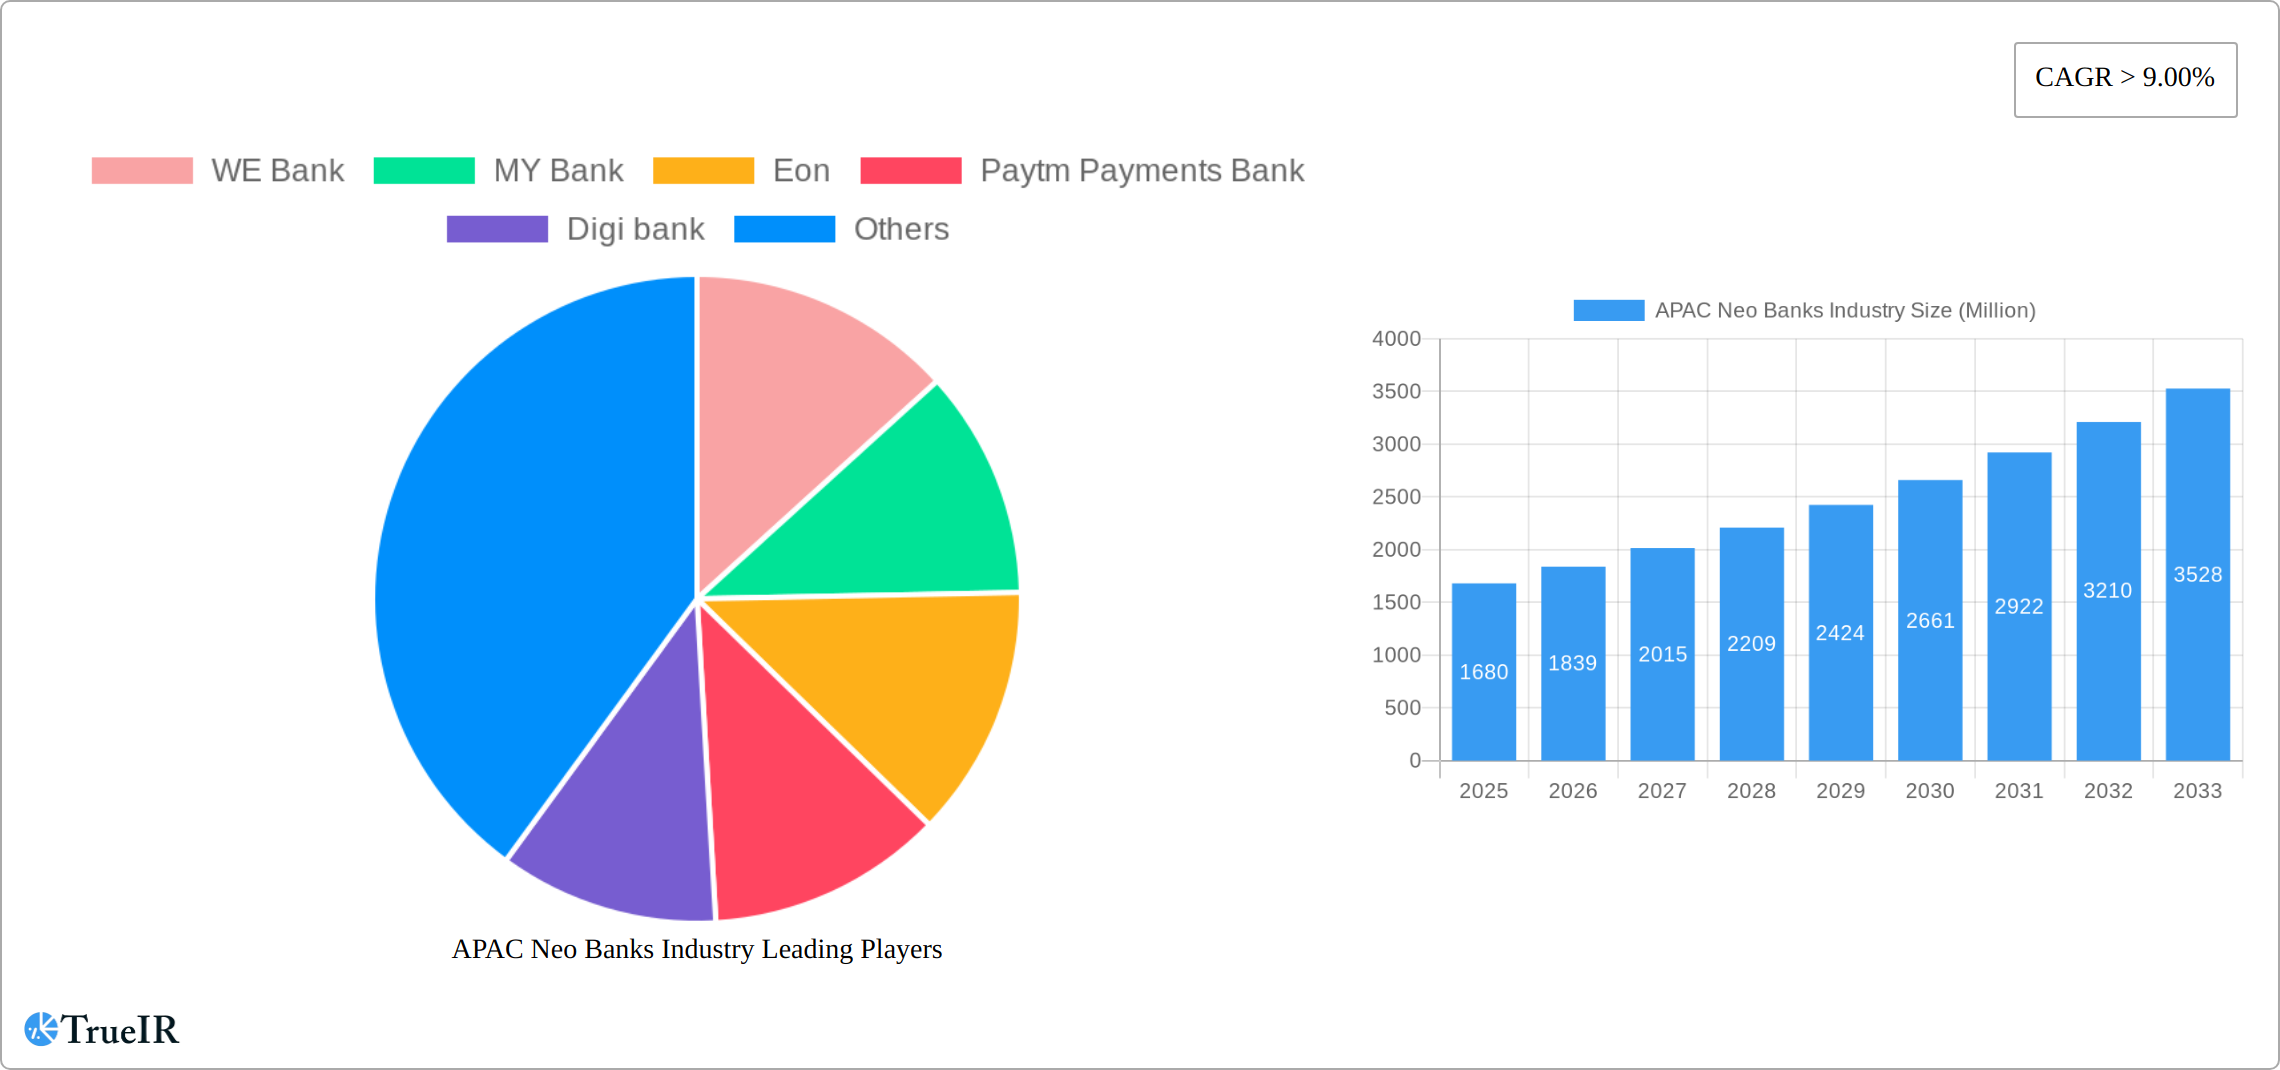
APAC Neo Banks Industry Market Size (In Billion)
The continued growth of the APAC neo-banking sector hinges on several factors. Further technological advancements, particularly in areas like blockchain and open banking, will enhance efficiency and customer experience. Expansion into underserved markets and strategic partnerships with fintech companies will be crucial for scaling operations. Furthermore, the ability of neo-banks to effectively address customer concerns around data security and privacy will be critical in building trust and maintaining sustained growth. The market's future trajectory will depend on the successful navigation of these challenges and the continued innovation within the sector, promising a dynamic and transformative landscape in the coming years.
APAC Neo Banks Industry Company Market Share
APAC Neo Banks Industry: A Comprehensive Market Report (2019-2033)
This dynamic report provides a comprehensive analysis of the APAC Neo Banks industry, offering invaluable insights for investors, industry professionals, and strategic decision-makers. With a study period spanning 2019-2033, a base year of 2025, and a forecast period of 2025-2033, this report leverages extensive data and expert analysis to paint a clear picture of the current landscape and future trajectory of this rapidly evolving sector. The report covers key market trends, competitive dynamics, and growth drivers, providing a detailed understanding of the opportunities and challenges within the APAC Neo Banks market. The market is projected to reach xx Million by 2033, exhibiting a robust CAGR of xx%.
APAC Neo Banks Industry Market Structure & Competitive Landscape
The APAC Neo Banks industry exhibits a moderately concentrated market structure, with a few dominant players and a significant number of smaller, niche players. The Herfindahl-Hirschman Index (HHI) for the region stands at approximately xx, indicating a moderately competitive landscape. Innovation, particularly in fintech solutions, is a primary driver of market growth, with continuous advancements in mobile banking, AI-powered services, and personalized financial management tools. Regulatory landscapes vary across APAC countries, impacting market entry and operational strategies. The presence of established banks poses a significant competitive challenge, leading to mergers and acquisitions (M&A) activity. The total M&A volume in the APAC Neo Banks industry from 2019-2024 is estimated at xx Million. End-user segmentation is primarily driven by demographics, financial literacy, and tech-savviness, with younger, digitally native populations exhibiting higher adoption rates.
- Market Concentration: Moderately concentrated, HHI at approximately xx.
- Innovation Drivers: Fintech advancements, mobile banking, AI, personalized finance.
- Regulatory Impacts: Varying regulations across APAC nations impact market access.
- Product Substitutes: Traditional banking services, peer-to-peer payment platforms.
- End-User Segmentation: Demographics (age, income), tech-savviness, financial literacy.
- M&A Trends: Significant activity, driven by consolidation and expansion strategies. Total M&A volume (2019-2024): xx Million.
APAC Neo Banks Industry Market Trends & Opportunities
The APAC Neo Banks market is experiencing explosive growth, fueled by rapidly increasing smartphone penetration, a surge in digital literacy, and a pronounced shift towards convenient, accessible financial services. The market size is projected to expand from **[Insert Specific Figure - e.g., $50 Billion]** in 2025 to **[Insert Specific Figure - e.g., $200 Billion]** by 2033, reflecting a substantial Compound Annual Growth Rate (CAGR) of approximately **[Insert Specific Percentage - e.g., 18.5%]**. This robust expansion is propelled by transformative technological advancements, including the widespread adoption of open banking APIs for seamless integration and the innovative application of blockchain technology to bolster security and transparency. Concurrently, consumer expectations are evolving towards highly personalized financial experiences, bespoke product offerings, and exceptional customer service, presenting a prime opportunity for Neo Banks to carve out unique competitive advantages. The landscape is characterized by intense competition, with both incumbent financial institutions and agile new entrants actively vying for market share, underscoring the imperative for continuous innovation, strategic agility, and valuable partnerships. Market penetration rates are anticipated to climb significantly, particularly within traditionally underserved economic segments.
Dominant Markets & Segments in APAC Neo Banks Industry
While the entire APAC region presents immense potential for Neo Banking expansion, specific economies such as Singapore, India, and South Korea are emerging as vanguard markets, demonstrating particularly rapid and dynamic growth within the Neo Banking sector. This regional dominance is underpinned by a confluence of synergistic factors:
- Singapore: Boasts a highly supportive regulatory framework that actively fosters fintech innovation, coupled with an exceptionally high level of digital literacy and a population that readily embraces technological advancements.
- India: Offers a vast demographic base characterized by surging smartphone penetration and a rapidly expanding appetite for convenient digital financial services.
- South Korea: Exhibits near-universal mobile penetration and a deeply ingrained culture of early adoption for groundbreaking technological innovations, creating fertile ground for Neo Banks.
These leading markets are further nuanced by segmentation based on a diverse range of product offerings, including agile savings accounts, flexible lending platforms, and accessible investment services, as well as targeted demographic focus and varied service delivery channels, primarily mobile applications and intuitive online portals. The underlying growth catalysts within these dominant markets are multifaceted:
- Robust Digital Infrastructure: Underpins the delivery of seamless and uninterrupted mobile banking experiences for a vast user base.
- Proactive Government Policies: Actively promote fintech innovation and champion digital financial inclusion initiatives across the populace.
- Pervasive Smartphone Penetration: Ensures effortless and widespread access to a spectrum of digital banking services.
- Escalating Demand for Personalized Financial Solutions: Directly drives the adoption and loyalty towards Neo Banks' tailored offerings.
APAC Neo Banks Industry Product Analysis
Neo Banks in APAC offer a diverse range of innovative financial products, leveraging technology to enhance user experience and efficiency. Key offerings include mobile-first banking, personalized financial management tools, AI-driven financial advice, and seamless integration with other fintech platforms. These products are designed to address the specific needs of the target demographic, emphasizing convenience, accessibility, and personalized services. The competitive advantage of many Neo Banks lies in their superior user experience, cost-effectiveness, and integration of advanced technology.
Key Drivers, Barriers & Challenges in APAC Neo Banks Industry
Key Drivers: Technological advancements, increasing smartphone penetration, rising demand for digital financial services, supportive government policies promoting fintech innovation, and growing financial inclusion initiatives.
Challenges: Stringent regulatory compliance requirements, concerns about cybersecurity and data privacy, competition from established banks and other fintech players, and potential supply chain disruptions affecting technology infrastructure. The impact of these challenges can be seen in reduced profitability, increased operational costs, and slower market penetration in certain segments.
Growth Drivers in the APAC Neo Banks Industry Market
The growth of the APAC Neo Banks industry is propelled by several key factors: Technological advancements like AI and machine learning enhance service efficiency and personalization. Government initiatives promoting digital financial inclusion significantly broaden the market reach. The increasing adoption of mobile and online banking among a digitally-savvy population fuels market expansion. Economic growth and rising disposable incomes boost demand for diverse financial services.
Challenges Impacting APAC Neo Banks Industry Growth
Despite the promising trajectory, the APAC Neo Banks industry confronts several significant challenges that can impede its accelerated growth. The intricate and perpetually evolving regulatory landscapes across different jurisdictions present substantial compliance hurdles and can escalate operational expenditures. Ensuring and maintaining sophisticated cybersecurity measures to safeguard sensitive user data is paramount, yet concurrently an expensive and resource-intensive undertaking. The competitive arena remains intensely contested, with well-established financial institutions and a proliferation of other fintech startups constantly vying for market dominance, necessitating a relentless pursuit of innovation and strategic differentiation. Furthermore, potential disruptions arising from supply chain issues, particularly in the acquisition of cutting-edge technological components, can impact operational continuity and constrain ambitious expansion plans.
Key Players Shaping the APAC Neo Banks Industry Market
- WE Bank
- MY Bank
- Eon
- Paytm Payments Bank
- Digi bank
- Jenius
- SBI Sumishin Net Bank
- Kakao Bank
- K Plus
- Timo
- Volt
- Xinja
- BigPay
- Neat
Note: This list is not exhaustive and represents prominent players in the current market landscape.
Significant APAC Neo Banks Industry Industry Milestones
- October 2023: Paytm launched the industry’s first alternate ID-based guest checkout solution for merchants, enhancing security and convenience.
- July 2023: Paytm introduced two innovative 4G-enabled payment devices (Paytm Pocket Soundbox and Paytm Music Soundbox), expanding merchant payment options.
Future Outlook for APAC Neo Banks Industry Market
The future trajectory of the APAC Neo Banks industry is exceptionally promising, marked by substantial growth potential. This optimism is anchored in the continuation of rapid technological innovation, a sustained push towards greater financial inclusion for previously unbanked and underbanked populations, and the ongoing evolution of consumer preferences towards digital-first financial solutions. Strategic collaborations, expansion into untapped emerging markets, and the astute diversification of product and service portfolios will be critical determinants of sustained success. The long-term market potential is considerable, offering significant and rewarding opportunities for both established, forward-thinking Neo Banks and dynamic new entrants poised to disrupt the status quo.
APAC Neo Banks Industry Segmentation
-
1. Service Type
- 1.1. Payments
- 1.2. Savings Products
- 1.3. Current Account
- 1.4. Consumer Credit
- 1.5. Loans
- 1.6. Others
-
2. End-User Type
- 2.1. Business Segment
- 2.2. Personal Segment
APAC Neo Banks Industry Segmentation By Geography
-
1. North America
- 1.1. United States
- 1.2. Canada
- 1.3. Mexico
-
2. South America
- 2.1. Brazil
- 2.2. Argentina
- 2.3. Rest of South America
-
3. Europe
- 3.1. United Kingdom
- 3.2. Germany
- 3.3. France
- 3.4. Italy
- 3.5. Spain
- 3.6. Russia
- 3.7. Benelux
- 3.8. Nordics
- 3.9. Rest of Europe
-
4. Middle East & Africa
- 4.1. Turkey
- 4.2. Israel
- 4.3. GCC
- 4.4. North Africa
- 4.5. South Africa
- 4.6. Rest of Middle East & Africa
-
5. Asia Pacific
- 5.1. China
- 5.2. India
- 5.3. Japan
- 5.4. South Korea
- 5.5. ASEAN
- 5.6. Oceania
- 5.7. Rest of Asia Pacific
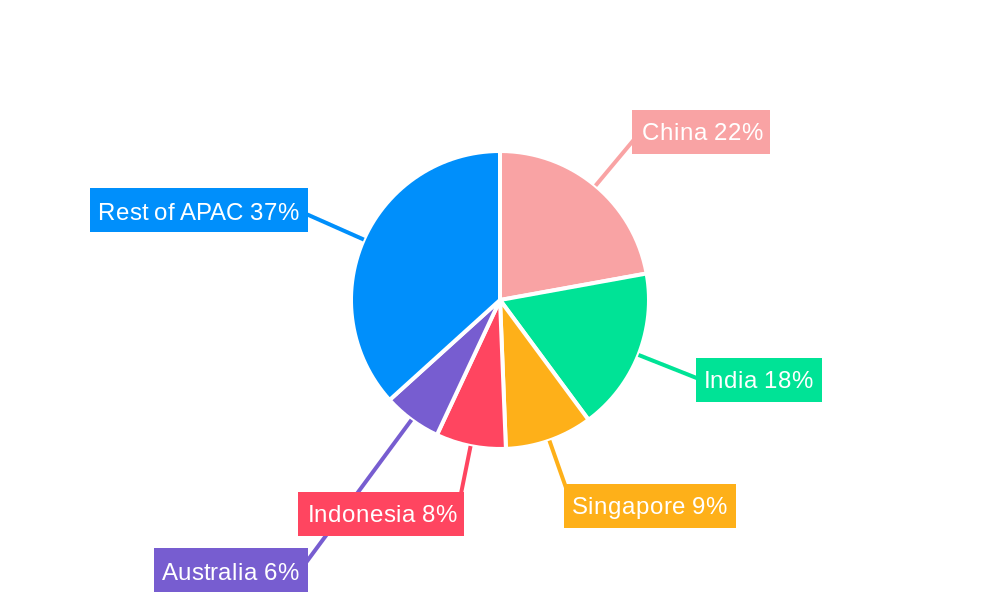
APAC Neo Banks Industry Regional Market Share
Geographic Coverage of APAC Neo Banks Industry
APAC Neo Banks Industry REPORT HIGHLIGHTS
| Aspects | Details |
|---|---|
| Study Period | 2020-2034 |
| Base Year | 2025 |
| Estimated Year | 2026 |
| Forecast Period | 2026-2034 |
| Historical Period | 2020-2025 |
| Growth Rate | CAGR of > 9.00% from 2020-2034 |
| Segmentation |
|
Table of Contents
- 1. Introduction
- 1.1. Research Scope
- 1.2. Market Segmentation
- 1.3. Research Objective
- 1.4. Definitions and Assumptions
- 2. Executive Summary
- 2.1. Market Snapshot
- 3. Market Dynamics
- 3.1. Market Drivers
- 3.2. Market Restrains
- 3.3. Market Trends
- 3.4. Market Opportunities
- 4. Market Factor Analysis
- 4.1. Porters Five Forces
- 4.1.1. Bargaining Power of Suppliers
- 4.1.2. Bargaining Power of Buyers
- 4.1.3. Threat of New Entrants
- 4.1.4. Threat of Substitutes
- 4.1.5. Competitive Rivalry
- 4.2. PESTEL analysis
- 4.3. BCG Analysis
- 4.3.1. Stars (High Growth, High Market Share)
- 4.3.2. Cash Cows (Low Growth, High Market Share)
- 4.3.3. Question Mark (High Growth, Low Market Share)
- 4.3.4. Dogs (Low Growth, Low Market Share)
- 4.4. Ansoff Matrix Analysis
- 4.5. Supply Chain Analysis
- 4.6. Regulatory Landscape
- 4.7. Current Market Potential and Opportunity Assessment (TAM–SAM–SOM Framework)
- 4.8. TIR Analyst Note
- 4.1. Porters Five Forces
- 5. Market Analysis, Insights and Forecast 2021-2033
- 5.1. Market Analysis, Insights and Forecast - by Service Type
- 5.1.1. Payments
- 5.1.2. Savings Products
- 5.1.3. Current Account
- 5.1.4. Consumer Credit
- 5.1.5. Loans
- 5.1.6. Others
- 5.2. Market Analysis, Insights and Forecast - by End-User Type
- 5.2.1. Business Segment
- 5.2.2. Personal Segment
- 5.3. Market Analysis, Insights and Forecast - by Region
- 5.3.1. North America
- 5.3.2. South America
- 5.3.3. Europe
- 5.3.4. Middle East & Africa
- 5.3.5. Asia Pacific
- 5.1. Market Analysis, Insights and Forecast - by Service Type
- 6. Global APAC Neo Banks Industry Analysis, Insights and Forecast, 2021-2033
- 6.1. Market Analysis, Insights and Forecast - by Service Type
- 6.1.1. Payments
- 6.1.2. Savings Products
- 6.1.3. Current Account
- 6.1.4. Consumer Credit
- 6.1.5. Loans
- 6.1.6. Others
- 6.2. Market Analysis, Insights and Forecast - by End-User Type
- 6.2.1. Business Segment
- 6.2.2. Personal Segment
- 6.1. Market Analysis, Insights and Forecast - by Service Type
- 7. North America APAC Neo Banks Industry Analysis, Insights and Forecast, 2020-2032
- 7.1. Market Analysis, Insights and Forecast - by Service Type
- 7.1.1. Payments
- 7.1.2. Savings Products
- 7.1.3. Current Account
- 7.1.4. Consumer Credit
- 7.1.5. Loans
- 7.1.6. Others
- 7.2. Market Analysis, Insights and Forecast - by End-User Type
- 7.2.1. Business Segment
- 7.2.2. Personal Segment
- 7.1. Market Analysis, Insights and Forecast - by Service Type
- 8. South America APAC Neo Banks Industry Analysis, Insights and Forecast, 2020-2032
- 8.1. Market Analysis, Insights and Forecast - by Service Type
- 8.1.1. Payments
- 8.1.2. Savings Products
- 8.1.3. Current Account
- 8.1.4. Consumer Credit
- 8.1.5. Loans
- 8.1.6. Others
- 8.2. Market Analysis, Insights and Forecast - by End-User Type
- 8.2.1. Business Segment
- 8.2.2. Personal Segment
- 8.1. Market Analysis, Insights and Forecast - by Service Type
- 9. Europe APAC Neo Banks Industry Analysis, Insights and Forecast, 2020-2032
- 9.1. Market Analysis, Insights and Forecast - by Service Type
- 9.1.1. Payments
- 9.1.2. Savings Products
- 9.1.3. Current Account
- 9.1.4. Consumer Credit
- 9.1.5. Loans
- 9.1.6. Others
- 9.2. Market Analysis, Insights and Forecast - by End-User Type
- 9.2.1. Business Segment
- 9.2.2. Personal Segment
- 9.1. Market Analysis, Insights and Forecast - by Service Type
- 10. Middle East & Africa APAC Neo Banks Industry Analysis, Insights and Forecast, 2020-2032
- 10.1. Market Analysis, Insights and Forecast - by Service Type
- 10.1.1. Payments
- 10.1.2. Savings Products
- 10.1.3. Current Account
- 10.1.4. Consumer Credit
- 10.1.5. Loans
- 10.1.6. Others
- 10.2. Market Analysis, Insights and Forecast - by End-User Type
- 10.2.1. Business Segment
- 10.2.2. Personal Segment
- 10.1. Market Analysis, Insights and Forecast - by Service Type
- 11. Asia Pacific APAC Neo Banks Industry Analysis, Insights and Forecast, 2020-2032
- 11.1. Market Analysis, Insights and Forecast - by Service Type
- 11.1.1. Payments
- 11.1.2. Savings Products
- 11.1.3. Current Account
- 11.1.4. Consumer Credit
- 11.1.5. Loans
- 11.1.6. Others
- 11.2. Market Analysis, Insights and Forecast - by End-User Type
- 11.2.1. Business Segment
- 11.2.2. Personal Segment
- 11.1. Market Analysis, Insights and Forecast - by Service Type
- 12. Competitive Analysis
- 12.1. Company Profiles
- 12.1.1 WE Bank
- 12.1.1.1. Company Overview
- 12.1.1.2. Products
- 12.1.1.3. Company Financials
- 12.1.1.4. SWOT Analysis
- 12.1.2 MY Bank
- 12.1.2.1. Company Overview
- 12.1.2.2. Products
- 12.1.2.3. Company Financials
- 12.1.2.4. SWOT Analysis
- 12.1.3 Eon
- 12.1.3.1. Company Overview
- 12.1.3.2. Products
- 12.1.3.3. Company Financials
- 12.1.3.4. SWOT Analysis
- 12.1.4 Paytm Payments Bank
- 12.1.4.1. Company Overview
- 12.1.4.2. Products
- 12.1.4.3. Company Financials
- 12.1.4.4. SWOT Analysis
- 12.1.5 Digi bank
- 12.1.5.1. Company Overview
- 12.1.5.2. Products
- 12.1.5.3. Company Financials
- 12.1.5.4. SWOT Analysis
- 12.1.6 Jenius
- 12.1.6.1. Company Overview
- 12.1.6.2. Products
- 12.1.6.3. Company Financials
- 12.1.6.4. SWOT Analysis
- 12.1.7 SBI Sumishin Net Bank
- 12.1.7.1. Company Overview
- 12.1.7.2. Products
- 12.1.7.3. Company Financials
- 12.1.7.4. SWOT Analysis
- 12.1.8 Kakao Bank
- 12.1.8.1. Company Overview
- 12.1.8.2. Products
- 12.1.8.3. Company Financials
- 12.1.8.4. SWOT Analysis
- 12.1.9 K Plus
- 12.1.9.1. Company Overview
- 12.1.9.2. Products
- 12.1.9.3. Company Financials
- 12.1.9.4. SWOT Analysis
- 12.1.10 Timo
- 12.1.10.1. Company Overview
- 12.1.10.2. Products
- 12.1.10.3. Company Financials
- 12.1.10.4. SWOT Analysis
- 12.1.11 Volt
- 12.1.11.1. Company Overview
- 12.1.11.2. Products
- 12.1.11.3. Company Financials
- 12.1.11.4. SWOT Analysis
- 12.1.12 Xinja
- 12.1.12.1. Company Overview
- 12.1.12.2. Products
- 12.1.12.3. Company Financials
- 12.1.12.4. SWOT Analysis
- 12.1.13 BigPay
- 12.1.13.1. Company Overview
- 12.1.13.2. Products
- 12.1.13.3. Company Financials
- 12.1.13.4. SWOT Analysis
- 12.1.14 Neat**List Not Exhaustive
- 12.1.14.1. Company Overview
- 12.1.14.2. Products
- 12.1.14.3. Company Financials
- 12.1.14.4. SWOT Analysis
- 12.1.1 WE Bank
- 12.2. Market Entropy
- 12.2.1 Company's Key Areas Served
- 12.2.2 Recent Developments
- 12.3. Company Market Share Analysis 2025
- 12.3.1 Top 5 Companies Market Share Analysis
- 12.3.2 Top 3 Companies Market Share Analysis
- 12.4. List of Potential Customers
- 13. Research Methodology
List of Figures
- Figure 1: Global APAC Neo Banks Industry Revenue Breakdown (Million, %) by Region 2025 & 2033
- Figure 2: Global APAC Neo Banks Industry Volume Breakdown (Billion, %) by Region 2025 & 2033
- Figure 3: North America APAC Neo Banks Industry Revenue (Million), by Service Type 2025 & 2033
- Figure 4: North America APAC Neo Banks Industry Volume (Billion), by Service Type 2025 & 2033
- Figure 5: North America APAC Neo Banks Industry Revenue Share (%), by Service Type 2025 & 2033
- Figure 6: North America APAC Neo Banks Industry Volume Share (%), by Service Type 2025 & 2033
- Figure 7: North America APAC Neo Banks Industry Revenue (Million), by End-User Type 2025 & 2033
- Figure 8: North America APAC Neo Banks Industry Volume (Billion), by End-User Type 2025 & 2033
- Figure 9: North America APAC Neo Banks Industry Revenue Share (%), by End-User Type 2025 & 2033
- Figure 10: North America APAC Neo Banks Industry Volume Share (%), by End-User Type 2025 & 2033
- Figure 11: North America APAC Neo Banks Industry Revenue (Million), by Country 2025 & 2033
- Figure 12: North America APAC Neo Banks Industry Volume (Billion), by Country 2025 & 2033
- Figure 13: North America APAC Neo Banks Industry Revenue Share (%), by Country 2025 & 2033
- Figure 14: North America APAC Neo Banks Industry Volume Share (%), by Country 2025 & 2033
- Figure 15: South America APAC Neo Banks Industry Revenue (Million), by Service Type 2025 & 2033
- Figure 16: South America APAC Neo Banks Industry Volume (Billion), by Service Type 2025 & 2033
- Figure 17: South America APAC Neo Banks Industry Revenue Share (%), by Service Type 2025 & 2033
- Figure 18: South America APAC Neo Banks Industry Volume Share (%), by Service Type 2025 & 2033
- Figure 19: South America APAC Neo Banks Industry Revenue (Million), by End-User Type 2025 & 2033
- Figure 20: South America APAC Neo Banks Industry Volume (Billion), by End-User Type 2025 & 2033
- Figure 21: South America APAC Neo Banks Industry Revenue Share (%), by End-User Type 2025 & 2033
- Figure 22: South America APAC Neo Banks Industry Volume Share (%), by End-User Type 2025 & 2033
- Figure 23: South America APAC Neo Banks Industry Revenue (Million), by Country 2025 & 2033
- Figure 24: South America APAC Neo Banks Industry Volume (Billion), by Country 2025 & 2033
- Figure 25: South America APAC Neo Banks Industry Revenue Share (%), by Country 2025 & 2033
- Figure 26: South America APAC Neo Banks Industry Volume Share (%), by Country 2025 & 2033
- Figure 27: Europe APAC Neo Banks Industry Revenue (Million), by Service Type 2025 & 2033
- Figure 28: Europe APAC Neo Banks Industry Volume (Billion), by Service Type 2025 & 2033
- Figure 29: Europe APAC Neo Banks Industry Revenue Share (%), by Service Type 2025 & 2033
- Figure 30: Europe APAC Neo Banks Industry Volume Share (%), by Service Type 2025 & 2033
- Figure 31: Europe APAC Neo Banks Industry Revenue (Million), by End-User Type 2025 & 2033
- Figure 32: Europe APAC Neo Banks Industry Volume (Billion), by End-User Type 2025 & 2033
- Figure 33: Europe APAC Neo Banks Industry Revenue Share (%), by End-User Type 2025 & 2033
- Figure 34: Europe APAC Neo Banks Industry Volume Share (%), by End-User Type 2025 & 2033
- Figure 35: Europe APAC Neo Banks Industry Revenue (Million), by Country 2025 & 2033
- Figure 36: Europe APAC Neo Banks Industry Volume (Billion), by Country 2025 & 2033
- Figure 37: Europe APAC Neo Banks Industry Revenue Share (%), by Country 2025 & 2033
- Figure 38: Europe APAC Neo Banks Industry Volume Share (%), by Country 2025 & 2033
- Figure 39: Middle East & Africa APAC Neo Banks Industry Revenue (Million), by Service Type 2025 & 2033
- Figure 40: Middle East & Africa APAC Neo Banks Industry Volume (Billion), by Service Type 2025 & 2033
- Figure 41: Middle East & Africa APAC Neo Banks Industry Revenue Share (%), by Service Type 2025 & 2033
- Figure 42: Middle East & Africa APAC Neo Banks Industry Volume Share (%), by Service Type 2025 & 2033
- Figure 43: Middle East & Africa APAC Neo Banks Industry Revenue (Million), by End-User Type 2025 & 2033
- Figure 44: Middle East & Africa APAC Neo Banks Industry Volume (Billion), by End-User Type 2025 & 2033
- Figure 45: Middle East & Africa APAC Neo Banks Industry Revenue Share (%), by End-User Type 2025 & 2033
- Figure 46: Middle East & Africa APAC Neo Banks Industry Volume Share (%), by End-User Type 2025 & 2033
- Figure 47: Middle East & Africa APAC Neo Banks Industry Revenue (Million), by Country 2025 & 2033
- Figure 48: Middle East & Africa APAC Neo Banks Industry Volume (Billion), by Country 2025 & 2033
- Figure 49: Middle East & Africa APAC Neo Banks Industry Revenue Share (%), by Country 2025 & 2033
- Figure 50: Middle East & Africa APAC Neo Banks Industry Volume Share (%), by Country 2025 & 2033
- Figure 51: Asia Pacific APAC Neo Banks Industry Revenue (Million), by Service Type 2025 & 2033
- Figure 52: Asia Pacific APAC Neo Banks Industry Volume (Billion), by Service Type 2025 & 2033
- Figure 53: Asia Pacific APAC Neo Banks Industry Revenue Share (%), by Service Type 2025 & 2033
- Figure 54: Asia Pacific APAC Neo Banks Industry Volume Share (%), by Service Type 2025 & 2033
- Figure 55: Asia Pacific APAC Neo Banks Industry Revenue (Million), by End-User Type 2025 & 2033
- Figure 56: Asia Pacific APAC Neo Banks Industry Volume (Billion), by End-User Type 2025 & 2033
- Figure 57: Asia Pacific APAC Neo Banks Industry Revenue Share (%), by End-User Type 2025 & 2033
- Figure 58: Asia Pacific APAC Neo Banks Industry Volume Share (%), by End-User Type 2025 & 2033
- Figure 59: Asia Pacific APAC Neo Banks Industry Revenue (Million), by Country 2025 & 2033
- Figure 60: Asia Pacific APAC Neo Banks Industry Volume (Billion), by Country 2025 & 2033
- Figure 61: Asia Pacific APAC Neo Banks Industry Revenue Share (%), by Country 2025 & 2033
- Figure 62: Asia Pacific APAC Neo Banks Industry Volume Share (%), by Country 2025 & 2033
List of Tables
- Table 1: Global APAC Neo Banks Industry Revenue Million Forecast, by Service Type 2020 & 2033
- Table 2: Global APAC Neo Banks Industry Volume Billion Forecast, by Service Type 2020 & 2033
- Table 3: Global APAC Neo Banks Industry Revenue Million Forecast, by End-User Type 2020 & 2033
- Table 4: Global APAC Neo Banks Industry Volume Billion Forecast, by End-User Type 2020 & 2033
- Table 5: Global APAC Neo Banks Industry Revenue Million Forecast, by Region 2020 & 2033
- Table 6: Global APAC Neo Banks Industry Volume Billion Forecast, by Region 2020 & 2033
- Table 7: Global APAC Neo Banks Industry Revenue Million Forecast, by Service Type 2020 & 2033
- Table 8: Global APAC Neo Banks Industry Volume Billion Forecast, by Service Type 2020 & 2033
- Table 9: Global APAC Neo Banks Industry Revenue Million Forecast, by End-User Type 2020 & 2033
- Table 10: Global APAC Neo Banks Industry Volume Billion Forecast, by End-User Type 2020 & 2033
- Table 11: Global APAC Neo Banks Industry Revenue Million Forecast, by Country 2020 & 2033
- Table 12: Global APAC Neo Banks Industry Volume Billion Forecast, by Country 2020 & 2033
- Table 13: United States APAC Neo Banks Industry Revenue (Million) Forecast, by Application 2020 & 2033
- Table 14: United States APAC Neo Banks Industry Volume (Billion) Forecast, by Application 2020 & 2033
- Table 15: Canada APAC Neo Banks Industry Revenue (Million) Forecast, by Application 2020 & 2033
- Table 16: Canada APAC Neo Banks Industry Volume (Billion) Forecast, by Application 2020 & 2033
- Table 17: Mexico APAC Neo Banks Industry Revenue (Million) Forecast, by Application 2020 & 2033
- Table 18: Mexico APAC Neo Banks Industry Volume (Billion) Forecast, by Application 2020 & 2033
- Table 19: Global APAC Neo Banks Industry Revenue Million Forecast, by Service Type 2020 & 2033
- Table 20: Global APAC Neo Banks Industry Volume Billion Forecast, by Service Type 2020 & 2033
- Table 21: Global APAC Neo Banks Industry Revenue Million Forecast, by End-User Type 2020 & 2033
- Table 22: Global APAC Neo Banks Industry Volume Billion Forecast, by End-User Type 2020 & 2033
- Table 23: Global APAC Neo Banks Industry Revenue Million Forecast, by Country 2020 & 2033
- Table 24: Global APAC Neo Banks Industry Volume Billion Forecast, by Country 2020 & 2033
- Table 25: Brazil APAC Neo Banks Industry Revenue (Million) Forecast, by Application 2020 & 2033
- Table 26: Brazil APAC Neo Banks Industry Volume (Billion) Forecast, by Application 2020 & 2033
- Table 27: Argentina APAC Neo Banks Industry Revenue (Million) Forecast, by Application 2020 & 2033
- Table 28: Argentina APAC Neo Banks Industry Volume (Billion) Forecast, by Application 2020 & 2033
- Table 29: Rest of South America APAC Neo Banks Industry Revenue (Million) Forecast, by Application 2020 & 2033
- Table 30: Rest of South America APAC Neo Banks Industry Volume (Billion) Forecast, by Application 2020 & 2033
- Table 31: Global APAC Neo Banks Industry Revenue Million Forecast, by Service Type 2020 & 2033
- Table 32: Global APAC Neo Banks Industry Volume Billion Forecast, by Service Type 2020 & 2033
- Table 33: Global APAC Neo Banks Industry Revenue Million Forecast, by End-User Type 2020 & 2033
- Table 34: Global APAC Neo Banks Industry Volume Billion Forecast, by End-User Type 2020 & 2033
- Table 35: Global APAC Neo Banks Industry Revenue Million Forecast, by Country 2020 & 2033
- Table 36: Global APAC Neo Banks Industry Volume Billion Forecast, by Country 2020 & 2033
- Table 37: United Kingdom APAC Neo Banks Industry Revenue (Million) Forecast, by Application 2020 & 2033
- Table 38: United Kingdom APAC Neo Banks Industry Volume (Billion) Forecast, by Application 2020 & 2033
- Table 39: Germany APAC Neo Banks Industry Revenue (Million) Forecast, by Application 2020 & 2033
- Table 40: Germany APAC Neo Banks Industry Volume (Billion) Forecast, by Application 2020 & 2033
- Table 41: France APAC Neo Banks Industry Revenue (Million) Forecast, by Application 2020 & 2033
- Table 42: France APAC Neo Banks Industry Volume (Billion) Forecast, by Application 2020 & 2033
- Table 43: Italy APAC Neo Banks Industry Revenue (Million) Forecast, by Application 2020 & 2033
- Table 44: Italy APAC Neo Banks Industry Volume (Billion) Forecast, by Application 2020 & 2033
- Table 45: Spain APAC Neo Banks Industry Revenue (Million) Forecast, by Application 2020 & 2033
- Table 46: Spain APAC Neo Banks Industry Volume (Billion) Forecast, by Application 2020 & 2033
- Table 47: Russia APAC Neo Banks Industry Revenue (Million) Forecast, by Application 2020 & 2033
- Table 48: Russia APAC Neo Banks Industry Volume (Billion) Forecast, by Application 2020 & 2033
- Table 49: Benelux APAC Neo Banks Industry Revenue (Million) Forecast, by Application 2020 & 2033
- Table 50: Benelux APAC Neo Banks Industry Volume (Billion) Forecast, by Application 2020 & 2033
- Table 51: Nordics APAC Neo Banks Industry Revenue (Million) Forecast, by Application 2020 & 2033
- Table 52: Nordics APAC Neo Banks Industry Volume (Billion) Forecast, by Application 2020 & 2033
- Table 53: Rest of Europe APAC Neo Banks Industry Revenue (Million) Forecast, by Application 2020 & 2033
- Table 54: Rest of Europe APAC Neo Banks Industry Volume (Billion) Forecast, by Application 2020 & 2033
- Table 55: Global APAC Neo Banks Industry Revenue Million Forecast, by Service Type 2020 & 2033
- Table 56: Global APAC Neo Banks Industry Volume Billion Forecast, by Service Type 2020 & 2033
- Table 57: Global APAC Neo Banks Industry Revenue Million Forecast, by End-User Type 2020 & 2033
- Table 58: Global APAC Neo Banks Industry Volume Billion Forecast, by End-User Type 2020 & 2033
- Table 59: Global APAC Neo Banks Industry Revenue Million Forecast, by Country 2020 & 2033
- Table 60: Global APAC Neo Banks Industry Volume Billion Forecast, by Country 2020 & 2033
- Table 61: Turkey APAC Neo Banks Industry Revenue (Million) Forecast, by Application 2020 & 2033
- Table 62: Turkey APAC Neo Banks Industry Volume (Billion) Forecast, by Application 2020 & 2033
- Table 63: Israel APAC Neo Banks Industry Revenue (Million) Forecast, by Application 2020 & 2033
- Table 64: Israel APAC Neo Banks Industry Volume (Billion) Forecast, by Application 2020 & 2033
- Table 65: GCC APAC Neo Banks Industry Revenue (Million) Forecast, by Application 2020 & 2033
- Table 66: GCC APAC Neo Banks Industry Volume (Billion) Forecast, by Application 2020 & 2033
- Table 67: North Africa APAC Neo Banks Industry Revenue (Million) Forecast, by Application 2020 & 2033
- Table 68: North Africa APAC Neo Banks Industry Volume (Billion) Forecast, by Application 2020 & 2033
- Table 69: South Africa APAC Neo Banks Industry Revenue (Million) Forecast, by Application 2020 & 2033
- Table 70: South Africa APAC Neo Banks Industry Volume (Billion) Forecast, by Application 2020 & 2033
- Table 71: Rest of Middle East & Africa APAC Neo Banks Industry Revenue (Million) Forecast, by Application 2020 & 2033
- Table 72: Rest of Middle East & Africa APAC Neo Banks Industry Volume (Billion) Forecast, by Application 2020 & 2033
- Table 73: Global APAC Neo Banks Industry Revenue Million Forecast, by Service Type 2020 & 2033
- Table 74: Global APAC Neo Banks Industry Volume Billion Forecast, by Service Type 2020 & 2033
- Table 75: Global APAC Neo Banks Industry Revenue Million Forecast, by End-User Type 2020 & 2033
- Table 76: Global APAC Neo Banks Industry Volume Billion Forecast, by End-User Type 2020 & 2033
- Table 77: Global APAC Neo Banks Industry Revenue Million Forecast, by Country 2020 & 2033
- Table 78: Global APAC Neo Banks Industry Volume Billion Forecast, by Country 2020 & 2033
- Table 79: China APAC Neo Banks Industry Revenue (Million) Forecast, by Application 2020 & 2033
- Table 80: China APAC Neo Banks Industry Volume (Billion) Forecast, by Application 2020 & 2033
- Table 81: India APAC Neo Banks Industry Revenue (Million) Forecast, by Application 2020 & 2033
- Table 82: India APAC Neo Banks Industry Volume (Billion) Forecast, by Application 2020 & 2033
- Table 83: Japan APAC Neo Banks Industry Revenue (Million) Forecast, by Application 2020 & 2033
- Table 84: Japan APAC Neo Banks Industry Volume (Billion) Forecast, by Application 2020 & 2033
- Table 85: South Korea APAC Neo Banks Industry Revenue (Million) Forecast, by Application 2020 & 2033
- Table 86: South Korea APAC Neo Banks Industry Volume (Billion) Forecast, by Application 2020 & 2033
- Table 87: ASEAN APAC Neo Banks Industry Revenue (Million) Forecast, by Application 2020 & 2033
- Table 88: ASEAN APAC Neo Banks Industry Volume (Billion) Forecast, by Application 2020 & 2033
- Table 89: Oceania APAC Neo Banks Industry Revenue (Million) Forecast, by Application 2020 & 2033
- Table 90: Oceania APAC Neo Banks Industry Volume (Billion) Forecast, by Application 2020 & 2033
- Table 91: Rest of Asia Pacific APAC Neo Banks Industry Revenue (Million) Forecast, by Application 2020 & 2033
- Table 92: Rest of Asia Pacific APAC Neo Banks Industry Volume (Billion) Forecast, by Application 2020 & 2033
Frequently Asked Questions
1. What is the projected Compound Annual Growth Rate (CAGR) of the APAC Neo Banks Industry?
The projected CAGR is approximately > 9.00%.
2. Which companies are prominent players in the APAC Neo Banks Industry?
Key companies in the market include WE Bank, MY Bank, Eon, Paytm Payments Bank, Digi bank, Jenius, SBI Sumishin Net Bank, Kakao Bank, K Plus, Timo, Volt, Xinja, BigPay, Neat**List Not Exhaustive.
3. What are the main segments of the APAC Neo Banks Industry?
The market segments include Service Type, End-User Type.
4. Can you provide details about the market size?
The market size is estimated to be USD 1.68 Million as of 2022.
5. What are some drivers contributing to market growth?
Increase in Internet Penetration is Driving the Market.
6. What are the notable trends driving market growth?
Raise in Mobile Penetration and High Unbanked Adults in the Region.
7. Are there any restraints impacting market growth?
Increase in Internet Penetration is Driving the Market.
8. Can you provide examples of recent developments in the market?
In October 2023, Paytm launched the industry’s first alternate ID-based guest checkout solution for merchants. Tokenisation masks the 16-digit debit or credit card number with a unique token that is specific to one’s card to prevent misuse and theft from merchant websites.
9. What pricing options are available for accessing the report?
Pricing options include single-user, multi-user, and enterprise licenses priced at USD 4750, USD 5250, and USD 8750 respectively.
10. Is the market size provided in terms of value or volume?
The market size is provided in terms of value, measured in Million and volume, measured in Billion.
11. Are there any specific market keywords associated with the report?
Yes, the market keyword associated with the report is "APAC Neo Banks Industry," which aids in identifying and referencing the specific market segment covered.
12. How do I determine which pricing option suits my needs best?
The pricing options vary based on user requirements and access needs. Individual users may opt for single-user licenses, while businesses requiring broader access may choose multi-user or enterprise licenses for cost-effective access to the report.
13. Are there any additional resources or data provided in the APAC Neo Banks Industry report?
While the report offers comprehensive insights, it's advisable to review the specific contents or supplementary materials provided to ascertain if additional resources or data are available.
14. How can I stay updated on further developments or reports in the APAC Neo Banks Industry?
To stay informed about further developments, trends, and reports in the APAC Neo Banks Industry, consider subscribing to industry newsletters, following relevant companies and organizations, or regularly checking reputable industry news sources and publications.
Methodology
Step 1 - Identification of Relevant Samples Size from Population Database


Step 2 - Approaches for Defining Global Market Size (Value, Volume* & Price*)

Note*: In applicable scenarios
Step 3 - Data Sources
Primary Research
- Web Analytics
- Survey Reports
- Research Institute
- Latest Research Reports
- Opinion Leaders
Secondary Research
- Annual Reports
- White Paper
- Latest Press Release
- Industry Association
- Paid Database
- Investor Presentations

Step 4 - Data Triangulation
Involves using different sources of information in order to increase the validity of a study
These sources are likely to be stakeholders in a program - participants, other researchers, program staff, other community members, and so on.
Then we put all data in single framework & apply various statistical tools to find out the dynamic on the market.
During the analysis stage, feedback from the stakeholder groups would be compared to determine areas of agreement as well as areas of divergence