

Key Insights
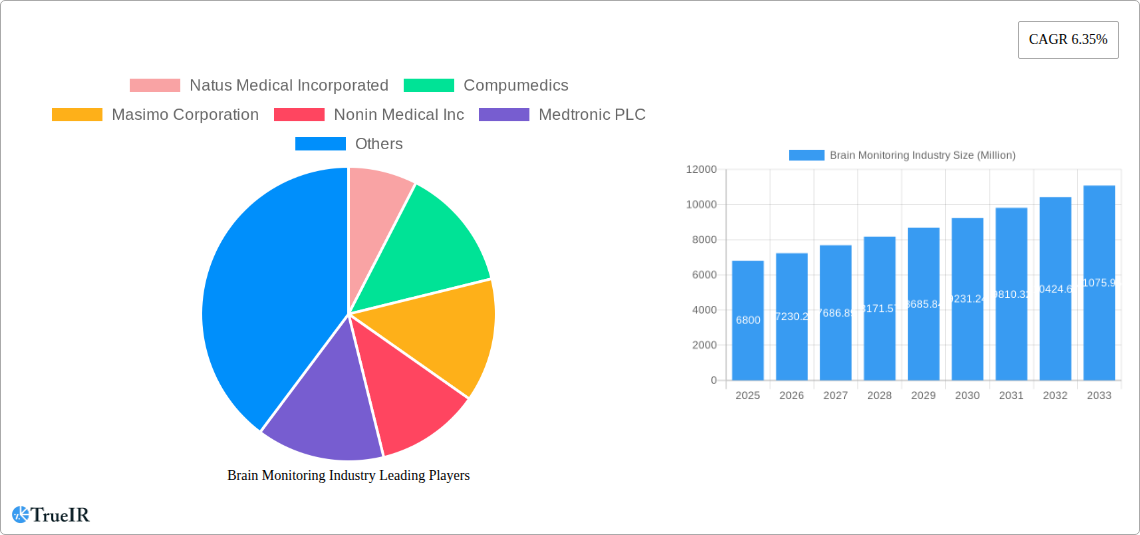
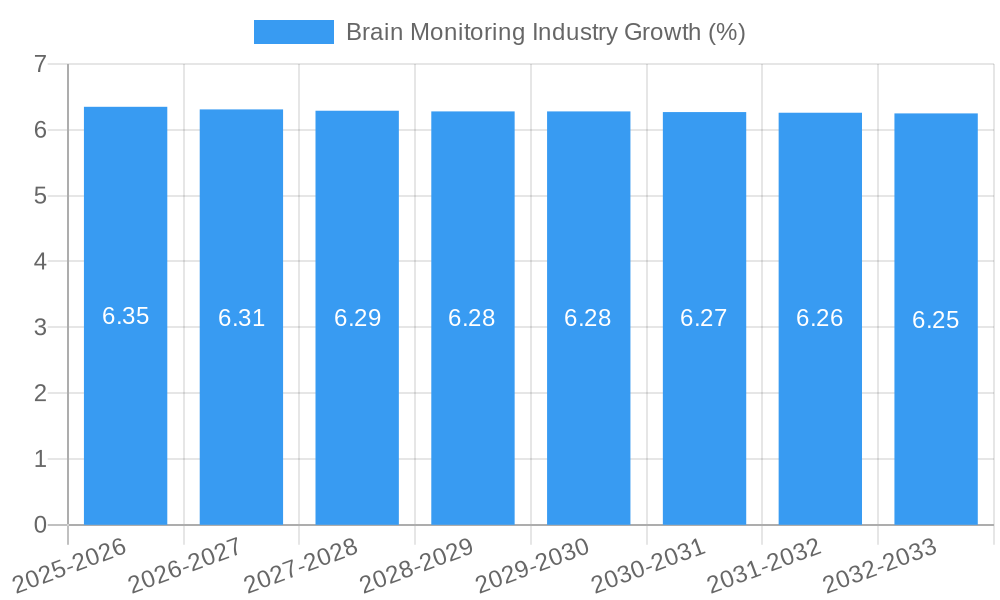
The global Brain Monitoring market is poised for substantial growth, with an estimated market size of $6.80 billion in the base year 2025, projected to expand at a Compound Annual Growth Rate (CAGR) of 6.35% through 2033. This robust expansion is fueled by a confluence of factors, including the increasing prevalence of neurological disorders such as Parkinson's disease, dementia, and epilepsy, which necessitate advanced monitoring solutions for timely diagnosis and effective management. Furthermore, a growing awareness and demand for sophisticated diagnostic tools, coupled with advancements in neurotechnology, are significant market drivers. The rising incidence of traumatic brain injuries (TBIs) due to accidents and sports-related incidents further accentuates the need for reliable brain monitoring devices, especially in critical care settings. The market's trajectory is also positively influenced by increasing healthcare expenditure globally, particularly in emerging economies, and a greater emphasis on preventative healthcare and early disease detection.
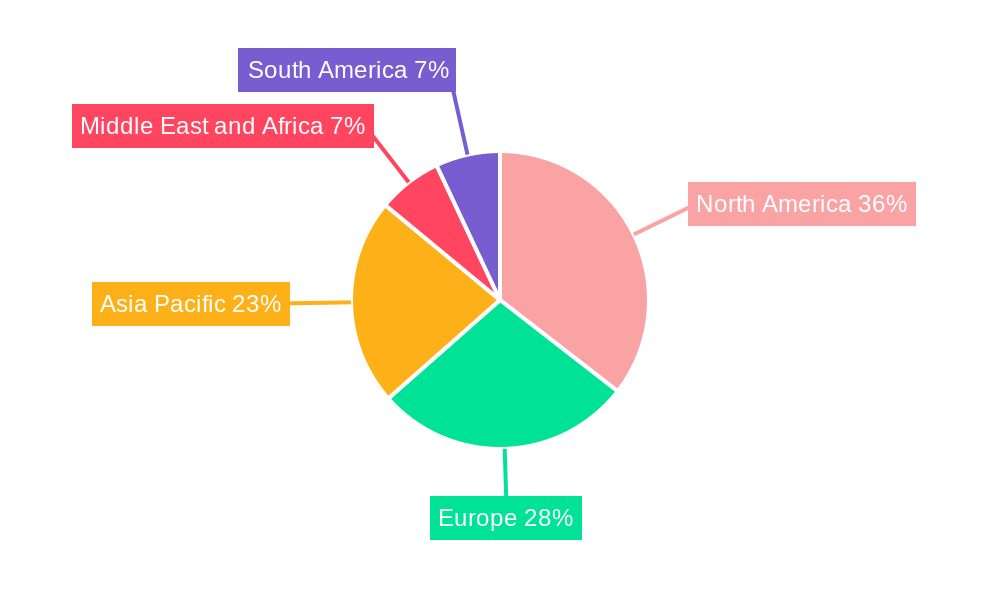
The Brain Monitoring industry encompasses a diverse range of product types, with Magnetoencephalographs (MEG) and Electroencephalographs (EEG) being pivotal in understanding brain activity, while devices like Cerebral Oximeters and Functional Magnetic Resonance Imaging (fMRI) offer deeper insights into brain function and blood flow. Intracranial Pressure Monitoring Devices play a critical role in managing acute neurological conditions. Hospitals and diagnostic centers represent the primary end-users, owing to the critical nature of neurological assessments and treatments performed within these facilities. Geographically, North America is expected to maintain a dominant market share, driven by sophisticated healthcare infrastructure and high adoption rates of advanced medical technologies. However, the Asia Pacific region is anticipated to witness the fastest growth, propelled by a burgeoning patient pool, increasing investments in healthcare, and a growing number of skilled medical professionals. Emerging trends include the integration of artificial intelligence and machine learning for enhanced data analysis and predictive diagnostics, alongside the development of less invasive and more portable monitoring solutions.
This comprehensive report delves into the dynamic brain monitoring industry, offering in-depth analysis of market trends, growth drivers, competitive landscape, and future outlook. Leveraging high-volume keywords such as EEG devices, brain imaging technology, neurological disorders monitoring, traumatic brain injury diagnosis, epilepsy management, and dementia detection, this report is engineered for maximum SEO impact and to provide invaluable insights to industry stakeholders. The study covers the historical period from 2019–2024, with a base year of 2025 and a forecast period extending to 2033.
Brain Monitoring Industry Market Structure & Competitive Landscape
The brain monitoring market is characterized by a moderate to high level of concentration, with key players like Natus Medical Incorporated, Compumedics, Masimo Corporation, and Medtronic PLC holding significant market shares. Innovation is a critical driver, fueled by advancements in neurological diagnostic tools and a growing demand for non-invasive monitoring solutions. Regulatory frameworks, particularly FDA approvals and CE marking, play a pivotal role in shaping market entry and product adoption. The threat of product substitutes is increasing with the development of advanced AI-driven diagnostic algorithms and wearable brain sensors. End-user segmentation highlights the dominance of hospitals and diagnostic centers in adopting sophisticated brain monitoring equipment. Mergers and acquisitions (M&A) are a recurring theme, with approximately 5-10 significant M&A deals annually over the historical period, aimed at consolidating market presence, acquiring new technologies, and expanding product portfolios. For instance, the acquisition of smaller tech companies by larger players is common to integrate cutting-edge AI into existing EEG monitoring systems and fMRI scanners.
Brain Monitoring Industry Market Trends & Opportunities
The global brain monitoring market is poised for substantial growth, with an estimated Compound Annual Growth Rate (CAGR) of 7.5% projected from 2025 to 2033. This expansion is driven by the escalating prevalence of neurological disorders, including Parkinson's disease, epilepsy, and dementia, which necessitates early and accurate diagnosis through advanced brain imaging techniques and EEG solutions. Technological shifts are pivotal, with a noticeable trend towards miniaturization, enhanced portability of brain monitoring devices, and the integration of artificial intelligence (AI) and machine learning (ML) for sophisticated data analysis and predictive diagnostics. Consumer preferences are increasingly leaning towards less invasive and more patient-friendly monitoring methods, leading to a higher adoption rate for advanced cerebral oximeters and non-invasive EEG monitoring platforms. Competitive dynamics are intensifying as established players invest heavily in R&D to develop next-generation brain monitoring equipment that offers improved accuracy, real-time data, and remote monitoring capabilities. Opportunities lie in developing integrated solutions for chronic neurological condition management, expanding into emerging markets with growing healthcare infrastructure, and leveraging the increasing use of brain monitoring in pharmaceutical drug trials for neurodegenerative diseases. The market penetration for advanced brain monitoring systems is projected to reach approximately 30% by 2033, driven by increased awareness and accessibility.
Dominant Markets & Segments in Brain Monitoring Industry
The brain monitoring industry is dominated by segments that cater to the most prevalent neurological conditions and offer critical diagnostic and monitoring capabilities. In terms of Product Type, the Electroencephalograph (EEG) segment is the largest and is expected to maintain its lead due to its widespread application in diagnosing epilepsy, sleep disorders, and brain injuries, with market share exceeding 35% of the total product revenue. The Intracranial Pressure Monitoring Devices segment, though smaller, is crucial for critical care settings and is experiencing steady growth. Application-wise, Epilepsy and Traumatic Brain Injury (TBI) represent the most significant markets, driven by high incidence rates and the critical need for continuous monitoring and timely intervention. The Dementia and Parkinson's Disease applications are witnessing rapid expansion due to the aging global population and advancements in early diagnostic tools. End User analysis reveals that Hospitals command the largest market share, accounting for over 60% of revenue, owing to their comprehensive diagnostic and treatment facilities. However, Diagnostic Centers are emerging as a fast-growing segment.
- Electroencephalograph (EEG): Dominant product type due to its versatility in diagnosing various neurological conditions. Key growth drivers include increasing adoption in ambulatory settings and the development of wearable EEG devices.
- Epilepsy: A leading application segment, benefiting from the high prevalence and the need for continuous, long-term monitoring to manage seizures effectively.
- Traumatic Brain Injury (TBI): Significant market driven by the increasing incidence of head injuries in sports, accidents, and military conflicts. Growth is fueled by the demand for real-time brain function assessment in acute care.
- Hospitals: The primary end-user segment, characterized by substantial investments in advanced brain monitoring technology for intensive care units (ICUs), operating rooms, and diagnostic departments.
Brain Monitoring Industry Product Analysis
Innovations in the brain monitoring industry are largely focused on enhancing diagnostic accuracy, portability, and patient comfort. Electroencephalograph (EEG) devices are becoming more sophisticated with advanced signal processing capabilities, enabling clearer interpretation of brain activity. Cerebral oximeters are integrating non-invasive technologies for continuous blood oxygen monitoring in the brain, critical for stroke and TBI patients. Functional Magnetic Resonance Imaging (fMRI) is evolving with faster scanning times and higher resolution, improving its utility in research and clinical settings. The competitive advantage lies in developing integrated platforms that combine multiple monitoring modalities, offering a holistic view of brain health.
Key Drivers, Barriers & Challenges in Brain Monitoring Industry
Growth Drivers in the Brain Monitoring Industry Market The brain monitoring market is propelled by several key factors. Technological advancements, including the miniaturization of devices and AI integration for data analysis, are significantly enhancing diagnostic capabilities. The rising global burden of neurological disorders, such as Alzheimer's, Parkinson's, and epilepsy, creates a sustained demand for effective monitoring solutions. Favorable reimbursement policies and government initiatives aimed at improving neurological healthcare infrastructure further stimulate market growth. The increasing use of brain monitoring in clinical trials for neurodegenerative diseases also represents a significant growth catalyst, with an estimated XX Million investment in clinical trial monitoring technology over the forecast period.
Challenges Impacting Brain Monitoring Industry Growth Despite robust growth, the brain monitoring industry faces several challenges. High initial costs of advanced brain monitoring equipment, particularly fMRI systems, can be a barrier to adoption in resource-constrained settings. Stringent regulatory approval processes and the need for extensive clinical validation can delay product launches. Supply chain disruptions and the availability of skilled technicians for operating complex machinery are also significant concerns. Furthermore, the competitive pressure from established players and emerging startups necessitates continuous innovation and cost optimization, with approximately 15% of companies reporting increased R&D expenditure to combat competitive pressures.
Key Players Shaping the Brain Monitoring Industry Market
- Natus Medical Incorporated
- Compumedics
- Masimo Corporation
- Nonin Medical Inc
- Medtronic PLC
- Advanced Brain Monitoring Inc
- Cadwell Industries Inc
- Koninklijke Philips NV
- Integra Lifesciences Corporation
- Cerenion Oy
- Nihon Kohden Corporation
- General Electric Company
Significant Brain Monitoring Industry Industry Milestones
- November 2022: Neurosteer Inc. received FDA clearance for its Neurosteer single-channel EEG brain monitoring platform, enabling its use in a broad range of clinical settings for continuous ICU monitoring, early detection of cognitive decline (Alzheimer's, Parkinson's, dementia), and rapid screening in pharma drug trials.
- February 2022: Masimo received FDA clearance for its SedLine brain function monitoring for pediatric patients (1-17 years of age) and the SedLine Pediatric EEG Sensor. This expanded the benefits of SedLine to patients one-year-old and above, utilizing advanced signal processing for bilateral brain activity monitoring.
Future Outlook for Brain Monitoring Industry Market
The brain monitoring industry is set for continued robust growth, driven by ongoing technological advancements, increasing awareness of neurological health, and the expanding applications of brain monitoring technology. The integration of AI and cloud-based platforms will revolutionize data analysis and enable remote patient monitoring, creating significant market opportunities. Expansion into emerging economies with growing healthcare expenditures and the development of more affordable and user-friendly devices will further fuel market penetration. Strategic collaborations between technology providers and healthcare institutions are expected to accelerate the adoption of cutting-edge brain monitoring solutions, particularly for managing chronic neurological conditions and supporting personalized medicine approaches. The market is projected to reach an estimated value of XX Million by 2033.
Brain Monitoring Industry Segmentation
-
1. Product Type
- 1.1. Magnetoencephalograph
- 1.2. Electroencephalograph
- 1.3. Cerebral Oximeters
- 1.4. Functional Magnetic Resonance Imaging (fMRI)
- 1.5. Intracranial Pressure Monitoring Devices
- 1.6. Other Product Types
-
2. Application
- 2.1. Parkinson's Disease
- 2.2. Traumatic Brain Injury
- 2.3. Epilepsy
- 2.4. Dementia
- 2.5. Sleep Disorders
- 2.6. Other Applications
-
3. End User
- 3.1. Hospitals
- 3.2. Diagnostic Centers
Brain Monitoring Industry Segmentation By Geography
-
1. North America
- 1.1. United States
- 1.2. Canada
- 1.3. Mexico
-
2. Europe
- 2.1. Germany
- 2.2. United Kingdom
- 2.3. France
- 2.4. Italy
- 2.5. Spain
- 2.6. Rest of Europe
-
3. Asia Pacific
- 3.1. China
- 3.2. Japan
- 3.3. India
- 3.4. Australia
- 3.5. South Korea
- 3.6. Rest of Asia Pacific
-
4. Middle East and Africa
- 4.1. GCC
- 4.2. South Africa
- 4.3. Rest of Middle East and Africa
-
5. South America
- 5.1. Brazil
- 5.2. Argentina
- 5.3. Rest of South America
Brain Monitoring Industry REPORT HIGHLIGHTS
| Aspects | Details |
|---|---|
| Study Period | 2019-2033 |
| Base Year | 2024 |
| Estimated Year | 2025 |
| Forecast Period | 2025-2033 |
| Historical Period | 2019-2024 |
| Growth Rate | CAGR of 6.35% from 2019-2033 |
| Segmentation |
|
Table of Contents
- 1. Introduction
- 1.1. Research Scope
- 1.2. Market Segmentation
- 1.3. Research Methodology
- 1.4. Definitions and Assumptions
- 2. Executive Summary
- 2.1. Introduction
- 3. Market Dynamics
- 3.1. Introduction
- 3.2. Market Drivers
- 3.2.1. Growing Geriatric Population; Rise in Incidences of Brain Disorders; Technological Advancements in Brain Monitoring Devices
- 3.3. Market Restrains
- 3.3.1. Stringent Regulations for the Device Approval; Lack of Skilled Personnel to Handle Devices
- 3.4. Market Trends
- 3.4.1. Electroencephalograph is Expected Witness a Healthy Growth Over the Forecast Period
- 4. Market Factor Analysis
- 4.1. Porters Five Forces
- 4.2. Supply/Value Chain
- 4.3. PESTEL analysis
- 4.4. Market Entropy
- 4.5. Patent/Trademark Analysis
- 5. Global Brain Monitoring Industry Analysis, Insights and Forecast, 2019-2031
- 5.1. Market Analysis, Insights and Forecast - by Product Type
- 5.1.1. Magnetoencephalograph
- 5.1.2. Electroencephalograph
- 5.1.3. Cerebral Oximeters
- 5.1.4. Functional Magnetic Resonance Imaging (fMRI)
- 5.1.5. Intracranial Pressure Monitoring Devices
- 5.1.6. Other Product Types
- 5.2. Market Analysis, Insights and Forecast - by Application
- 5.2.1. Parkinson's Disease
- 5.2.2. Traumatic Brain Injury
- 5.2.3. Epilepsy
- 5.2.4. Dementia
- 5.2.5. Sleep Disorders
- 5.2.6. Other Applications
- 5.3. Market Analysis, Insights and Forecast - by End User
- 5.3.1. Hospitals
- 5.3.2. Diagnostic Centers
- 5.4. Market Analysis, Insights and Forecast - by Region
- 5.4.1. North America
- 5.4.2. Europe
- 5.4.3. Asia Pacific
- 5.4.4. Middle East and Africa
- 5.4.5. South America
- 5.1. Market Analysis, Insights and Forecast - by Product Type
- 6. North America Brain Monitoring Industry Analysis, Insights and Forecast, 2019-2031
- 6.1. Market Analysis, Insights and Forecast - by Product Type
- 6.1.1. Magnetoencephalograph
- 6.1.2. Electroencephalograph
- 6.1.3. Cerebral Oximeters
- 6.1.4. Functional Magnetic Resonance Imaging (fMRI)
- 6.1.5. Intracranial Pressure Monitoring Devices
- 6.1.6. Other Product Types
- 6.2. Market Analysis, Insights and Forecast - by Application
- 6.2.1. Parkinson's Disease
- 6.2.2. Traumatic Brain Injury
- 6.2.3. Epilepsy
- 6.2.4. Dementia
- 6.2.5. Sleep Disorders
- 6.2.6. Other Applications
- 6.3. Market Analysis, Insights and Forecast - by End User
- 6.3.1. Hospitals
- 6.3.2. Diagnostic Centers
- 6.1. Market Analysis, Insights and Forecast - by Product Type
- 7. Europe Brain Monitoring Industry Analysis, Insights and Forecast, 2019-2031
- 7.1. Market Analysis, Insights and Forecast - by Product Type
- 7.1.1. Magnetoencephalograph
- 7.1.2. Electroencephalograph
- 7.1.3. Cerebral Oximeters
- 7.1.4. Functional Magnetic Resonance Imaging (fMRI)
- 7.1.5. Intracranial Pressure Monitoring Devices
- 7.1.6. Other Product Types
- 7.2. Market Analysis, Insights and Forecast - by Application
- 7.2.1. Parkinson's Disease
- 7.2.2. Traumatic Brain Injury
- 7.2.3. Epilepsy
- 7.2.4. Dementia
- 7.2.5. Sleep Disorders
- 7.2.6. Other Applications
- 7.3. Market Analysis, Insights and Forecast - by End User
- 7.3.1. Hospitals
- 7.3.2. Diagnostic Centers
- 7.1. Market Analysis, Insights and Forecast - by Product Type
- 8. Asia Pacific Brain Monitoring Industry Analysis, Insights and Forecast, 2019-2031
- 8.1. Market Analysis, Insights and Forecast - by Product Type
- 8.1.1. Magnetoencephalograph
- 8.1.2. Electroencephalograph
- 8.1.3. Cerebral Oximeters
- 8.1.4. Functional Magnetic Resonance Imaging (fMRI)
- 8.1.5. Intracranial Pressure Monitoring Devices
- 8.1.6. Other Product Types
- 8.2. Market Analysis, Insights and Forecast - by Application
- 8.2.1. Parkinson's Disease
- 8.2.2. Traumatic Brain Injury
- 8.2.3. Epilepsy
- 8.2.4. Dementia
- 8.2.5. Sleep Disorders
- 8.2.6. Other Applications
- 8.3. Market Analysis, Insights and Forecast - by End User
- 8.3.1. Hospitals
- 8.3.2. Diagnostic Centers
- 8.1. Market Analysis, Insights and Forecast - by Product Type
- 9. Middle East and Africa Brain Monitoring Industry Analysis, Insights and Forecast, 2019-2031
- 9.1. Market Analysis, Insights and Forecast - by Product Type
- 9.1.1. Magnetoencephalograph
- 9.1.2. Electroencephalograph
- 9.1.3. Cerebral Oximeters
- 9.1.4. Functional Magnetic Resonance Imaging (fMRI)
- 9.1.5. Intracranial Pressure Monitoring Devices
- 9.1.6. Other Product Types
- 9.2. Market Analysis, Insights and Forecast - by Application
- 9.2.1. Parkinson's Disease
- 9.2.2. Traumatic Brain Injury
- 9.2.3. Epilepsy
- 9.2.4. Dementia
- 9.2.5. Sleep Disorders
- 9.2.6. Other Applications
- 9.3. Market Analysis, Insights and Forecast - by End User
- 9.3.1. Hospitals
- 9.3.2. Diagnostic Centers
- 9.1. Market Analysis, Insights and Forecast - by Product Type
- 10. South America Brain Monitoring Industry Analysis, Insights and Forecast, 2019-2031
- 10.1. Market Analysis, Insights and Forecast - by Product Type
- 10.1.1. Magnetoencephalograph
- 10.1.2. Electroencephalograph
- 10.1.3. Cerebral Oximeters
- 10.1.4. Functional Magnetic Resonance Imaging (fMRI)
- 10.1.5. Intracranial Pressure Monitoring Devices
- 10.1.6. Other Product Types
- 10.2. Market Analysis, Insights and Forecast - by Application
- 10.2.1. Parkinson's Disease
- 10.2.2. Traumatic Brain Injury
- 10.2.3. Epilepsy
- 10.2.4. Dementia
- 10.2.5. Sleep Disorders
- 10.2.6. Other Applications
- 10.3. Market Analysis, Insights and Forecast - by End User
- 10.3.1. Hospitals
- 10.3.2. Diagnostic Centers
- 10.1. Market Analysis, Insights and Forecast - by Product Type
- 11. North America Brain Monitoring Industry Analysis, Insights and Forecast, 2019-2031
- 11.1. Market Analysis, Insights and Forecast - By Country/Sub-region
- 11.1.1 United States
- 11.1.2 Canada
- 11.1.3 Mexico
- 12. Europe Brain Monitoring Industry Analysis, Insights and Forecast, 2019-2031
- 12.1. Market Analysis, Insights and Forecast - By Country/Sub-region
- 12.1.1 Germany
- 12.1.2 United Kingdom
- 12.1.3 France
- 12.1.4 Italy
- 12.1.5 Spain
- 12.1.6 Rest of Europe
- 13. Asia Pacific Brain Monitoring Industry Analysis, Insights and Forecast, 2019-2031
- 13.1. Market Analysis, Insights and Forecast - By Country/Sub-region
- 13.1.1 China
- 13.1.2 Japan
- 13.1.3 India
- 13.1.4 Australia
- 13.1.5 South Korea
- 13.1.6 Rest of Asia Pacific
- 14. Middle East and Africa Brain Monitoring Industry Analysis, Insights and Forecast, 2019-2031
- 14.1. Market Analysis, Insights and Forecast - By Country/Sub-region
- 14.1.1 GCC
- 14.1.2 South Africa
- 14.1.3 Rest of Middle East and Africa
- 15. South America Brain Monitoring Industry Analysis, Insights and Forecast, 2019-2031
- 15.1. Market Analysis, Insights and Forecast - By Country/Sub-region
- 15.1.1 Brazil
- 15.1.2 Argentina
- 15.1.3 Rest of South America
- 16. Competitive Analysis
- 16.1. Global Market Share Analysis 2024
- 16.2. Company Profiles
- 16.2.1 Natus Medical Incorporated
- 16.2.1.1. Overview
- 16.2.1.2. Products
- 16.2.1.3. SWOT Analysis
- 16.2.1.4. Recent Developments
- 16.2.1.5. Financials (Based on Availability)
- 16.2.2 Compumedics
- 16.2.2.1. Overview
- 16.2.2.2. Products
- 16.2.2.3. SWOT Analysis
- 16.2.2.4. Recent Developments
- 16.2.2.5. Financials (Based on Availability)
- 16.2.3 Masimo Corporation
- 16.2.3.1. Overview
- 16.2.3.2. Products
- 16.2.3.3. SWOT Analysis
- 16.2.3.4. Recent Developments
- 16.2.3.5. Financials (Based on Availability)
- 16.2.4 Nonin Medical Inc
- 16.2.4.1. Overview
- 16.2.4.2. Products
- 16.2.4.3. SWOT Analysis
- 16.2.4.4. Recent Developments
- 16.2.4.5. Financials (Based on Availability)
- 16.2.5 Medtronic PLC
- 16.2.5.1. Overview
- 16.2.5.2. Products
- 16.2.5.3. SWOT Analysis
- 16.2.5.4. Recent Developments
- 16.2.5.5. Financials (Based on Availability)
- 16.2.6 Advanced Brain Monitoring Inc
- 16.2.6.1. Overview
- 16.2.6.2. Products
- 16.2.6.3. SWOT Analysis
- 16.2.6.4. Recent Developments
- 16.2.6.5. Financials (Based on Availability)
- 16.2.7 Cadwell Industries Inc
- 16.2.7.1. Overview
- 16.2.7.2. Products
- 16.2.7.3. SWOT Analysis
- 16.2.7.4. Recent Developments
- 16.2.7.5. Financials (Based on Availability)
- 16.2.8 Koninklijke Philips NV
- 16.2.8.1. Overview
- 16.2.8.2. Products
- 16.2.8.3. SWOT Analysis
- 16.2.8.4. Recent Developments
- 16.2.8.5. Financials (Based on Availability)
- 16.2.9 Integra Lifesciences Corporation
- 16.2.9.1. Overview
- 16.2.9.2. Products
- 16.2.9.3. SWOT Analysis
- 16.2.9.4. Recent Developments
- 16.2.9.5. Financials (Based on Availability)
- 16.2.10 Cerenion Oy
- 16.2.10.1. Overview
- 16.2.10.2. Products
- 16.2.10.3. SWOT Analysis
- 16.2.10.4. Recent Developments
- 16.2.10.5. Financials (Based on Availability)
- 16.2.11 Nihon Kohden Corporation
- 16.2.11.1. Overview
- 16.2.11.2. Products
- 16.2.11.3. SWOT Analysis
- 16.2.11.4. Recent Developments
- 16.2.11.5. Financials (Based on Availability)
- 16.2.12 General Electric Company
- 16.2.12.1. Overview
- 16.2.12.2. Products
- 16.2.12.3. SWOT Analysis
- 16.2.12.4. Recent Developments
- 16.2.12.5. Financials (Based on Availability)
- 16.2.1 Natus Medical Incorporated
List of Figures
- Figure 1: Global Brain Monitoring Industry Revenue Breakdown (Million, %) by Region 2024 & 2032
- Figure 2: Global Brain Monitoring Industry Volume Breakdown (K Unit, %) by Region 2024 & 2032
- Figure 3: North America Brain Monitoring Industry Revenue (Million), by Country 2024 & 2032
- Figure 4: North America Brain Monitoring Industry Volume (K Unit), by Country 2024 & 2032
- Figure 5: North America Brain Monitoring Industry Revenue Share (%), by Country 2024 & 2032
- Figure 6: North America Brain Monitoring Industry Volume Share (%), by Country 2024 & 2032
- Figure 7: Europe Brain Monitoring Industry Revenue (Million), by Country 2024 & 2032
- Figure 8: Europe Brain Monitoring Industry Volume (K Unit), by Country 2024 & 2032
- Figure 9: Europe Brain Monitoring Industry Revenue Share (%), by Country 2024 & 2032
- Figure 10: Europe Brain Monitoring Industry Volume Share (%), by Country 2024 & 2032
- Figure 11: Asia Pacific Brain Monitoring Industry Revenue (Million), by Country 2024 & 2032
- Figure 12: Asia Pacific Brain Monitoring Industry Volume (K Unit), by Country 2024 & 2032
- Figure 13: Asia Pacific Brain Monitoring Industry Revenue Share (%), by Country 2024 & 2032
- Figure 14: Asia Pacific Brain Monitoring Industry Volume Share (%), by Country 2024 & 2032
- Figure 15: Middle East and Africa Brain Monitoring Industry Revenue (Million), by Country 2024 & 2032
- Figure 16: Middle East and Africa Brain Monitoring Industry Volume (K Unit), by Country 2024 & 2032
- Figure 17: Middle East and Africa Brain Monitoring Industry Revenue Share (%), by Country 2024 & 2032
- Figure 18: Middle East and Africa Brain Monitoring Industry Volume Share (%), by Country 2024 & 2032
- Figure 19: South America Brain Monitoring Industry Revenue (Million), by Country 2024 & 2032
- Figure 20: South America Brain Monitoring Industry Volume (K Unit), by Country 2024 & 2032
- Figure 21: South America Brain Monitoring Industry Revenue Share (%), by Country 2024 & 2032
- Figure 22: South America Brain Monitoring Industry Volume Share (%), by Country 2024 & 2032
- Figure 23: North America Brain Monitoring Industry Revenue (Million), by Product Type 2024 & 2032
- Figure 24: North America Brain Monitoring Industry Volume (K Unit), by Product Type 2024 & 2032
- Figure 25: North America Brain Monitoring Industry Revenue Share (%), by Product Type 2024 & 2032
- Figure 26: North America Brain Monitoring Industry Volume Share (%), by Product Type 2024 & 2032
- Figure 27: North America Brain Monitoring Industry Revenue (Million), by Application 2024 & 2032
- Figure 28: North America Brain Monitoring Industry Volume (K Unit), by Application 2024 & 2032
- Figure 29: North America Brain Monitoring Industry Revenue Share (%), by Application 2024 & 2032
- Figure 30: North America Brain Monitoring Industry Volume Share (%), by Application 2024 & 2032
- Figure 31: North America Brain Monitoring Industry Revenue (Million), by End User 2024 & 2032
- Figure 32: North America Brain Monitoring Industry Volume (K Unit), by End User 2024 & 2032
- Figure 33: North America Brain Monitoring Industry Revenue Share (%), by End User 2024 & 2032
- Figure 34: North America Brain Monitoring Industry Volume Share (%), by End User 2024 & 2032
- Figure 35: North America Brain Monitoring Industry Revenue (Million), by Country 2024 & 2032
- Figure 36: North America Brain Monitoring Industry Volume (K Unit), by Country 2024 & 2032
- Figure 37: North America Brain Monitoring Industry Revenue Share (%), by Country 2024 & 2032
- Figure 38: North America Brain Monitoring Industry Volume Share (%), by Country 2024 & 2032
- Figure 39: Europe Brain Monitoring Industry Revenue (Million), by Product Type 2024 & 2032
- Figure 40: Europe Brain Monitoring Industry Volume (K Unit), by Product Type 2024 & 2032
- Figure 41: Europe Brain Monitoring Industry Revenue Share (%), by Product Type 2024 & 2032
- Figure 42: Europe Brain Monitoring Industry Volume Share (%), by Product Type 2024 & 2032
- Figure 43: Europe Brain Monitoring Industry Revenue (Million), by Application 2024 & 2032
- Figure 44: Europe Brain Monitoring Industry Volume (K Unit), by Application 2024 & 2032
- Figure 45: Europe Brain Monitoring Industry Revenue Share (%), by Application 2024 & 2032
- Figure 46: Europe Brain Monitoring Industry Volume Share (%), by Application 2024 & 2032
- Figure 47: Europe Brain Monitoring Industry Revenue (Million), by End User 2024 & 2032
- Figure 48: Europe Brain Monitoring Industry Volume (K Unit), by End User 2024 & 2032
- Figure 49: Europe Brain Monitoring Industry Revenue Share (%), by End User 2024 & 2032
- Figure 50: Europe Brain Monitoring Industry Volume Share (%), by End User 2024 & 2032
- Figure 51: Europe Brain Monitoring Industry Revenue (Million), by Country 2024 & 2032
- Figure 52: Europe Brain Monitoring Industry Volume (K Unit), by Country 2024 & 2032
- Figure 53: Europe Brain Monitoring Industry Revenue Share (%), by Country 2024 & 2032
- Figure 54: Europe Brain Monitoring Industry Volume Share (%), by Country 2024 & 2032
- Figure 55: Asia Pacific Brain Monitoring Industry Revenue (Million), by Product Type 2024 & 2032
- Figure 56: Asia Pacific Brain Monitoring Industry Volume (K Unit), by Product Type 2024 & 2032
- Figure 57: Asia Pacific Brain Monitoring Industry Revenue Share (%), by Product Type 2024 & 2032
- Figure 58: Asia Pacific Brain Monitoring Industry Volume Share (%), by Product Type 2024 & 2032
- Figure 59: Asia Pacific Brain Monitoring Industry Revenue (Million), by Application 2024 & 2032
- Figure 60: Asia Pacific Brain Monitoring Industry Volume (K Unit), by Application 2024 & 2032
- Figure 61: Asia Pacific Brain Monitoring Industry Revenue Share (%), by Application 2024 & 2032
- Figure 62: Asia Pacific Brain Monitoring Industry Volume Share (%), by Application 2024 & 2032
- Figure 63: Asia Pacific Brain Monitoring Industry Revenue (Million), by End User 2024 & 2032
- Figure 64: Asia Pacific Brain Monitoring Industry Volume (K Unit), by End User 2024 & 2032
- Figure 65: Asia Pacific Brain Monitoring Industry Revenue Share (%), by End User 2024 & 2032
- Figure 66: Asia Pacific Brain Monitoring Industry Volume Share (%), by End User 2024 & 2032
- Figure 67: Asia Pacific Brain Monitoring Industry Revenue (Million), by Country 2024 & 2032
- Figure 68: Asia Pacific Brain Monitoring Industry Volume (K Unit), by Country 2024 & 2032
- Figure 69: Asia Pacific Brain Monitoring Industry Revenue Share (%), by Country 2024 & 2032
- Figure 70: Asia Pacific Brain Monitoring Industry Volume Share (%), by Country 2024 & 2032
- Figure 71: Middle East and Africa Brain Monitoring Industry Revenue (Million), by Product Type 2024 & 2032
- Figure 72: Middle East and Africa Brain Monitoring Industry Volume (K Unit), by Product Type 2024 & 2032
- Figure 73: Middle East and Africa Brain Monitoring Industry Revenue Share (%), by Product Type 2024 & 2032
- Figure 74: Middle East and Africa Brain Monitoring Industry Volume Share (%), by Product Type 2024 & 2032
- Figure 75: Middle East and Africa Brain Monitoring Industry Revenue (Million), by Application 2024 & 2032
- Figure 76: Middle East and Africa Brain Monitoring Industry Volume (K Unit), by Application 2024 & 2032
- Figure 77: Middle East and Africa Brain Monitoring Industry Revenue Share (%), by Application 2024 & 2032
- Figure 78: Middle East and Africa Brain Monitoring Industry Volume Share (%), by Application 2024 & 2032
- Figure 79: Middle East and Africa Brain Monitoring Industry Revenue (Million), by End User 2024 & 2032
- Figure 80: Middle East and Africa Brain Monitoring Industry Volume (K Unit), by End User 2024 & 2032
- Figure 81: Middle East and Africa Brain Monitoring Industry Revenue Share (%), by End User 2024 & 2032
- Figure 82: Middle East and Africa Brain Monitoring Industry Volume Share (%), by End User 2024 & 2032
- Figure 83: Middle East and Africa Brain Monitoring Industry Revenue (Million), by Country 2024 & 2032
- Figure 84: Middle East and Africa Brain Monitoring Industry Volume (K Unit), by Country 2024 & 2032
- Figure 85: Middle East and Africa Brain Monitoring Industry Revenue Share (%), by Country 2024 & 2032
- Figure 86: Middle East and Africa Brain Monitoring Industry Volume Share (%), by Country 2024 & 2032
- Figure 87: South America Brain Monitoring Industry Revenue (Million), by Product Type 2024 & 2032
- Figure 88: South America Brain Monitoring Industry Volume (K Unit), by Product Type 2024 & 2032
- Figure 89: South America Brain Monitoring Industry Revenue Share (%), by Product Type 2024 & 2032
- Figure 90: South America Brain Monitoring Industry Volume Share (%), by Product Type 2024 & 2032
- Figure 91: South America Brain Monitoring Industry Revenue (Million), by Application 2024 & 2032
- Figure 92: South America Brain Monitoring Industry Volume (K Unit), by Application 2024 & 2032
- Figure 93: South America Brain Monitoring Industry Revenue Share (%), by Application 2024 & 2032
- Figure 94: South America Brain Monitoring Industry Volume Share (%), by Application 2024 & 2032
- Figure 95: South America Brain Monitoring Industry Revenue (Million), by End User 2024 & 2032
- Figure 96: South America Brain Monitoring Industry Volume (K Unit), by End User 2024 & 2032
- Figure 97: South America Brain Monitoring Industry Revenue Share (%), by End User 2024 & 2032
- Figure 98: South America Brain Monitoring Industry Volume Share (%), by End User 2024 & 2032
- Figure 99: South America Brain Monitoring Industry Revenue (Million), by Country 2024 & 2032
- Figure 100: South America Brain Monitoring Industry Volume (K Unit), by Country 2024 & 2032
- Figure 101: South America Brain Monitoring Industry Revenue Share (%), by Country 2024 & 2032
- Figure 102: South America Brain Monitoring Industry Volume Share (%), by Country 2024 & 2032
List of Tables
- Table 1: Global Brain Monitoring Industry Revenue Million Forecast, by Region 2019 & 2032
- Table 2: Global Brain Monitoring Industry Volume K Unit Forecast, by Region 2019 & 2032
- Table 3: Global Brain Monitoring Industry Revenue Million Forecast, by Product Type 2019 & 2032
- Table 4: Global Brain Monitoring Industry Volume K Unit Forecast, by Product Type 2019 & 2032
- Table 5: Global Brain Monitoring Industry Revenue Million Forecast, by Application 2019 & 2032
- Table 6: Global Brain Monitoring Industry Volume K Unit Forecast, by Application 2019 & 2032
- Table 7: Global Brain Monitoring Industry Revenue Million Forecast, by End User 2019 & 2032
- Table 8: Global Brain Monitoring Industry Volume K Unit Forecast, by End User 2019 & 2032
- Table 9: Global Brain Monitoring Industry Revenue Million Forecast, by Region 2019 & 2032
- Table 10: Global Brain Monitoring Industry Volume K Unit Forecast, by Region 2019 & 2032
- Table 11: Global Brain Monitoring Industry Revenue Million Forecast, by Country 2019 & 2032
- Table 12: Global Brain Monitoring Industry Volume K Unit Forecast, by Country 2019 & 2032
- Table 13: United States Brain Monitoring Industry Revenue (Million) Forecast, by Application 2019 & 2032
- Table 14: United States Brain Monitoring Industry Volume (K Unit) Forecast, by Application 2019 & 2032
- Table 15: Canada Brain Monitoring Industry Revenue (Million) Forecast, by Application 2019 & 2032
- Table 16: Canada Brain Monitoring Industry Volume (K Unit) Forecast, by Application 2019 & 2032
- Table 17: Mexico Brain Monitoring Industry Revenue (Million) Forecast, by Application 2019 & 2032
- Table 18: Mexico Brain Monitoring Industry Volume (K Unit) Forecast, by Application 2019 & 2032
- Table 19: Global Brain Monitoring Industry Revenue Million Forecast, by Country 2019 & 2032
- Table 20: Global Brain Monitoring Industry Volume K Unit Forecast, by Country 2019 & 2032
- Table 21: Germany Brain Monitoring Industry Revenue (Million) Forecast, by Application 2019 & 2032
- Table 22: Germany Brain Monitoring Industry Volume (K Unit) Forecast, by Application 2019 & 2032
- Table 23: United Kingdom Brain Monitoring Industry Revenue (Million) Forecast, by Application 2019 & 2032
- Table 24: United Kingdom Brain Monitoring Industry Volume (K Unit) Forecast, by Application 2019 & 2032
- Table 25: France Brain Monitoring Industry Revenue (Million) Forecast, by Application 2019 & 2032
- Table 26: France Brain Monitoring Industry Volume (K Unit) Forecast, by Application 2019 & 2032
- Table 27: Italy Brain Monitoring Industry Revenue (Million) Forecast, by Application 2019 & 2032
- Table 28: Italy Brain Monitoring Industry Volume (K Unit) Forecast, by Application 2019 & 2032
- Table 29: Spain Brain Monitoring Industry Revenue (Million) Forecast, by Application 2019 & 2032
- Table 30: Spain Brain Monitoring Industry Volume (K Unit) Forecast, by Application 2019 & 2032
- Table 31: Rest of Europe Brain Monitoring Industry Revenue (Million) Forecast, by Application 2019 & 2032
- Table 32: Rest of Europe Brain Monitoring Industry Volume (K Unit) Forecast, by Application 2019 & 2032
- Table 33: Global Brain Monitoring Industry Revenue Million Forecast, by Country 2019 & 2032
- Table 34: Global Brain Monitoring Industry Volume K Unit Forecast, by Country 2019 & 2032
- Table 35: China Brain Monitoring Industry Revenue (Million) Forecast, by Application 2019 & 2032
- Table 36: China Brain Monitoring Industry Volume (K Unit) Forecast, by Application 2019 & 2032
- Table 37: Japan Brain Monitoring Industry Revenue (Million) Forecast, by Application 2019 & 2032
- Table 38: Japan Brain Monitoring Industry Volume (K Unit) Forecast, by Application 2019 & 2032
- Table 39: India Brain Monitoring Industry Revenue (Million) Forecast, by Application 2019 & 2032
- Table 40: India Brain Monitoring Industry Volume (K Unit) Forecast, by Application 2019 & 2032
- Table 41: Australia Brain Monitoring Industry Revenue (Million) Forecast, by Application 2019 & 2032
- Table 42: Australia Brain Monitoring Industry Volume (K Unit) Forecast, by Application 2019 & 2032
- Table 43: South Korea Brain Monitoring Industry Revenue (Million) Forecast, by Application 2019 & 2032
- Table 44: South Korea Brain Monitoring Industry Volume (K Unit) Forecast, by Application 2019 & 2032
- Table 45: Rest of Asia Pacific Brain Monitoring Industry Revenue (Million) Forecast, by Application 2019 & 2032
- Table 46: Rest of Asia Pacific Brain Monitoring Industry Volume (K Unit) Forecast, by Application 2019 & 2032
- Table 47: Global Brain Monitoring Industry Revenue Million Forecast, by Country 2019 & 2032
- Table 48: Global Brain Monitoring Industry Volume K Unit Forecast, by Country 2019 & 2032
- Table 49: GCC Brain Monitoring Industry Revenue (Million) Forecast, by Application 2019 & 2032
- Table 50: GCC Brain Monitoring Industry Volume (K Unit) Forecast, by Application 2019 & 2032
- Table 51: South Africa Brain Monitoring Industry Revenue (Million) Forecast, by Application 2019 & 2032
- Table 52: South Africa Brain Monitoring Industry Volume (K Unit) Forecast, by Application 2019 & 2032
- Table 53: Rest of Middle East and Africa Brain Monitoring Industry Revenue (Million) Forecast, by Application 2019 & 2032
- Table 54: Rest of Middle East and Africa Brain Monitoring Industry Volume (K Unit) Forecast, by Application 2019 & 2032
- Table 55: Global Brain Monitoring Industry Revenue Million Forecast, by Country 2019 & 2032
- Table 56: Global Brain Monitoring Industry Volume K Unit Forecast, by Country 2019 & 2032
- Table 57: Brazil Brain Monitoring Industry Revenue (Million) Forecast, by Application 2019 & 2032
- Table 58: Brazil Brain Monitoring Industry Volume (K Unit) Forecast, by Application 2019 & 2032
- Table 59: Argentina Brain Monitoring Industry Revenue (Million) Forecast, by Application 2019 & 2032
- Table 60: Argentina Brain Monitoring Industry Volume (K Unit) Forecast, by Application 2019 & 2032
- Table 61: Rest of South America Brain Monitoring Industry Revenue (Million) Forecast, by Application 2019 & 2032
- Table 62: Rest of South America Brain Monitoring Industry Volume (K Unit) Forecast, by Application 2019 & 2032
- Table 63: Global Brain Monitoring Industry Revenue Million Forecast, by Product Type 2019 & 2032
- Table 64: Global Brain Monitoring Industry Volume K Unit Forecast, by Product Type 2019 & 2032
- Table 65: Global Brain Monitoring Industry Revenue Million Forecast, by Application 2019 & 2032
- Table 66: Global Brain Monitoring Industry Volume K Unit Forecast, by Application 2019 & 2032
- Table 67: Global Brain Monitoring Industry Revenue Million Forecast, by End User 2019 & 2032
- Table 68: Global Brain Monitoring Industry Volume K Unit Forecast, by End User 2019 & 2032
- Table 69: Global Brain Monitoring Industry Revenue Million Forecast, by Country 2019 & 2032
- Table 70: Global Brain Monitoring Industry Volume K Unit Forecast, by Country 2019 & 2032
- Table 71: United States Brain Monitoring Industry Revenue (Million) Forecast, by Application 2019 & 2032
- Table 72: United States Brain Monitoring Industry Volume (K Unit) Forecast, by Application 2019 & 2032
- Table 73: Canada Brain Monitoring Industry Revenue (Million) Forecast, by Application 2019 & 2032
- Table 74: Canada Brain Monitoring Industry Volume (K Unit) Forecast, by Application 2019 & 2032
- Table 75: Mexico Brain Monitoring Industry Revenue (Million) Forecast, by Application 2019 & 2032
- Table 76: Mexico Brain Monitoring Industry Volume (K Unit) Forecast, by Application 2019 & 2032
- Table 77: Global Brain Monitoring Industry Revenue Million Forecast, by Product Type 2019 & 2032
- Table 78: Global Brain Monitoring Industry Volume K Unit Forecast, by Product Type 2019 & 2032
- Table 79: Global Brain Monitoring Industry Revenue Million Forecast, by Application 2019 & 2032
- Table 80: Global Brain Monitoring Industry Volume K Unit Forecast, by Application 2019 & 2032
- Table 81: Global Brain Monitoring Industry Revenue Million Forecast, by End User 2019 & 2032
- Table 82: Global Brain Monitoring Industry Volume K Unit Forecast, by End User 2019 & 2032
- Table 83: Global Brain Monitoring Industry Revenue Million Forecast, by Country 2019 & 2032
- Table 84: Global Brain Monitoring Industry Volume K Unit Forecast, by Country 2019 & 2032
- Table 85: Germany Brain Monitoring Industry Revenue (Million) Forecast, by Application 2019 & 2032
- Table 86: Germany Brain Monitoring Industry Volume (K Unit) Forecast, by Application 2019 & 2032
- Table 87: United Kingdom Brain Monitoring Industry Revenue (Million) Forecast, by Application 2019 & 2032
- Table 88: United Kingdom Brain Monitoring Industry Volume (K Unit) Forecast, by Application 2019 & 2032
- Table 89: France Brain Monitoring Industry Revenue (Million) Forecast, by Application 2019 & 2032
- Table 90: France Brain Monitoring Industry Volume (K Unit) Forecast, by Application 2019 & 2032
- Table 91: Italy Brain Monitoring Industry Revenue (Million) Forecast, by Application 2019 & 2032
- Table 92: Italy Brain Monitoring Industry Volume (K Unit) Forecast, by Application 2019 & 2032
- Table 93: Spain Brain Monitoring Industry Revenue (Million) Forecast, by Application 2019 & 2032
- Table 94: Spain Brain Monitoring Industry Volume (K Unit) Forecast, by Application 2019 & 2032
- Table 95: Rest of Europe Brain Monitoring Industry Revenue (Million) Forecast, by Application 2019 & 2032
- Table 96: Rest of Europe Brain Monitoring Industry Volume (K Unit) Forecast, by Application 2019 & 2032
- Table 97: Global Brain Monitoring Industry Revenue Million Forecast, by Product Type 2019 & 2032
- Table 98: Global Brain Monitoring Industry Volume K Unit Forecast, by Product Type 2019 & 2032
- Table 99: Global Brain Monitoring Industry Revenue Million Forecast, by Application 2019 & 2032
- Table 100: Global Brain Monitoring Industry Volume K Unit Forecast, by Application 2019 & 2032
- Table 101: Global Brain Monitoring Industry Revenue Million Forecast, by End User 2019 & 2032
- Table 102: Global Brain Monitoring Industry Volume K Unit Forecast, by End User 2019 & 2032
- Table 103: Global Brain Monitoring Industry Revenue Million Forecast, by Country 2019 & 2032
- Table 104: Global Brain Monitoring Industry Volume K Unit Forecast, by Country 2019 & 2032
- Table 105: China Brain Monitoring Industry Revenue (Million) Forecast, by Application 2019 & 2032
- Table 106: China Brain Monitoring Industry Volume (K Unit) Forecast, by Application 2019 & 2032
- Table 107: Japan Brain Monitoring Industry Revenue (Million) Forecast, by Application 2019 & 2032
- Table 108: Japan Brain Monitoring Industry Volume (K Unit) Forecast, by Application 2019 & 2032
- Table 109: India Brain Monitoring Industry Revenue (Million) Forecast, by Application 2019 & 2032
- Table 110: India Brain Monitoring Industry Volume (K Unit) Forecast, by Application 2019 & 2032
- Table 111: Australia Brain Monitoring Industry Revenue (Million) Forecast, by Application 2019 & 2032
- Table 112: Australia Brain Monitoring Industry Volume (K Unit) Forecast, by Application 2019 & 2032
- Table 113: South Korea Brain Monitoring Industry Revenue (Million) Forecast, by Application 2019 & 2032
- Table 114: South Korea Brain Monitoring Industry Volume (K Unit) Forecast, by Application 2019 & 2032
- Table 115: Rest of Asia Pacific Brain Monitoring Industry Revenue (Million) Forecast, by Application 2019 & 2032
- Table 116: Rest of Asia Pacific Brain Monitoring Industry Volume (K Unit) Forecast, by Application 2019 & 2032
- Table 117: Global Brain Monitoring Industry Revenue Million Forecast, by Product Type 2019 & 2032
- Table 118: Global Brain Monitoring Industry Volume K Unit Forecast, by Product Type 2019 & 2032
- Table 119: Global Brain Monitoring Industry Revenue Million Forecast, by Application 2019 & 2032
- Table 120: Global Brain Monitoring Industry Volume K Unit Forecast, by Application 2019 & 2032
- Table 121: Global Brain Monitoring Industry Revenue Million Forecast, by End User 2019 & 2032
- Table 122: Global Brain Monitoring Industry Volume K Unit Forecast, by End User 2019 & 2032
- Table 123: Global Brain Monitoring Industry Revenue Million Forecast, by Country 2019 & 2032
- Table 124: Global Brain Monitoring Industry Volume K Unit Forecast, by Country 2019 & 2032
- Table 125: GCC Brain Monitoring Industry Revenue (Million) Forecast, by Application 2019 & 2032
- Table 126: GCC Brain Monitoring Industry Volume (K Unit) Forecast, by Application 2019 & 2032
- Table 127: South Africa Brain Monitoring Industry Revenue (Million) Forecast, by Application 2019 & 2032
- Table 128: South Africa Brain Monitoring Industry Volume (K Unit) Forecast, by Application 2019 & 2032
- Table 129: Rest of Middle East and Africa Brain Monitoring Industry Revenue (Million) Forecast, by Application 2019 & 2032
- Table 130: Rest of Middle East and Africa Brain Monitoring Industry Volume (K Unit) Forecast, by Application 2019 & 2032
- Table 131: Global Brain Monitoring Industry Revenue Million Forecast, by Product Type 2019 & 2032
- Table 132: Global Brain Monitoring Industry Volume K Unit Forecast, by Product Type 2019 & 2032
- Table 133: Global Brain Monitoring Industry Revenue Million Forecast, by Application 2019 & 2032
- Table 134: Global Brain Monitoring Industry Volume K Unit Forecast, by Application 2019 & 2032
- Table 135: Global Brain Monitoring Industry Revenue Million Forecast, by End User 2019 & 2032
- Table 136: Global Brain Monitoring Industry Volume K Unit Forecast, by End User 2019 & 2032
- Table 137: Global Brain Monitoring Industry Revenue Million Forecast, by Country 2019 & 2032
- Table 138: Global Brain Monitoring Industry Volume K Unit Forecast, by Country 2019 & 2032
- Table 139: Brazil Brain Monitoring Industry Revenue (Million) Forecast, by Application 2019 & 2032
- Table 140: Brazil Brain Monitoring Industry Volume (K Unit) Forecast, by Application 2019 & 2032
- Table 141: Argentina Brain Monitoring Industry Revenue (Million) Forecast, by Application 2019 & 2032
- Table 142: Argentina Brain Monitoring Industry Volume (K Unit) Forecast, by Application 2019 & 2032
- Table 143: Rest of South America Brain Monitoring Industry Revenue (Million) Forecast, by Application 2019 & 2032
- Table 144: Rest of South America Brain Monitoring Industry Volume (K Unit) Forecast, by Application 2019 & 2032
Frequently Asked Questions
1. What is the projected Compound Annual Growth Rate (CAGR) of the Brain Monitoring Industry?
The projected CAGR is approximately 6.35%.
2. Which companies are prominent players in the Brain Monitoring Industry?
Key companies in the market include Natus Medical Incorporated, Compumedics, Masimo Corporation, Nonin Medical Inc, Medtronic PLC, Advanced Brain Monitoring Inc, Cadwell Industries Inc, Koninklijke Philips NV, Integra Lifesciences Corporation, Cerenion Oy, Nihon Kohden Corporation, General Electric Company.
3. What are the main segments of the Brain Monitoring Industry?
The market segments include Product Type, Application, End User.
4. Can you provide details about the market size?
The market size is estimated to be USD 6.80 Million as of 2022.
5. What are some drivers contributing to market growth?
Growing Geriatric Population; Rise in Incidences of Brain Disorders; Technological Advancements in Brain Monitoring Devices.
6. What are the notable trends driving market growth?
Electroencephalograph is Expected Witness a Healthy Growth Over the Forecast Period.
7. Are there any restraints impacting market growth?
Stringent Regulations for the Device Approval; Lack of Skilled Personnel to Handle Devices.
8. Can you provide examples of recent developments in the market?
November 2022: Neurosteer Inc. received FDA clearance for its Neurosteer single-channel EEG brain monitoring platform. This clearance enables the use of Neurosteer's unobtrusive multi-purpose system in a broad range of clinical settings. The platform offers continuous brain monitoring in the ICU to support critical interventions, and aids in the early detection of pre-symptomatic cognitive decline, including Alzheimer's, Parkinson's, and dementia, in a doctor's office. It assists in the rapid and cost-effective massive screening of subjects who may be suffering from neurodegenerative disorders in pharma drug trials.
9. What pricing options are available for accessing the report?
Pricing options include single-user, multi-user, and enterprise licenses priced at USD 4750, USD 5250, and USD 8750 respectively.
10. Is the market size provided in terms of value or volume?
The market size is provided in terms of value, measured in Million and volume, measured in K Unit.
11. Are there any specific market keywords associated with the report?
Yes, the market keyword associated with the report is "Brain Monitoring Industry," which aids in identifying and referencing the specific market segment covered.
12. How do I determine which pricing option suits my needs best?
The pricing options vary based on user requirements and access needs. Individual users may opt for single-user licenses, while businesses requiring broader access may choose multi-user or enterprise licenses for cost-effective access to the report.
13. Are there any additional resources or data provided in the Brain Monitoring Industry report?
While the report offers comprehensive insights, it's advisable to review the specific contents or supplementary materials provided to ascertain if additional resources or data are available.
14. How can I stay updated on further developments or reports in the Brain Monitoring Industry?
To stay informed about further developments, trends, and reports in the Brain Monitoring Industry, consider subscribing to industry newsletters, following relevant companies and organizations, or regularly checking reputable industry news sources and publications.
Methodology
Step 1 - Identification of Relevant Samples Size from Population Database


Step 2 - Approaches for Defining Global Market Size (Value, Volume* & Price*)

Note*: In applicable scenarios
Step 3 - Data Sources
Primary Research
- Web Analytics
- Survey Reports
- Research Institute
- Latest Research Reports
- Opinion Leaders
Secondary Research
- Annual Reports
- White Paper
- Latest Press Release
- Industry Association
- Paid Database
- Investor Presentations

Step 4 - Data Triangulation
Involves using different sources of information in order to increase the validity of a study
These sources are likely to be stakeholders in a program - participants, other researchers, program staff, other community members, and so on.
Then we put all data in single framework & apply various statistical tools to find out the dynamic on the market.
During the analysis stage, feedback from the stakeholder groups would be compared to determine areas of agreement as well as areas of divergence
