

Key Insights
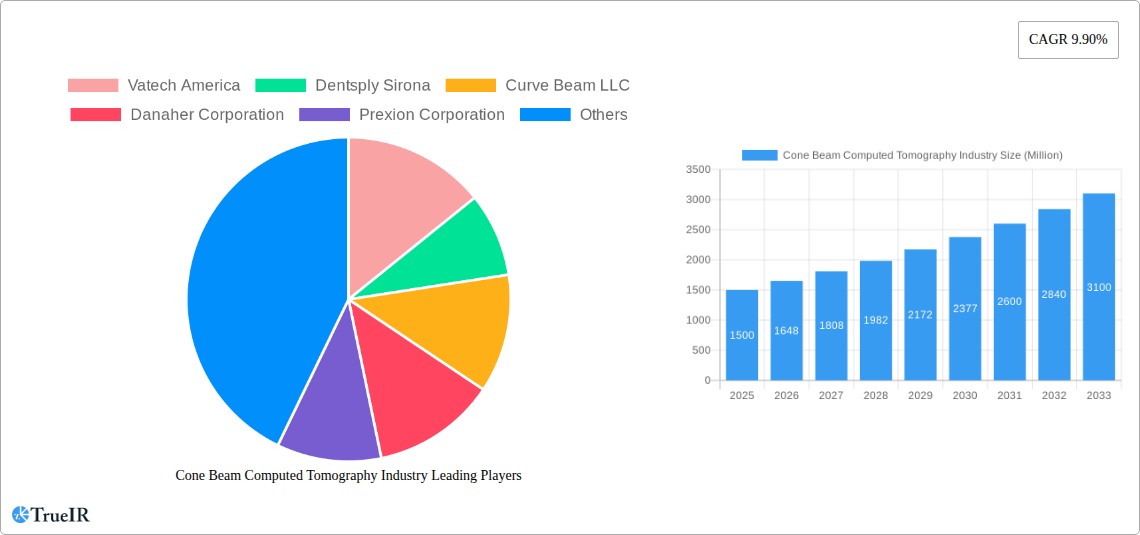
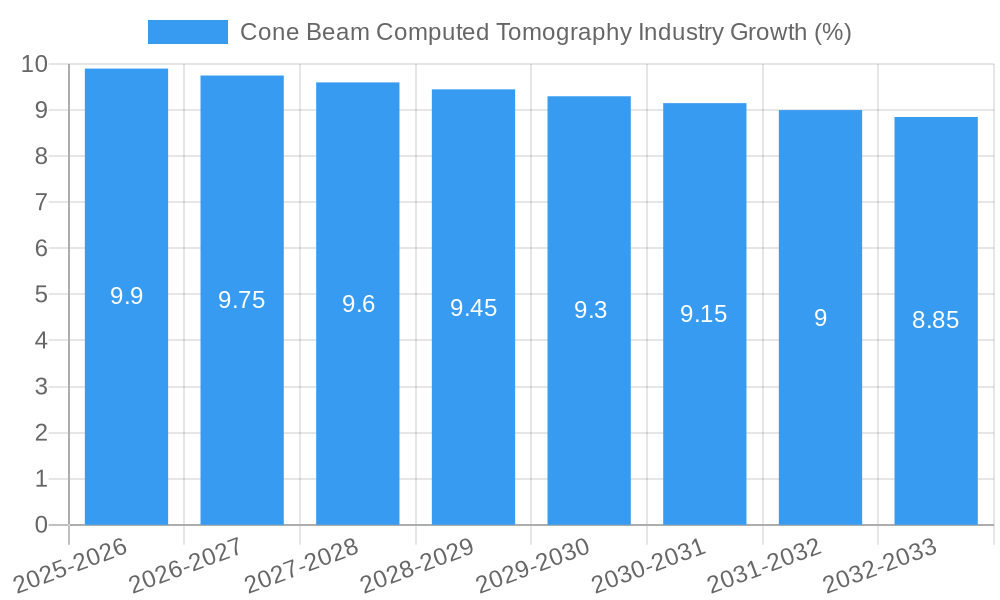
The global Cone Beam Computed Tomography (CBCT) market is poised for robust expansion, projected to reach a significant market size of approximately $1.5 billion by 2025, driven by a compound annual growth rate (CAGR) of 9.90%. This impressive growth trajectory is underpinned by the escalating adoption of advanced imaging technologies in dentistry, a critical application area. The increasing prevalence of dental malocclusions and the growing demand for sophisticated orthodontic treatments are major catalysts. Furthermore, the expanding scope of endodontics, periodontics, and general dentistry, all of which benefit immensely from the detailed 3D imaging capabilities of CBCT, will continue to fuel market expansion. Innovations in scanner technology, leading to higher resolution, reduced radiation exposure, and more compact designs, are also contributing to wider accessibility and adoption across various dental practices.
Beyond dentistry, the market is witnessing a broadening application base, presenting further growth opportunities. The ability of CBCT to provide precise anatomical data is finding utility in other specialized medical fields, indicating a diversification of its revenue streams. Key market drivers include the rising awareness among healthcare professionals and patients regarding the diagnostic advantages of CBCT over traditional 2D radiography, such as improved treatment planning and reduced diagnostic errors. The shift towards minimally invasive procedures across healthcare, where precise imaging is paramount, also favors CBCT adoption. However, the market faces certain restraints, including the initial high cost of acquisition and the need for specialized training for operators. Despite these challenges, the overwhelming clinical benefits and ongoing technological advancements are expected to propel the Cone Beam Computed Tomography market to new heights in the coming years, with significant contributions from regions like North America and Europe, followed by rapid growth in the Asia Pacific.
This comprehensive report delivers an in-depth analysis of the global Cone Beam Computed Tomography (CBCT) industry, covering the historical period from 2019 to 2024 and projecting growth through 2033. With a base year of 2025, the report leverages advanced analytical models to provide actionable insights into market dynamics, competitive landscapes, technological advancements, and emerging opportunities. The study meticulously examines key segments, including dental applications (orthodontics, endodontics, periodontics, general dentistry, and others), other applications, patient positions (standing/seated, supine), and end-users (hospitals, imaging centers, and others). Leveraging high-volume keywords such as "CBCT market," "dental imaging," "3D dental scans," and "radiology equipment," this report is optimized for search engines to reach a broad industry audience seeking critical market intelligence.
Cone Beam Computed Tomography Industry Market Structure & Competitive Landscape
The Cone Beam Computed Tomography (CBCT) market exhibits a moderately concentrated structure, characterized by a blend of large multinational corporations and specialized regional players. Innovation is a significant driver, fueled by ongoing research and development in areas like radiation dose reduction, image resolution enhancement, and AI-powered image analysis software. Regulatory frameworks, particularly those related to medical device approvals and radiation safety, exert considerable influence on market entry and product development. The availability of product substitutes, such as conventional multi-detector CT (MDCT) for some applications and intraoral scanners for specific dental diagnostics, shapes competitive dynamics. End-user segmentation reveals a strong reliance on dental practices for the majority of CBCT unit placements, although hospitals and independent imaging centers are increasingly adopting the technology for a wider range of applications. Merger and acquisition (M&A) activity, while not as intense as in some other healthcare technology sectors, has seen strategic consolidations aimed at expanding product portfolios and market reach. For instance, the acquisition of smaller technology firms by established players often aims to integrate novel software solutions or specialized hardware components. The market concentration ratio is estimated to be in the range of 60-70% for the top five companies. M&A volumes have averaged around 2-3 significant transactions annually over the historical period.
Cone Beam Computed Tomography Industry Market Trends & Opportunities
The global Cone Beam Computed Tomography (CBCT) market is poised for substantial growth, projected to expand from approximately $1,200 Million in 2025 to over $2,500 Million by 2033, exhibiting a Compound Annual Growth Rate (CAGR) of approximately 9.5%. This robust expansion is underpinned by a confluence of technological advancements, shifting consumer preferences, and evolving clinical practices. Technological innovation remains a primary catalyst, with continuous improvements in image quality, reduced radiation exposure, and the integration of artificial intelligence (AI) for enhanced diagnostic capabilities. AI algorithms are increasingly being developed to automate tasks such as anomaly detection, segmentation, and quantitative analysis, thereby improving diagnostic accuracy and efficiency. The market is also witnessing a trend towards more compact, portable, and cost-effective CBCT systems, making them more accessible to a wider range of dental professionals and smaller imaging facilities.
Consumer preferences are increasingly gravitating towards less invasive and more precise diagnostic tools, a trend that CBCT technology directly addresses, particularly in dentistry. Patients are becoming more informed about their treatment options and are seeking advanced imaging modalities that offer a comprehensive view of their anatomy. This growing patient demand, coupled with the increasing awareness among healthcare professionals about the benefits of CBCT, is a significant market driver.
The competitive landscape is characterized by intense innovation and strategic partnerships. Companies are investing heavily in research and development to differentiate their offerings through unique features, superior image processing, and integrated workflow solutions. The introduction of specialized CBCT units tailored for specific applications, such as orthodontics or implantology, is also a notable trend. Furthermore, the integration of CBCT data with other digital dentistry technologies, like CAD/CAM systems and intraoral scanners, is creating more streamlined and efficient patient treatment pathways. The market penetration rate for CBCT in advanced dental practices is estimated to be around 65%, with significant room for growth in general dentistry and emerging markets. The average selling price (ASP) of a mid-range CBCT unit is approximately $45,000, with premium systems reaching upwards of $80,000.
Dominant Markets & Segments in Cone Beam Computed Tomography Industry
The Cone Beam Computed Tomography (CBCT) market is heavily dominated by Dental Applications, which constitute the largest segment, accounting for an estimated 85% of the total market revenue. Within dental applications, General Dentistry represents the most significant sub-segment, driven by the widespread need for diagnostic imaging in routine procedures such as cavity detection, root canal assessments, and pre-surgical planning for dental implants.
Key Growth Drivers in Dominant Segments:
- Infrastructure Development: The increasing adoption of digital dentistry workflows, including intraoral scanners and CAD/CAM systems, necessitates advanced imaging solutions like CBCT to complement these technologies.
- Policy and Reimbursement: Favorable reimbursement policies for advanced dental imaging procedures in developed nations encourage dentists to invest in CBCT technology. Government initiatives promoting oral health awareness also indirectly boost demand.
- Technological Advancements: Continuous improvements in CBCT technology, leading to enhanced image resolution, reduced radiation doses, and user-friendly software, make them more attractive to dental practitioners.
Market Dominance Analysis:
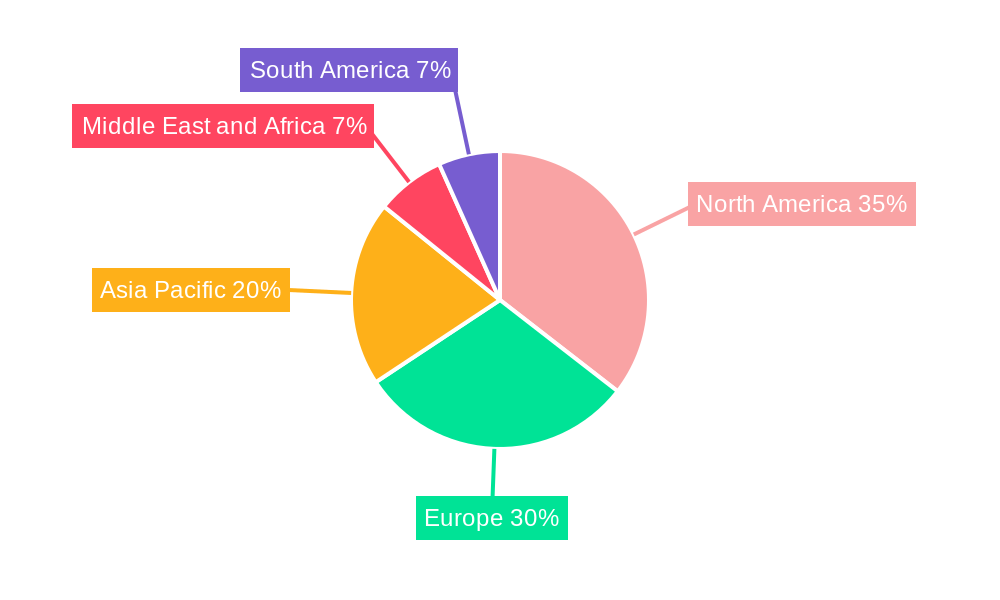
- Region: North America and Europe currently lead the global CBCT market, owing to the high adoption rate of advanced dental technologies, well-established healthcare infrastructure, and a higher disposable income among the population. However, the Asia-Pacific region is emerging as a high-growth market due to increasing healthcare expenditure, a growing dental tourism industry, and a rising awareness about advanced dental care.
- Application:
- Orthodontics: CBCT plays a crucial role in diagnosing complex orthodontic issues, treatment planning for clear aligners, and evaluating the efficacy of orthodontic interventions. The precise 3D visualization of teeth, roots, and jaw structures is invaluable for accurate treatment design.
- Endodontics: CBCT enables detailed analysis of root canal morphology, detection of missed canals, identification of internal root resorption, and assessment of treatment outcomes. This precision is vital for successful endodontic therapy, with studies like the one published in April 2022 highlighting its accuracy in canal length estimation.
- Periodontics: CBCT aids in assessing bone loss, identifying infrabony defects, evaluating the extent of periodontal disease, and planning regenerative procedures. Its ability to visualize bone architecture in three dimensions provides a significant advantage over 2D radiography.
- General Dentistry: This segment benefits from CBCT for a broad spectrum of diagnostic needs, including implant placement planning, wisdom tooth extraction assessment, temporomandibular joint (TMJ) disorder evaluation, and detection of subtle pathologies.
- Patient Position: The Standing/Seated Position dominates the market, as most CBCT units are designed for outpatient dental clinics and imaging centers where patients are typically in an upright position. Supine position units are more prevalent in hospital settings for specialized neurological or ENT applications.
- End User: Imaging Centers and Dental Clinics are the primary end-users, constituting over 70% of the market share. These facilities leverage CBCT for specialized diagnostic services and routine dental imaging, respectively. Hospitals are increasingly adopting CBCT for a broader range of clinical applications beyond dentistry, contributing to a growing, albeit smaller, segment.
Cone Beam Computed Tomography Industry Product Analysis
The Cone Beam Computed Tomography (CBCT) industry is characterized by a constant stream of product innovations aimed at enhancing diagnostic accuracy, patient comfort, and workflow efficiency. Key advancements include the development of ultra-low-dose radiation systems, offering significant reductions in patient exposure without compromising image quality. High-resolution imaging capabilities, often reaching sub-millimeter voxel sizes, allow for the visualization of intricate anatomical details crucial for precise diagnosis and treatment planning. Furthermore, the integration of AI-powered software solutions is revolutionizing CBCT analysis, enabling automated segmentation, anomaly detection, and quantitative measurements. These innovations provide competitive advantages by offering superior diagnostic information, improving patient outcomes, and streamlining clinical workflows for dentists, radiologists, and other medical professionals.
Key Drivers, Barriers & Challenges in Cone Beam Computed Tomography Industry
Key Drivers: The Cone Beam Computed Tomography (CBCT) industry is propelled by several key drivers. Technologically, the relentless pursuit of higher resolution imaging, reduced radiation doses, and AI integration for advanced diagnostics is a primary growth engine. Economically, increasing disposable incomes, rising healthcare expenditure globally, and favorable reimbursement for advanced imaging are crucial. Policy-driven factors, such as government initiatives promoting preventive healthcare and the increasing acceptance of digital dentistry, also play a significant role. For example, the growing prevalence of dental tourism in certain regions is a direct driver for advanced diagnostic equipment.
Barriers & Challenges: Conversely, the market faces significant barriers. Regulatory hurdles, including stringent approval processes for medical devices and variations in radiation safety standards across different regions, can slow down market penetration. Supply chain issues, particularly in sourcing specialized components and managing global distribution, can impact availability and costs. Competitive pressures from established players and emerging technologies, as well as the high initial investment cost of CBCT systems, can be a deterrent for smaller practices. The need for specialized training for operators and radiologists also presents a continuous challenge. The estimated impact of these challenges on market growth is approximately 1-2% annually.
Growth Drivers in the Cone Beam Computed Tomography Industry Market
Several pivotal factors are fueling the growth of the Cone Beam Computed Tomography (CBCT) industry. Technological advancements are paramount, with innovations focusing on improving image clarity, reducing patient radiation exposure, and integrating artificial intelligence for enhanced diagnostic capabilities. The increasing demand for minimally invasive procedures and precise treatment planning across various medical specialties, especially in dentistry, is a significant economic driver. Furthermore, favorable government policies supporting healthcare infrastructure development and the increasing adoption of digital health solutions are creating a conducive market environment. The growing awareness among patients about the benefits of advanced imaging techniques is also indirectly stimulating demand.
Challenges Impacting Cone Beam Computed Tomography Industry Growth
Despite the robust growth trajectory, the Cone Beam Computed Tomography (CBCT) industry encounters several challenges. Regulatory complexities and the varying approval processes across different international markets can impede rapid market expansion. Supply chain disruptions, particularly for specialized components and global logistics, can lead to increased costs and delivery delays. Intense competitive pressures among established manufacturers and emerging players necessitate continuous innovation and competitive pricing strategies. The significant capital investment required for acquiring CBCT systems can also be a barrier for smaller healthcare providers, limiting market penetration in certain segments.
Key Players Shaping the Cone Beam Computed Tomography Industry Market
- Vatech America
- Dentsply Sirona
- Curve Beam LLC
- Danaher Corporation
- Prexion Corporation
- Carestream Health Inc
- Planmeca Group
- Asahi RoEntgen Ind Co Ltd
- J Morita Mfg Corp
- Cefla S C
Significant Cone Beam Computed Tomography Industry Industry Milestones
- June 2022: Xoran Technologies received a patent for a modular cone beam computed tomography (CT) system assembly, signifying innovation in system design for enhanced flexibility and expandability.
- April 2022: A research study published titled "Root canal length estimated by cone-beam computed tomography at different slice thicknesses, dedicated endodontic software, or measured by an electronic apex locator" stated that cone-beam computed tomography can be used to analyse the thickness of the root canal, underscoring its diagnostic accuracy and application in endodontics.
Future Outlook for Cone Beam Computed Tomography Industry Market
The future outlook for the Cone Beam Computed Tomography (CBCT) market is exceptionally bright, driven by sustained technological innovation, a growing global demand for advanced diagnostics, and expanding applications beyond dentistry. Strategic opportunities lie in the development of AI-driven diagnostic tools, further miniaturization of systems for greater portability, and increased adoption in emerging markets. The integration of CBCT data with other medical imaging modalities and electronic health records will also create seamless diagnostic workflows. The market is poised for continued expansion as healthcare providers increasingly recognize the value of precise, volumetric imaging for improved patient care and treatment outcomes, reaching an estimated market size of $2,500 Million by 2033.
Cone Beam Computed Tomography Industry Segmentation
-
1. Application
-
1.1. Dental Applications
- 1.1.1. Orthodontics
- 1.1.2. Endodontics
- 1.1.3. Periodontics
- 1.1.4. General Dentistry
- 1.1.5. Others
- 1.2. Other Applications
-
1.1. Dental Applications
-
2. Patient Position
- 2.1. Standing/Seated Position
- 2.2. Supine Position
-
3. End User
- 3.1. Hospitals
- 3.2. Imaging Centers
- 3.3. Others
Cone Beam Computed Tomography Industry Segmentation By Geography
-
1. North America
- 1.1. United States
- 1.2. Canada
- 1.3. Mexico
-
2. Europe
- 2.1. Germany
- 2.2. United Kingdom
- 2.3. France
- 2.4. Italy
- 2.5. Spain
- 2.6. Rest of Europe
-
3. Asia Pacific
- 3.1. China
- 3.2. Japan
- 3.3. India
- 3.4. Australia
- 3.5. South Korea
- 3.6. Rest of Asia Pacific
-
4. Middle East and Africa
- 4.1. GCC
- 4.2. South Africa
- 4.3. Rest of Middle East and Africa
-
5. South America
- 5.1. Brazil
- 5.2. Argentina
- 5.3. Rest of South America
Cone Beam Computed Tomography Industry REPORT HIGHLIGHTS
| Aspects | Details |
|---|---|
| Study Period | 2019-2033 |
| Base Year | 2024 |
| Estimated Year | 2025 |
| Forecast Period | 2025-2033 |
| Historical Period | 2019-2024 |
| Growth Rate | CAGR of 9.90% from 2019-2033 |
| Segmentation |
|
Table of Contents
- 1. Introduction
- 1.1. Research Scope
- 1.2. Market Segmentation
- 1.3. Research Methodology
- 1.4. Definitions and Assumptions
- 2. Executive Summary
- 2.1. Introduction
- 3. Market Dynamics
- 3.1. Introduction
- 3.2. Market Drivers
- 3.2.1. Increasing Cases of Dental Disorders; Advancements in Technology; Expanding Application Areas of CBCT Systems
- 3.3. Market Restrains
- 3.3.1. High Cost of CBCT Systems; Imaging Issues
- 3.4. Market Trends
- 3.4.1. Periodontal Applications is Expected to Dominate the Cone Beam Computed Tomography (CBCT) Market During the Forecast Period
- 4. Market Factor Analysis
- 4.1. Porters Five Forces
- 4.2. Supply/Value Chain
- 4.3. PESTEL analysis
- 4.4. Market Entropy
- 4.5. Patent/Trademark Analysis
- 5. Global Cone Beam Computed Tomography Industry Analysis, Insights and Forecast, 2019-2031
- 5.1. Market Analysis, Insights and Forecast - by Application
- 5.1.1. Dental Applications
- 5.1.1.1. Orthodontics
- 5.1.1.2. Endodontics
- 5.1.1.3. Periodontics
- 5.1.1.4. General Dentistry
- 5.1.1.5. Others
- 5.1.2. Other Applications
- 5.1.1. Dental Applications
- 5.2. Market Analysis, Insights and Forecast - by Patient Position
- 5.2.1. Standing/Seated Position
- 5.2.2. Supine Position
- 5.3. Market Analysis, Insights and Forecast - by End User
- 5.3.1. Hospitals
- 5.3.2. Imaging Centers
- 5.3.3. Others
- 5.4. Market Analysis, Insights and Forecast - by Region
- 5.4.1. North America
- 5.4.2. Europe
- 5.4.3. Asia Pacific
- 5.4.4. Middle East and Africa
- 5.4.5. South America
- 5.1. Market Analysis, Insights and Forecast - by Application
- 6. North America Cone Beam Computed Tomography Industry Analysis, Insights and Forecast, 2019-2031
- 6.1. Market Analysis, Insights and Forecast - by Application
- 6.1.1. Dental Applications
- 6.1.1.1. Orthodontics
- 6.1.1.2. Endodontics
- 6.1.1.3. Periodontics
- 6.1.1.4. General Dentistry
- 6.1.1.5. Others
- 6.1.2. Other Applications
- 6.1.1. Dental Applications
- 6.2. Market Analysis, Insights and Forecast - by Patient Position
- 6.2.1. Standing/Seated Position
- 6.2.2. Supine Position
- 6.3. Market Analysis, Insights and Forecast - by End User
- 6.3.1. Hospitals
- 6.3.2. Imaging Centers
- 6.3.3. Others
- 6.1. Market Analysis, Insights and Forecast - by Application
- 7. Europe Cone Beam Computed Tomography Industry Analysis, Insights and Forecast, 2019-2031
- 7.1. Market Analysis, Insights and Forecast - by Application
- 7.1.1. Dental Applications
- 7.1.1.1. Orthodontics
- 7.1.1.2. Endodontics
- 7.1.1.3. Periodontics
- 7.1.1.4. General Dentistry
- 7.1.1.5. Others
- 7.1.2. Other Applications
- 7.1.1. Dental Applications
- 7.2. Market Analysis, Insights and Forecast - by Patient Position
- 7.2.1. Standing/Seated Position
- 7.2.2. Supine Position
- 7.3. Market Analysis, Insights and Forecast - by End User
- 7.3.1. Hospitals
- 7.3.2. Imaging Centers
- 7.3.3. Others
- 7.1. Market Analysis, Insights and Forecast - by Application
- 8. Asia Pacific Cone Beam Computed Tomography Industry Analysis, Insights and Forecast, 2019-2031
- 8.1. Market Analysis, Insights and Forecast - by Application
- 8.1.1. Dental Applications
- 8.1.1.1. Orthodontics
- 8.1.1.2. Endodontics
- 8.1.1.3. Periodontics
- 8.1.1.4. General Dentistry
- 8.1.1.5. Others
- 8.1.2. Other Applications
- 8.1.1. Dental Applications
- 8.2. Market Analysis, Insights and Forecast - by Patient Position
- 8.2.1. Standing/Seated Position
- 8.2.2. Supine Position
- 8.3. Market Analysis, Insights and Forecast - by End User
- 8.3.1. Hospitals
- 8.3.2. Imaging Centers
- 8.3.3. Others
- 8.1. Market Analysis, Insights and Forecast - by Application
- 9. Middle East and Africa Cone Beam Computed Tomography Industry Analysis, Insights and Forecast, 2019-2031
- 9.1. Market Analysis, Insights and Forecast - by Application
- 9.1.1. Dental Applications
- 9.1.1.1. Orthodontics
- 9.1.1.2. Endodontics
- 9.1.1.3. Periodontics
- 9.1.1.4. General Dentistry
- 9.1.1.5. Others
- 9.1.2. Other Applications
- 9.1.1. Dental Applications
- 9.2. Market Analysis, Insights and Forecast - by Patient Position
- 9.2.1. Standing/Seated Position
- 9.2.2. Supine Position
- 9.3. Market Analysis, Insights and Forecast - by End User
- 9.3.1. Hospitals
- 9.3.2. Imaging Centers
- 9.3.3. Others
- 9.1. Market Analysis, Insights and Forecast - by Application
- 10. South America Cone Beam Computed Tomography Industry Analysis, Insights and Forecast, 2019-2031
- 10.1. Market Analysis, Insights and Forecast - by Application
- 10.1.1. Dental Applications
- 10.1.1.1. Orthodontics
- 10.1.1.2. Endodontics
- 10.1.1.3. Periodontics
- 10.1.1.4. General Dentistry
- 10.1.1.5. Others
- 10.1.2. Other Applications
- 10.1.1. Dental Applications
- 10.2. Market Analysis, Insights and Forecast - by Patient Position
- 10.2.1. Standing/Seated Position
- 10.2.2. Supine Position
- 10.3. Market Analysis, Insights and Forecast - by End User
- 10.3.1. Hospitals
- 10.3.2. Imaging Centers
- 10.3.3. Others
- 10.1. Market Analysis, Insights and Forecast - by Application
- 11. North America Cone Beam Computed Tomography Industry Analysis, Insights and Forecast, 2019-2031
- 11.1. Market Analysis, Insights and Forecast - By Country/Sub-region
- 11.1.1 United States
- 11.1.2 Canada
- 11.1.3 Mexico
- 12. Europe Cone Beam Computed Tomography Industry Analysis, Insights and Forecast, 2019-2031
- 12.1. Market Analysis, Insights and Forecast - By Country/Sub-region
- 12.1.1 Germany
- 12.1.2 United Kingdom
- 12.1.3 France
- 12.1.4 Italy
- 12.1.5 Spain
- 12.1.6 Rest of Europe
- 13. Asia Pacific Cone Beam Computed Tomography Industry Analysis, Insights and Forecast, 2019-2031
- 13.1. Market Analysis, Insights and Forecast - By Country/Sub-region
- 13.1.1 China
- 13.1.2 Japan
- 13.1.3 India
- 13.1.4 Australia
- 13.1.5 South Korea
- 13.1.6 Rest of Asia Pacific
- 14. South America Cone Beam Computed Tomography Industry Analysis, Insights and Forecast, 2019-2031
- 14.1. Market Analysis, Insights and Forecast - By Country/Sub-region
- 14.1.1 Brazil
- 14.1.2 Argentina
- 14.1.3 Rest of South America
- 15. Middle East and Africa Cone Beam Computed Tomography Industry Analysis, Insights and Forecast, 2019-2031
- 15.1. Market Analysis, Insights and Forecast - By Country/Sub-region
- 15.1.1 GCC
- 15.1.2 South Africa
- 15.1.3 Rest of Middle East and Africa
- 16. Competitive Analysis
- 16.1. Global Market Share Analysis 2024
- 16.2. Company Profiles
- 16.2.1 Vatech America
- 16.2.1.1. Overview
- 16.2.1.2. Products
- 16.2.1.3. SWOT Analysis
- 16.2.1.4. Recent Developments
- 16.2.1.5. Financials (Based on Availability)
- 16.2.2 Dentsply Sirona
- 16.2.2.1. Overview
- 16.2.2.2. Products
- 16.2.2.3. SWOT Analysis
- 16.2.2.4. Recent Developments
- 16.2.2.5. Financials (Based on Availability)
- 16.2.3 Curve Beam LLC
- 16.2.3.1. Overview
- 16.2.3.2. Products
- 16.2.3.3. SWOT Analysis
- 16.2.3.4. Recent Developments
- 16.2.3.5. Financials (Based on Availability)
- 16.2.4 Danaher Corporation
- 16.2.4.1. Overview
- 16.2.4.2. Products
- 16.2.4.3. SWOT Analysis
- 16.2.4.4. Recent Developments
- 16.2.4.5. Financials (Based on Availability)
- 16.2.5 Prexion Corporation
- 16.2.5.1. Overview
- 16.2.5.2. Products
- 16.2.5.3. SWOT Analysis
- 16.2.5.4. Recent Developments
- 16.2.5.5. Financials (Based on Availability)
- 16.2.6 Carestream Health Inc
- 16.2.6.1. Overview
- 16.2.6.2. Products
- 16.2.6.3. SWOT Analysis
- 16.2.6.4. Recent Developments
- 16.2.6.5. Financials (Based on Availability)
- 16.2.7 Planmeca Group
- 16.2.7.1. Overview
- 16.2.7.2. Products
- 16.2.7.3. SWOT Analysis
- 16.2.7.4. Recent Developments
- 16.2.7.5. Financials (Based on Availability)
- 16.2.8 Asahi RoEntgen Ind Co Ltd
- 16.2.8.1. Overview
- 16.2.8.2. Products
- 16.2.8.3. SWOT Analysis
- 16.2.8.4. Recent Developments
- 16.2.8.5. Financials (Based on Availability)
- 16.2.9 J Morita Mfg Corp
- 16.2.9.1. Overview
- 16.2.9.2. Products
- 16.2.9.3. SWOT Analysis
- 16.2.9.4. Recent Developments
- 16.2.9.5. Financials (Based on Availability)
- 16.2.10 Cefla S C
- 16.2.10.1. Overview
- 16.2.10.2. Products
- 16.2.10.3. SWOT Analysis
- 16.2.10.4. Recent Developments
- 16.2.10.5. Financials (Based on Availability)
- 16.2.1 Vatech America
List of Figures
- Figure 1: Global Cone Beam Computed Tomography Industry Revenue Breakdown (Million, %) by Region 2024 & 2032
- Figure 2: North America Cone Beam Computed Tomography Industry Revenue (Million), by Country 2024 & 2032
- Figure 3: North America Cone Beam Computed Tomography Industry Revenue Share (%), by Country 2024 & 2032
- Figure 4: Europe Cone Beam Computed Tomography Industry Revenue (Million), by Country 2024 & 2032
- Figure 5: Europe Cone Beam Computed Tomography Industry Revenue Share (%), by Country 2024 & 2032
- Figure 6: Asia Pacific Cone Beam Computed Tomography Industry Revenue (Million), by Country 2024 & 2032
- Figure 7: Asia Pacific Cone Beam Computed Tomography Industry Revenue Share (%), by Country 2024 & 2032
- Figure 8: South America Cone Beam Computed Tomography Industry Revenue (Million), by Country 2024 & 2032
- Figure 9: South America Cone Beam Computed Tomography Industry Revenue Share (%), by Country 2024 & 2032
- Figure 10: Middle East and Africa Cone Beam Computed Tomography Industry Revenue (Million), by Country 2024 & 2032
- Figure 11: Middle East and Africa Cone Beam Computed Tomography Industry Revenue Share (%), by Country 2024 & 2032
- Figure 12: North America Cone Beam Computed Tomography Industry Revenue (Million), by Application 2024 & 2032
- Figure 13: North America Cone Beam Computed Tomography Industry Revenue Share (%), by Application 2024 & 2032
- Figure 14: North America Cone Beam Computed Tomography Industry Revenue (Million), by Patient Position 2024 & 2032
- Figure 15: North America Cone Beam Computed Tomography Industry Revenue Share (%), by Patient Position 2024 & 2032
- Figure 16: North America Cone Beam Computed Tomography Industry Revenue (Million), by End User 2024 & 2032
- Figure 17: North America Cone Beam Computed Tomography Industry Revenue Share (%), by End User 2024 & 2032
- Figure 18: North America Cone Beam Computed Tomography Industry Revenue (Million), by Country 2024 & 2032
- Figure 19: North America Cone Beam Computed Tomography Industry Revenue Share (%), by Country 2024 & 2032
- Figure 20: Europe Cone Beam Computed Tomography Industry Revenue (Million), by Application 2024 & 2032
- Figure 21: Europe Cone Beam Computed Tomography Industry Revenue Share (%), by Application 2024 & 2032
- Figure 22: Europe Cone Beam Computed Tomography Industry Revenue (Million), by Patient Position 2024 & 2032
- Figure 23: Europe Cone Beam Computed Tomography Industry Revenue Share (%), by Patient Position 2024 & 2032
- Figure 24: Europe Cone Beam Computed Tomography Industry Revenue (Million), by End User 2024 & 2032
- Figure 25: Europe Cone Beam Computed Tomography Industry Revenue Share (%), by End User 2024 & 2032
- Figure 26: Europe Cone Beam Computed Tomography Industry Revenue (Million), by Country 2024 & 2032
- Figure 27: Europe Cone Beam Computed Tomography Industry Revenue Share (%), by Country 2024 & 2032
- Figure 28: Asia Pacific Cone Beam Computed Tomography Industry Revenue (Million), by Application 2024 & 2032
- Figure 29: Asia Pacific Cone Beam Computed Tomography Industry Revenue Share (%), by Application 2024 & 2032
- Figure 30: Asia Pacific Cone Beam Computed Tomography Industry Revenue (Million), by Patient Position 2024 & 2032
- Figure 31: Asia Pacific Cone Beam Computed Tomography Industry Revenue Share (%), by Patient Position 2024 & 2032
- Figure 32: Asia Pacific Cone Beam Computed Tomography Industry Revenue (Million), by End User 2024 & 2032
- Figure 33: Asia Pacific Cone Beam Computed Tomography Industry Revenue Share (%), by End User 2024 & 2032
- Figure 34: Asia Pacific Cone Beam Computed Tomography Industry Revenue (Million), by Country 2024 & 2032
- Figure 35: Asia Pacific Cone Beam Computed Tomography Industry Revenue Share (%), by Country 2024 & 2032
- Figure 36: Middle East and Africa Cone Beam Computed Tomography Industry Revenue (Million), by Application 2024 & 2032
- Figure 37: Middle East and Africa Cone Beam Computed Tomography Industry Revenue Share (%), by Application 2024 & 2032
- Figure 38: Middle East and Africa Cone Beam Computed Tomography Industry Revenue (Million), by Patient Position 2024 & 2032
- Figure 39: Middle East and Africa Cone Beam Computed Tomography Industry Revenue Share (%), by Patient Position 2024 & 2032
- Figure 40: Middle East and Africa Cone Beam Computed Tomography Industry Revenue (Million), by End User 2024 & 2032
- Figure 41: Middle East and Africa Cone Beam Computed Tomography Industry Revenue Share (%), by End User 2024 & 2032
- Figure 42: Middle East and Africa Cone Beam Computed Tomography Industry Revenue (Million), by Country 2024 & 2032
- Figure 43: Middle East and Africa Cone Beam Computed Tomography Industry Revenue Share (%), by Country 2024 & 2032
- Figure 44: South America Cone Beam Computed Tomography Industry Revenue (Million), by Application 2024 & 2032
- Figure 45: South America Cone Beam Computed Tomography Industry Revenue Share (%), by Application 2024 & 2032
- Figure 46: South America Cone Beam Computed Tomography Industry Revenue (Million), by Patient Position 2024 & 2032
- Figure 47: South America Cone Beam Computed Tomography Industry Revenue Share (%), by Patient Position 2024 & 2032
- Figure 48: South America Cone Beam Computed Tomography Industry Revenue (Million), by End User 2024 & 2032
- Figure 49: South America Cone Beam Computed Tomography Industry Revenue Share (%), by End User 2024 & 2032
- Figure 50: South America Cone Beam Computed Tomography Industry Revenue (Million), by Country 2024 & 2032
- Figure 51: South America Cone Beam Computed Tomography Industry Revenue Share (%), by Country 2024 & 2032
List of Tables
- Table 1: Global Cone Beam Computed Tomography Industry Revenue Million Forecast, by Region 2019 & 2032
- Table 2: Global Cone Beam Computed Tomography Industry Revenue Million Forecast, by Application 2019 & 2032
- Table 3: Global Cone Beam Computed Tomography Industry Revenue Million Forecast, by Patient Position 2019 & 2032
- Table 4: Global Cone Beam Computed Tomography Industry Revenue Million Forecast, by End User 2019 & 2032
- Table 5: Global Cone Beam Computed Tomography Industry Revenue Million Forecast, by Region 2019 & 2032
- Table 6: Global Cone Beam Computed Tomography Industry Revenue Million Forecast, by Country 2019 & 2032
- Table 7: United States Cone Beam Computed Tomography Industry Revenue (Million) Forecast, by Application 2019 & 2032
- Table 8: Canada Cone Beam Computed Tomography Industry Revenue (Million) Forecast, by Application 2019 & 2032
- Table 9: Mexico Cone Beam Computed Tomography Industry Revenue (Million) Forecast, by Application 2019 & 2032
- Table 10: Global Cone Beam Computed Tomography Industry Revenue Million Forecast, by Country 2019 & 2032
- Table 11: Germany Cone Beam Computed Tomography Industry Revenue (Million) Forecast, by Application 2019 & 2032
- Table 12: United Kingdom Cone Beam Computed Tomography Industry Revenue (Million) Forecast, by Application 2019 & 2032
- Table 13: France Cone Beam Computed Tomography Industry Revenue (Million) Forecast, by Application 2019 & 2032
- Table 14: Italy Cone Beam Computed Tomography Industry Revenue (Million) Forecast, by Application 2019 & 2032
- Table 15: Spain Cone Beam Computed Tomography Industry Revenue (Million) Forecast, by Application 2019 & 2032
- Table 16: Rest of Europe Cone Beam Computed Tomography Industry Revenue (Million) Forecast, by Application 2019 & 2032
- Table 17: Global Cone Beam Computed Tomography Industry Revenue Million Forecast, by Country 2019 & 2032
- Table 18: China Cone Beam Computed Tomography Industry Revenue (Million) Forecast, by Application 2019 & 2032
- Table 19: Japan Cone Beam Computed Tomography Industry Revenue (Million) Forecast, by Application 2019 & 2032
- Table 20: India Cone Beam Computed Tomography Industry Revenue (Million) Forecast, by Application 2019 & 2032
- Table 21: Australia Cone Beam Computed Tomography Industry Revenue (Million) Forecast, by Application 2019 & 2032
- Table 22: South Korea Cone Beam Computed Tomography Industry Revenue (Million) Forecast, by Application 2019 & 2032
- Table 23: Rest of Asia Pacific Cone Beam Computed Tomography Industry Revenue (Million) Forecast, by Application 2019 & 2032
- Table 24: Global Cone Beam Computed Tomography Industry Revenue Million Forecast, by Country 2019 & 2032
- Table 25: Brazil Cone Beam Computed Tomography Industry Revenue (Million) Forecast, by Application 2019 & 2032
- Table 26: Argentina Cone Beam Computed Tomography Industry Revenue (Million) Forecast, by Application 2019 & 2032
- Table 27: Rest of South America Cone Beam Computed Tomography Industry Revenue (Million) Forecast, by Application 2019 & 2032
- Table 28: Global Cone Beam Computed Tomography Industry Revenue Million Forecast, by Country 2019 & 2032
- Table 29: GCC Cone Beam Computed Tomography Industry Revenue (Million) Forecast, by Application 2019 & 2032
- Table 30: South Africa Cone Beam Computed Tomography Industry Revenue (Million) Forecast, by Application 2019 & 2032
- Table 31: Rest of Middle East and Africa Cone Beam Computed Tomography Industry Revenue (Million) Forecast, by Application 2019 & 2032
- Table 32: Global Cone Beam Computed Tomography Industry Revenue Million Forecast, by Application 2019 & 2032
- Table 33: Global Cone Beam Computed Tomography Industry Revenue Million Forecast, by Patient Position 2019 & 2032
- Table 34: Global Cone Beam Computed Tomography Industry Revenue Million Forecast, by End User 2019 & 2032
- Table 35: Global Cone Beam Computed Tomography Industry Revenue Million Forecast, by Country 2019 & 2032
- Table 36: United States Cone Beam Computed Tomography Industry Revenue (Million) Forecast, by Application 2019 & 2032
- Table 37: Canada Cone Beam Computed Tomography Industry Revenue (Million) Forecast, by Application 2019 & 2032
- Table 38: Mexico Cone Beam Computed Tomography Industry Revenue (Million) Forecast, by Application 2019 & 2032
- Table 39: Global Cone Beam Computed Tomography Industry Revenue Million Forecast, by Application 2019 & 2032
- Table 40: Global Cone Beam Computed Tomography Industry Revenue Million Forecast, by Patient Position 2019 & 2032
- Table 41: Global Cone Beam Computed Tomography Industry Revenue Million Forecast, by End User 2019 & 2032
- Table 42: Global Cone Beam Computed Tomography Industry Revenue Million Forecast, by Country 2019 & 2032
- Table 43: Germany Cone Beam Computed Tomography Industry Revenue (Million) Forecast, by Application 2019 & 2032
- Table 44: United Kingdom Cone Beam Computed Tomography Industry Revenue (Million) Forecast, by Application 2019 & 2032
- Table 45: France Cone Beam Computed Tomography Industry Revenue (Million) Forecast, by Application 2019 & 2032
- Table 46: Italy Cone Beam Computed Tomography Industry Revenue (Million) Forecast, by Application 2019 & 2032
- Table 47: Spain Cone Beam Computed Tomography Industry Revenue (Million) Forecast, by Application 2019 & 2032
- Table 48: Rest of Europe Cone Beam Computed Tomography Industry Revenue (Million) Forecast, by Application 2019 & 2032
- Table 49: Global Cone Beam Computed Tomography Industry Revenue Million Forecast, by Application 2019 & 2032
- Table 50: Global Cone Beam Computed Tomography Industry Revenue Million Forecast, by Patient Position 2019 & 2032
- Table 51: Global Cone Beam Computed Tomography Industry Revenue Million Forecast, by End User 2019 & 2032
- Table 52: Global Cone Beam Computed Tomography Industry Revenue Million Forecast, by Country 2019 & 2032
- Table 53: China Cone Beam Computed Tomography Industry Revenue (Million) Forecast, by Application 2019 & 2032
- Table 54: Japan Cone Beam Computed Tomography Industry Revenue (Million) Forecast, by Application 2019 & 2032
- Table 55: India Cone Beam Computed Tomography Industry Revenue (Million) Forecast, by Application 2019 & 2032
- Table 56: Australia Cone Beam Computed Tomography Industry Revenue (Million) Forecast, by Application 2019 & 2032
- Table 57: South Korea Cone Beam Computed Tomography Industry Revenue (Million) Forecast, by Application 2019 & 2032
- Table 58: Rest of Asia Pacific Cone Beam Computed Tomography Industry Revenue (Million) Forecast, by Application 2019 & 2032
- Table 59: Global Cone Beam Computed Tomography Industry Revenue Million Forecast, by Application 2019 & 2032
- Table 60: Global Cone Beam Computed Tomography Industry Revenue Million Forecast, by Patient Position 2019 & 2032
- Table 61: Global Cone Beam Computed Tomography Industry Revenue Million Forecast, by End User 2019 & 2032
- Table 62: Global Cone Beam Computed Tomography Industry Revenue Million Forecast, by Country 2019 & 2032
- Table 63: GCC Cone Beam Computed Tomography Industry Revenue (Million) Forecast, by Application 2019 & 2032
- Table 64: South Africa Cone Beam Computed Tomography Industry Revenue (Million) Forecast, by Application 2019 & 2032
- Table 65: Rest of Middle East and Africa Cone Beam Computed Tomography Industry Revenue (Million) Forecast, by Application 2019 & 2032
- Table 66: Global Cone Beam Computed Tomography Industry Revenue Million Forecast, by Application 2019 & 2032
- Table 67: Global Cone Beam Computed Tomography Industry Revenue Million Forecast, by Patient Position 2019 & 2032
- Table 68: Global Cone Beam Computed Tomography Industry Revenue Million Forecast, by End User 2019 & 2032
- Table 69: Global Cone Beam Computed Tomography Industry Revenue Million Forecast, by Country 2019 & 2032
- Table 70: Brazil Cone Beam Computed Tomography Industry Revenue (Million) Forecast, by Application 2019 & 2032
- Table 71: Argentina Cone Beam Computed Tomography Industry Revenue (Million) Forecast, by Application 2019 & 2032
- Table 72: Rest of South America Cone Beam Computed Tomography Industry Revenue (Million) Forecast, by Application 2019 & 2032
Frequently Asked Questions
1. What is the projected Compound Annual Growth Rate (CAGR) of the Cone Beam Computed Tomography Industry?
The projected CAGR is approximately 9.90%.
2. Which companies are prominent players in the Cone Beam Computed Tomography Industry?
Key companies in the market include Vatech America, Dentsply Sirona, Curve Beam LLC, Danaher Corporation, Prexion Corporation, Carestream Health Inc, Planmeca Group, Asahi RoEntgen Ind Co Ltd, J Morita Mfg Corp, Cefla S C.
3. What are the main segments of the Cone Beam Computed Tomography Industry?
The market segments include Application, Patient Position, End User.
4. Can you provide details about the market size?
The market size is estimated to be USD XX Million as of 2022.
5. What are some drivers contributing to market growth?
Increasing Cases of Dental Disorders; Advancements in Technology; Expanding Application Areas of CBCT Systems.
6. What are the notable trends driving market growth?
Periodontal Applications is Expected to Dominate the Cone Beam Computed Tomography (CBCT) Market During the Forecast Period.
7. Are there any restraints impacting market growth?
High Cost of CBCT Systems; Imaging Issues.
8. Can you provide examples of recent developments in the market?
In June 2022, Xoran Technologies received a patent for a modular cone beam computed tomography (CT) system assembly.
9. What pricing options are available for accessing the report?
Pricing options include single-user, multi-user, and enterprise licenses priced at USD 4750, USD 5250, and USD 8750 respectively.
10. Is the market size provided in terms of value or volume?
The market size is provided in terms of value, measured in Million.
11. Are there any specific market keywords associated with the report?
Yes, the market keyword associated with the report is "Cone Beam Computed Tomography Industry," which aids in identifying and referencing the specific market segment covered.
12. How do I determine which pricing option suits my needs best?
The pricing options vary based on user requirements and access needs. Individual users may opt for single-user licenses, while businesses requiring broader access may choose multi-user or enterprise licenses for cost-effective access to the report.
13. Are there any additional resources or data provided in the Cone Beam Computed Tomography Industry report?
While the report offers comprehensive insights, it's advisable to review the specific contents or supplementary materials provided to ascertain if additional resources or data are available.
14. How can I stay updated on further developments or reports in the Cone Beam Computed Tomography Industry?
To stay informed about further developments, trends, and reports in the Cone Beam Computed Tomography Industry, consider subscribing to industry newsletters, following relevant companies and organizations, or regularly checking reputable industry news sources and publications.
Methodology
Step 1 - Identification of Relevant Samples Size from Population Database


Step 2 - Approaches for Defining Global Market Size (Value, Volume* & Price*)

Note*: In applicable scenarios
Step 3 - Data Sources
Primary Research
- Web Analytics
- Survey Reports
- Research Institute
- Latest Research Reports
- Opinion Leaders
Secondary Research
- Annual Reports
- White Paper
- Latest Press Release
- Industry Association
- Paid Database
- Investor Presentations

Step 4 - Data Triangulation
Involves using different sources of information in order to increase the validity of a study
These sources are likely to be stakeholders in a program - participants, other researchers, program staff, other community members, and so on.
Then we put all data in single framework & apply various statistical tools to find out the dynamic on the market.
During the analysis stage, feedback from the stakeholder groups would be compared to determine areas of agreement as well as areas of divergence
