

Key Insights
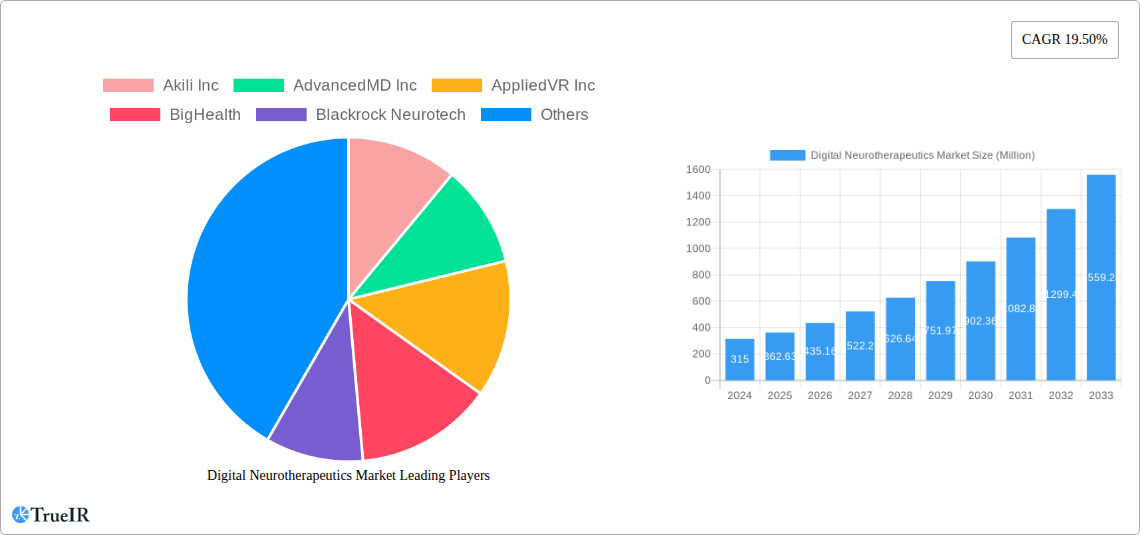
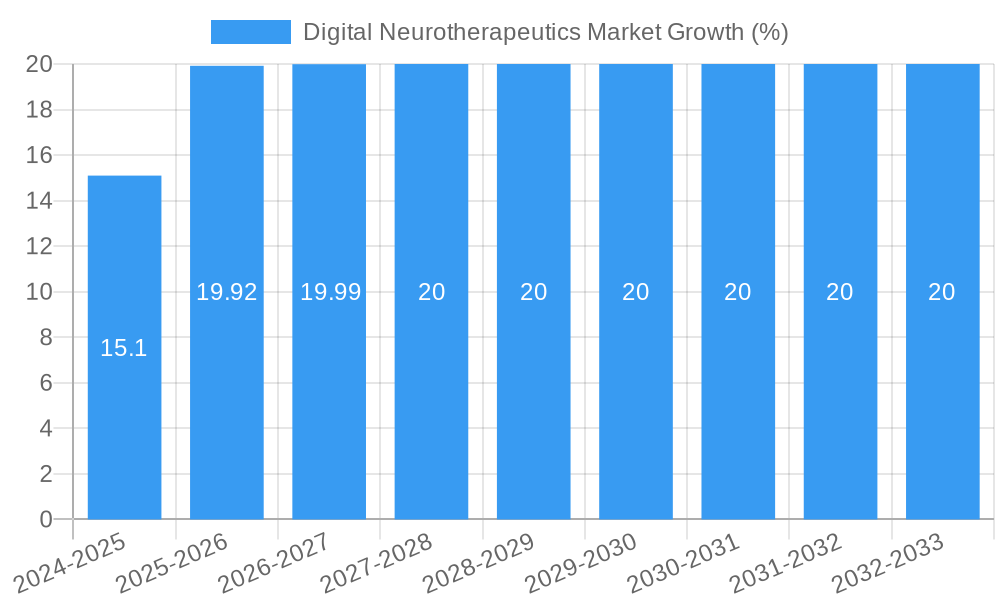
The global Digital Neurotherapeutics Market is poised for remarkable expansion, projected to reach a significant valuation of USD 362.63 million by 2025, fueled by a robust Compound Annual Growth Rate (CAGR) of 19.50% during the forecast period of 2025-2033. This burgeoning market is propelled by a confluence of factors, including the increasing prevalence of neurological disorders such as Alzheimer's Disease, Parkinson's Disease, Multiple Sclerosis, and Epilepsy, coupled with the growing adoption of digital health solutions. The integration of advanced technologies like artificial intelligence, machine learning, and virtual reality is revolutionizing the diagnosis, treatment, and management of these conditions, offering personalized and accessible therapeutic interventions. Furthermore, a greater emphasis on preventative healthcare and the empowerment of patients to actively participate in their treatment journeys are significant drivers of this market's growth. The shift towards remote patient monitoring and telehealth services, amplified by recent global health events, has further accelerated the demand for digital neurotherapeutic solutions, enabling continuous engagement and improved patient outcomes.
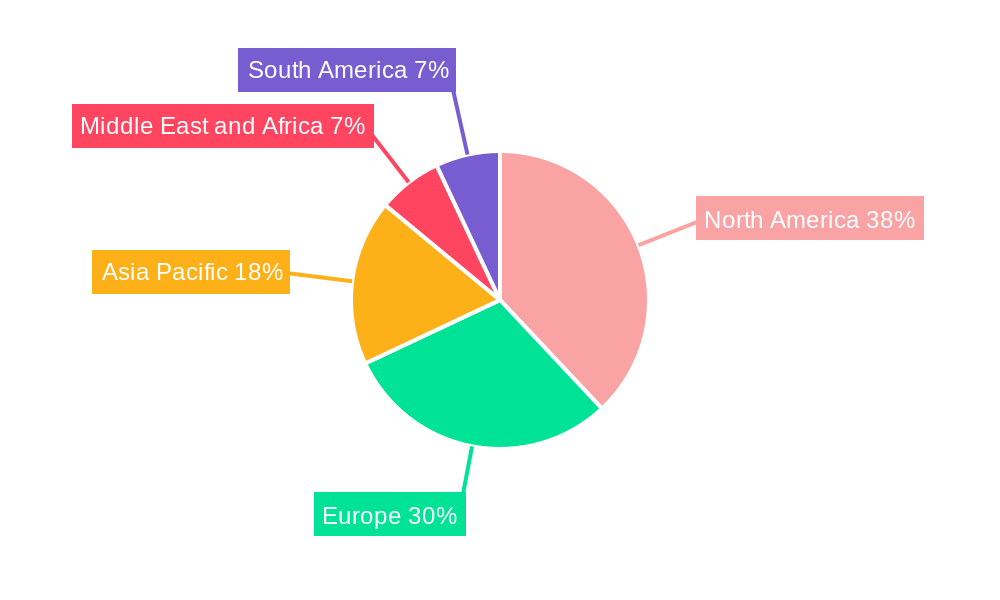
The market's expansion is further supported by continuous innovation in therapeutic components, with software, hardware, and services all playing critical roles in delivering effective digital neurotherapeutics. While the demand is widespread across patient populations, providers are increasingly recognizing the value proposition of these solutions in enhancing efficiency and expanding reach. Payers are also beginning to acknowledge the long-term cost-effectiveness and improved patient well-being associated with digital neurotherapeutics, leading to greater reimbursement and adoption. Geographically, North America currently leads the market, driven by early adoption of advanced technologies and a strong healthcare infrastructure. However, the Asia Pacific region is expected to witness substantial growth due to increasing healthcare expenditure, a large patient pool, and a growing focus on technological advancements in healthcare. Despite the promising outlook, potential restraints such as regulatory hurdles, data privacy concerns, and the need for greater digital literacy among certain patient demographics require strategic attention to ensure sustained and equitable market development.
Unveiling the Dynamic Digital Neurotherapeutics Market: A Comprehensive Analysis (2019-2033)
This in-depth report provides a critical examination of the burgeoning Digital Neurotherapeutics Market, a transformative sector revolutionizing neurological disorder management. Covering the historical period of 2019–2024, the base year of 2025, and extending through a robust forecast period of 2025–2033, this analysis leverages high-volume SEO keywords to offer unparalleled insights for industry stakeholders. Our comprehensive research delves into market structure, key trends, dominant segments, product innovations, growth drivers, challenges, and the competitive landscape, ensuring you are equipped with the most current and actionable intelligence. We project the Digital Neurotherapeutics Market Size to reach $XX Million by 2025, with an anticipated Compound Annual Growth Rate (CAGR) of XX% during the forecast period.
Digital Neurotherapeutics Market Market Structure & Competitive Landscape
The Digital Neurotherapeutics Market exhibits a dynamic and evolving competitive landscape characterized by increasing innovation and strategic collaborations. Market concentration is moderate, with a significant number of emerging players alongside established technology and healthcare companies. Key innovation drivers include advancements in artificial intelligence (AI) for diagnostics and personalized treatment, the integration of wearable technology for continuous patient monitoring, and the development of evidence-based digital interventions. Regulatory impacts, particularly from bodies like the FDA, are shaping the market by defining pathways for digital therapeutic approval and reimbursement, influencing product development strategies. Product substitutes are evolving, with traditional therapies facing competition from more accessible and scalable digital solutions. The end-user segmentation reveals a growing emphasis on patient-centric care, with increasing adoption by patients, providers, and payers seeking efficient and effective neurological disorder management. Mergers and acquisitions (M&A) trends are expected to accelerate as larger organizations seek to acquire innovative technologies and expand their digital health portfolios. The volume of M&A activities is projected to increase by XX% over the forecast period, reflecting the market's attractiveness.
- Key Innovation Drivers: AI in diagnostics, wearable tech integration, evidence-based digital interventions.
- Regulatory Influences: FDA approvals, reimbursement policies shaping R&D.
- Market Concentration: Moderate, with a mix of startups and established players.
- M&A Trends: Anticipated acceleration driven by technology acquisition and portfolio expansion.
Digital Neurotherapeutics Market Market Trends & Opportunities
The Digital Neurotherapeutics Market is on an upward trajectory, fueled by a confluence of technological advancements, increasing prevalence of neurological disorders, and a growing acceptance of digital health solutions. Market size growth is a significant characteristic, with projections indicating a substantial expansion from the base year of 2025. Technological shifts are central to this growth, with Software segment expected to lead, driven by sophisticated algorithms for personalized interventions, remote monitoring capabilities, and data analytics for treatment efficacy tracking. The integration of Hardware, such as advanced sensors and wearable devices, is crucial for capturing real-world data, enabling continuous patient engagement, and delivering targeted therapies. Opportunities abound in developing user-friendly interfaces and ensuring seamless interoperability with existing healthcare systems.
Consumer preferences are increasingly shifting towards convenient, accessible, and personalized healthcare options. Digital neurotherapeutics offer a compelling solution, allowing patients to manage their conditions from the comfort of their homes, reducing the burden of frequent clinic visits. This patient empowerment trend is a major opportunity for market players. Furthermore, the growing awareness and diagnosis of neurological conditions like Alzheimer’s Disease, Parkinson’s Disease, Multiple Sclerosis, and Epilepsy are creating a substantial demand for innovative treatment modalities. The market is ripe for solutions addressing unmet needs in these specific indications, as well as emerging areas within Other Indications.
Competitive dynamics are intensifying, with companies differentiating themselves through clinical validation, strategic partnerships with healthcare providers and payers, and the development of robust digital platforms. The market penetration rate for digital neurotherapeutics is still in its nascent stages for many applications, indicating significant headroom for growth. Opportunities also lie in creating integrated care pathways that combine digital interventions with traditional medical approaches, fostering a holistic treatment ecosystem. The growing emphasis on value-based care further propels the demand for digital therapeutics that can demonstrate measurable improvements in patient outcomes and reduce overall healthcare costs. The Digital Neurotherapeutics Market represents a significant opportunity for innovation and investment, promising to reshape neurological care delivery.
- Market Size Growth: Significant expansion projected from 2025 onwards.
- Technological Shifts: Dominance of software and integration of advanced hardware.
- Consumer Preferences: Rising demand for convenience, accessibility, and personalization.
- Market Penetration: Nascent for many applications, indicating substantial growth potential.
Dominant Markets & Segments in Digital Neurotherapeutics Market
The Digital Neurotherapeutics Market is characterized by diverse regional adoption and segment-specific growth. The Software segment is anticipated to dominate the market, driven by the increasing sophistication of AI-powered algorithms for personalized treatment plans and diagnostic tools. This segment's growth is further bolstered by the development of intuitive user interfaces and cloud-based platforms for seamless data management and remote accessibility. Key growth drivers for the software segment include the growing volume of neurological data available for analysis and the demand for predictive analytics in disease management.
In terms of indications, Alzheimer’s Disease and Parkinson’s Disease are projected to be leading segments, owing to their high prevalence and the significant unmet need for effective management strategies. The development of digital therapeutics that can slow disease progression, alleviate symptoms, and improve cognitive function in these patient populations presents a substantial market opportunity. Multiple Sclerosis and Epilepsy also represent growing segments, with digital solutions offering potential benefits in symptom tracking, seizure management, and adherence to treatment regimens. The Other Indications segment is expected to witness robust growth as research expands into novel applications for digital neurotherapeutics.
From an end-user perspective, Patients are emerging as a primary driver, seeking greater autonomy and convenience in managing their neurological conditions. The accessibility and engagement offered by digital therapeutics empower patients to take a more active role in their healthcare journey. Providers are increasingly adopting these solutions to enhance patient monitoring, improve treatment adherence, and optimize clinical workflows. The ability of digital therapeutics to provide real-time patient data allows for more informed clinical decision-making. Payers are also showing growing interest, recognizing the potential for digital neurotherapeutics to reduce long-term healthcare costs associated with chronic neurological conditions by preventing exacerbations and hospitalizations.
Geographically, North America is expected to maintain its dominance in the Digital Neurotherapeutics Market, driven by a robust healthcare infrastructure, early adoption of new technologies, and favorable regulatory environments. Significant investments in research and development, coupled with a high prevalence of neurological disorders, further solidify its leading position. The United States, in particular, is a key market, with a well-established reimbursement framework and a strong presence of both innovative startups and established pharmaceutical and technology companies. Europe is another significant region, with increasing government initiatives and research collaborations promoting the adoption of digital health solutions. The Asia Pacific region is projected to exhibit the highest growth rate, fueled by a growing patient population, increasing healthcare expenditure, and a rapidly expanding digital infrastructure.
- Dominant Segment (Component): Software, driven by AI and personalization.
- Leading Indications: Alzheimer’s Disease, Parkinson’s Disease due to high prevalence and unmet needs.
- Key End User: Patients, seeking autonomy and convenience.
- Dominant Region: North America, due to advanced infrastructure and early adoption.
Digital Neurotherapeutics Market Product Analysis
The Digital Neurotherapeutics Market is witnessing a surge in product innovations focused on enhancing efficacy, accessibility, and patient engagement. Companies are developing advanced software platforms leveraging AI and machine learning for personalized treatment regimens, disease progression prediction, and symptom management. Hardware innovations include sophisticated wearable sensors for continuous, real-time data collection of physiological and behavioral metrics, crucial for objective assessment and therapeutic adjustments. These products offer distinct applications in managing chronic neurological conditions, from cognitive rehabilitation for Alzheimer's patients to motor function improvement for Parkinson's patients. The competitive advantage lies in robust clinical validation, strong evidence of therapeutic benefit, and seamless integration into existing patient care pathways.
Key Drivers, Barriers & Challenges in Digital Neurotherapeutics Market
Key Drivers propelling the Digital Neurotherapeutics Market include the increasing global prevalence of neurological disorders, necessitating innovative and scalable treatment solutions. Technological advancements in AI, machine learning, and wearable sensors are enabling the development of more sophisticated and personalized digital interventions. Growing patient and provider acceptance of digital health solutions, driven by convenience and improved accessibility, is a significant catalyst. Furthermore, favorable regulatory pathways and increasing reimbursement opportunities are encouraging investment and adoption.
Barriers and Challenges impacting the Digital Neurotherapeutics Market include stringent regulatory approval processes and the need for extensive clinical validation to demonstrate safety and efficacy. Supply chain issues related to specialized hardware components and software development can pose logistical hurdles. Competitive pressures from both established pharmaceutical companies and a growing number of innovative startups necessitate continuous innovation and market differentiation. The need for robust cybersecurity measures to protect sensitive patient data is paramount, adding to development costs and complexity.
Growth Drivers in the Digital Neurotherapeutics Market Market
The Digital Neurotherapeutics Market is experiencing robust growth driven by several key factors. The escalating burden of neurological diseases like Alzheimer’s, Parkinson’s, and Multiple Sclerosis creates a persistent demand for novel treatment modalities. Technological advancements, particularly in AI and machine learning, are enabling the creation of highly personalized and adaptive digital interventions. Increasing patient-centricity in healthcare models empowers individuals to actively manage their conditions, making accessible digital solutions highly attractive. Favorable reimbursement policies being introduced by payers recognizing the long-term cost-effectiveness of digital therapeutics are further accelerating market penetration.
Challenges Impacting Digital Neurotherapeutics Market Growth
Despite promising growth, the Digital Neurotherapeutics Market faces significant challenges. The rigorous and often lengthy regulatory approval pathways, coupled with the substantial investment required for comprehensive clinical trials, can be a major restraint. Ensuring data privacy and security for sensitive neurological health information is a critical concern that necessitates robust cybersecurity infrastructure and compliance with evolving data protection laws. The supply chain for specialized hardware components, such as advanced biosensors, can be susceptible to disruptions. Intense competitive pressures from a burgeoning ecosystem of digital health companies require continuous innovation and demonstrable clinical value to stand out.
Key Players Shaping the Digital Neurotherapeutics Market Market
- Akili Inc
- AdvancedMD Inc
- AppliedVR Inc
- BigHealth
- Blackrock Neurotech
- Cognivive Inc
- Neofect Co Ltd
- Omada Health Inc
- Neurotherapeutic Pediatric Therapies Inc
- Mindmaze
Significant Digital Neurotherapeutics Market Industry Milestones
- February 2024: The University of London's neurotherapeutics group launched the iTalkBetter app. This app provides speech therapy for people with language disorder aphasia, which has been found to improve their ability to talk significantly.
- October 2023: MedRhythms reported that InTandem (MR-001) was available for prescription for at-home use to improve walking and ambulation in adults living with chronic stroke walking impairments. InTandem is an evidence-based neurorehabilitation system based on the principles of rhythmic auditory stimulation (RAS), an established and standardized intervention utilizing the mechanism of action of auditory-motor entrainment.
Future Outlook for Digital Neurotherapeutics Market Market
The future outlook for the Digital Neurotherapeutics Market is exceptionally promising, characterized by sustained growth and expanding applications. Key growth catalysts include further integration of AI for predictive diagnostics and hyper-personalized treatment plans, leading to improved patient outcomes and reduced healthcare costs. Strategic opportunities lie in expanding indications to encompass a wider spectrum of neurological and psychiatric disorders, as well as forging deeper collaborations between technology developers, healthcare providers, and pharmaceutical companies. The increasing adoption of value-based care models will continue to fuel the demand for digital therapeutics that demonstrate tangible clinical and economic benefits. The market potential is vast, with digital neurotherapeutics poised to become an indispensable component of neurological care delivery worldwide.
Digital Neurotherapeutics Market Segmentation
-
1. Component
- 1.1. Software
- 1.2. Hardware
- 1.3. Services
-
2. Indication
- 2.1. Alzheimer’s Disease
- 2.2. Parkinson’s Disease
- 2.3. Multiple Sclerosis
- 2.4. Epilepsy
- 2.5. Other Indications
-
3. End User
- 3.1. Patients
- 3.2. Providers
- 3.3. Payers
- 3.4. Other End Users
Digital Neurotherapeutics Market Segmentation By Geography
-
1. North America
- 1.1. United States
- 1.2. Canada
- 1.3. Mexico
-
2. Europe
- 2.1. Germany
- 2.2. United Kingdom
- 2.3. France
- 2.4. Italy
- 2.5. Spain
- 2.6. Rest of Europe
-
3. Asia Pacific
- 3.1. China
- 3.2. Japan
- 3.3. India
- 3.4. Australia
- 3.5. South Korea
- 3.6. Rest of Asia Pacific
-
4. Middle East and Africa
- 4.1. GCC
- 4.2. South Africa
- 4.3. Rest of Middle East and Africa
-
5. South America
- 5.1. Brazil
- 5.2. Argentina
- 5.3. Rest of South America
Digital Neurotherapeutics Market REPORT HIGHLIGHTS
| Aspects | Details |
|---|---|
| Study Period | 2019-2033 |
| Base Year | 2024 |
| Estimated Year | 2025 |
| Forecast Period | 2025-2033 |
| Historical Period | 2019-2024 |
| Growth Rate | CAGR of 19.50% from 2019-2033 |
| Segmentation |
|
Table of Contents
- 1. Introduction
- 1.1. Research Scope
- 1.2. Market Segmentation
- 1.3. Research Methodology
- 1.4. Definitions and Assumptions
- 2. Executive Summary
- 2.1. Introduction
- 3. Market Dynamics
- 3.1. Introduction
- 3.2. Market Drivers
- 3.2.1. Rising Prevalence of Neurological Disorders; Growing Adoption of Digital Technology in Neurology Care
- 3.3. Market Restrains
- 3.3.1. Rising Prevalence of Neurological Disorders; Growing Adoption of Digital Technology in Neurology Care
- 3.4. Market Trends
- 3.4.1. The Multiple Sclerosis Segment is Expected to Hold Significant Market Share Over the Forecast Period
- 4. Market Factor Analysis
- 4.1. Porters Five Forces
- 4.2. Supply/Value Chain
- 4.3. PESTEL analysis
- 4.4. Market Entropy
- 4.5. Patent/Trademark Analysis
- 5. Global Digital Neurotherapeutics Market Analysis, Insights and Forecast, 2019-2031
- 5.1. Market Analysis, Insights and Forecast - by Component
- 5.1.1. Software
- 5.1.2. Hardware
- 5.1.3. Services
- 5.2. Market Analysis, Insights and Forecast - by Indication
- 5.2.1. Alzheimer’s Disease
- 5.2.2. Parkinson’s Disease
- 5.2.3. Multiple Sclerosis
- 5.2.4. Epilepsy
- 5.2.5. Other Indications
- 5.3. Market Analysis, Insights and Forecast - by End User
- 5.3.1. Patients
- 5.3.2. Providers
- 5.3.3. Payers
- 5.3.4. Other End Users
- 5.4. Market Analysis, Insights and Forecast - by Region
- 5.4.1. North America
- 5.4.2. Europe
- 5.4.3. Asia Pacific
- 5.4.4. Middle East and Africa
- 5.4.5. South America
- 5.1. Market Analysis, Insights and Forecast - by Component
- 6. North America Digital Neurotherapeutics Market Analysis, Insights and Forecast, 2019-2031
- 6.1. Market Analysis, Insights and Forecast - by Component
- 6.1.1. Software
- 6.1.2. Hardware
- 6.1.3. Services
- 6.2. Market Analysis, Insights and Forecast - by Indication
- 6.2.1. Alzheimer’s Disease
- 6.2.2. Parkinson’s Disease
- 6.2.3. Multiple Sclerosis
- 6.2.4. Epilepsy
- 6.2.5. Other Indications
- 6.3. Market Analysis, Insights and Forecast - by End User
- 6.3.1. Patients
- 6.3.2. Providers
- 6.3.3. Payers
- 6.3.4. Other End Users
- 6.1. Market Analysis, Insights and Forecast - by Component
- 7. Europe Digital Neurotherapeutics Market Analysis, Insights and Forecast, 2019-2031
- 7.1. Market Analysis, Insights and Forecast - by Component
- 7.1.1. Software
- 7.1.2. Hardware
- 7.1.3. Services
- 7.2. Market Analysis, Insights and Forecast - by Indication
- 7.2.1. Alzheimer’s Disease
- 7.2.2. Parkinson’s Disease
- 7.2.3. Multiple Sclerosis
- 7.2.4. Epilepsy
- 7.2.5. Other Indications
- 7.3. Market Analysis, Insights and Forecast - by End User
- 7.3.1. Patients
- 7.3.2. Providers
- 7.3.3. Payers
- 7.3.4. Other End Users
- 7.1. Market Analysis, Insights and Forecast - by Component
- 8. Asia Pacific Digital Neurotherapeutics Market Analysis, Insights and Forecast, 2019-2031
- 8.1. Market Analysis, Insights and Forecast - by Component
- 8.1.1. Software
- 8.1.2. Hardware
- 8.1.3. Services
- 8.2. Market Analysis, Insights and Forecast - by Indication
- 8.2.1. Alzheimer’s Disease
- 8.2.2. Parkinson’s Disease
- 8.2.3. Multiple Sclerosis
- 8.2.4. Epilepsy
- 8.2.5. Other Indications
- 8.3. Market Analysis, Insights and Forecast - by End User
- 8.3.1. Patients
- 8.3.2. Providers
- 8.3.3. Payers
- 8.3.4. Other End Users
- 8.1. Market Analysis, Insights and Forecast - by Component
- 9. Middle East and Africa Digital Neurotherapeutics Market Analysis, Insights and Forecast, 2019-2031
- 9.1. Market Analysis, Insights and Forecast - by Component
- 9.1.1. Software
- 9.1.2. Hardware
- 9.1.3. Services
- 9.2. Market Analysis, Insights and Forecast - by Indication
- 9.2.1. Alzheimer’s Disease
- 9.2.2. Parkinson’s Disease
- 9.2.3. Multiple Sclerosis
- 9.2.4. Epilepsy
- 9.2.5. Other Indications
- 9.3. Market Analysis, Insights and Forecast - by End User
- 9.3.1. Patients
- 9.3.2. Providers
- 9.3.3. Payers
- 9.3.4. Other End Users
- 9.1. Market Analysis, Insights and Forecast - by Component
- 10. South America Digital Neurotherapeutics Market Analysis, Insights and Forecast, 2019-2031
- 10.1. Market Analysis, Insights and Forecast - by Component
- 10.1.1. Software
- 10.1.2. Hardware
- 10.1.3. Services
- 10.2. Market Analysis, Insights and Forecast - by Indication
- 10.2.1. Alzheimer’s Disease
- 10.2.2. Parkinson’s Disease
- 10.2.3. Multiple Sclerosis
- 10.2.4. Epilepsy
- 10.2.5. Other Indications
- 10.3. Market Analysis, Insights and Forecast - by End User
- 10.3.1. Patients
- 10.3.2. Providers
- 10.3.3. Payers
- 10.3.4. Other End Users
- 10.1. Market Analysis, Insights and Forecast - by Component
- 11. Competitive Analysis
- 11.1. Global Market Share Analysis 2024
- 11.2. Company Profiles
- 11.2.1 Akili Inc
- 11.2.1.1. Overview
- 11.2.1.2. Products
- 11.2.1.3. SWOT Analysis
- 11.2.1.4. Recent Developments
- 11.2.1.5. Financials (Based on Availability)
- 11.2.2 AdvancedMD Inc
- 11.2.2.1. Overview
- 11.2.2.2. Products
- 11.2.2.3. SWOT Analysis
- 11.2.2.4. Recent Developments
- 11.2.2.5. Financials (Based on Availability)
- 11.2.3 AppliedVR Inc
- 11.2.3.1. Overview
- 11.2.3.2. Products
- 11.2.3.3. SWOT Analysis
- 11.2.3.4. Recent Developments
- 11.2.3.5. Financials (Based on Availability)
- 11.2.4 BigHealth
- 11.2.4.1. Overview
- 11.2.4.2. Products
- 11.2.4.3. SWOT Analysis
- 11.2.4.4. Recent Developments
- 11.2.4.5. Financials (Based on Availability)
- 11.2.5 Blackrock Neurotech
- 11.2.5.1. Overview
- 11.2.5.2. Products
- 11.2.5.3. SWOT Analysis
- 11.2.5.4. Recent Developments
- 11.2.5.5. Financials (Based on Availability)
- 11.2.6 Cognivive Inc
- 11.2.6.1. Overview
- 11.2.6.2. Products
- 11.2.6.3. SWOT Analysis
- 11.2.6.4. Recent Developments
- 11.2.6.5. Financials (Based on Availability)
- 11.2.7 Neofect Co Ltd
- 11.2.7.1. Overview
- 11.2.7.2. Products
- 11.2.7.3. SWOT Analysis
- 11.2.7.4. Recent Developments
- 11.2.7.5. Financials (Based on Availability)
- 11.2.8 Omada Health Inc
- 11.2.8.1. Overview
- 11.2.8.2. Products
- 11.2.8.3. SWOT Analysis
- 11.2.8.4. Recent Developments
- 11.2.8.5. Financials (Based on Availability)
- 11.2.9 Neurotherapeutic Pediatric Therapies Inc
- 11.2.9.1. Overview
- 11.2.9.2. Products
- 11.2.9.3. SWOT Analysis
- 11.2.9.4. Recent Developments
- 11.2.9.5. Financials (Based on Availability)
- 11.2.10 Mindmaze*List Not Exhaustive
- 11.2.10.1. Overview
- 11.2.10.2. Products
- 11.2.10.3. SWOT Analysis
- 11.2.10.4. Recent Developments
- 11.2.10.5. Financials (Based on Availability)
- 11.2.1 Akili Inc
List of Figures
- Figure 1: Global Digital Neurotherapeutics Market Revenue Breakdown (Million, %) by Region 2024 & 2032
- Figure 2: Global Digital Neurotherapeutics Market Volume Breakdown (Million, %) by Region 2024 & 2032
- Figure 3: North America Digital Neurotherapeutics Market Revenue (Million), by Component 2024 & 2032
- Figure 4: North America Digital Neurotherapeutics Market Volume (Million), by Component 2024 & 2032
- Figure 5: North America Digital Neurotherapeutics Market Revenue Share (%), by Component 2024 & 2032
- Figure 6: North America Digital Neurotherapeutics Market Volume Share (%), by Component 2024 & 2032
- Figure 7: North America Digital Neurotherapeutics Market Revenue (Million), by Indication 2024 & 2032
- Figure 8: North America Digital Neurotherapeutics Market Volume (Million), by Indication 2024 & 2032
- Figure 9: North America Digital Neurotherapeutics Market Revenue Share (%), by Indication 2024 & 2032
- Figure 10: North America Digital Neurotherapeutics Market Volume Share (%), by Indication 2024 & 2032
- Figure 11: North America Digital Neurotherapeutics Market Revenue (Million), by End User 2024 & 2032
- Figure 12: North America Digital Neurotherapeutics Market Volume (Million), by End User 2024 & 2032
- Figure 13: North America Digital Neurotherapeutics Market Revenue Share (%), by End User 2024 & 2032
- Figure 14: North America Digital Neurotherapeutics Market Volume Share (%), by End User 2024 & 2032
- Figure 15: North America Digital Neurotherapeutics Market Revenue (Million), by Country 2024 & 2032
- Figure 16: North America Digital Neurotherapeutics Market Volume (Million), by Country 2024 & 2032
- Figure 17: North America Digital Neurotherapeutics Market Revenue Share (%), by Country 2024 & 2032
- Figure 18: North America Digital Neurotherapeutics Market Volume Share (%), by Country 2024 & 2032
- Figure 19: Europe Digital Neurotherapeutics Market Revenue (Million), by Component 2024 & 2032
- Figure 20: Europe Digital Neurotherapeutics Market Volume (Million), by Component 2024 & 2032
- Figure 21: Europe Digital Neurotherapeutics Market Revenue Share (%), by Component 2024 & 2032
- Figure 22: Europe Digital Neurotherapeutics Market Volume Share (%), by Component 2024 & 2032
- Figure 23: Europe Digital Neurotherapeutics Market Revenue (Million), by Indication 2024 & 2032
- Figure 24: Europe Digital Neurotherapeutics Market Volume (Million), by Indication 2024 & 2032
- Figure 25: Europe Digital Neurotherapeutics Market Revenue Share (%), by Indication 2024 & 2032
- Figure 26: Europe Digital Neurotherapeutics Market Volume Share (%), by Indication 2024 & 2032
- Figure 27: Europe Digital Neurotherapeutics Market Revenue (Million), by End User 2024 & 2032
- Figure 28: Europe Digital Neurotherapeutics Market Volume (Million), by End User 2024 & 2032
- Figure 29: Europe Digital Neurotherapeutics Market Revenue Share (%), by End User 2024 & 2032
- Figure 30: Europe Digital Neurotherapeutics Market Volume Share (%), by End User 2024 & 2032
- Figure 31: Europe Digital Neurotherapeutics Market Revenue (Million), by Country 2024 & 2032
- Figure 32: Europe Digital Neurotherapeutics Market Volume (Million), by Country 2024 & 2032
- Figure 33: Europe Digital Neurotherapeutics Market Revenue Share (%), by Country 2024 & 2032
- Figure 34: Europe Digital Neurotherapeutics Market Volume Share (%), by Country 2024 & 2032
- Figure 35: Asia Pacific Digital Neurotherapeutics Market Revenue (Million), by Component 2024 & 2032
- Figure 36: Asia Pacific Digital Neurotherapeutics Market Volume (Million), by Component 2024 & 2032
- Figure 37: Asia Pacific Digital Neurotherapeutics Market Revenue Share (%), by Component 2024 & 2032
- Figure 38: Asia Pacific Digital Neurotherapeutics Market Volume Share (%), by Component 2024 & 2032
- Figure 39: Asia Pacific Digital Neurotherapeutics Market Revenue (Million), by Indication 2024 & 2032
- Figure 40: Asia Pacific Digital Neurotherapeutics Market Volume (Million), by Indication 2024 & 2032
- Figure 41: Asia Pacific Digital Neurotherapeutics Market Revenue Share (%), by Indication 2024 & 2032
- Figure 42: Asia Pacific Digital Neurotherapeutics Market Volume Share (%), by Indication 2024 & 2032
- Figure 43: Asia Pacific Digital Neurotherapeutics Market Revenue (Million), by End User 2024 & 2032
- Figure 44: Asia Pacific Digital Neurotherapeutics Market Volume (Million), by End User 2024 & 2032
- Figure 45: Asia Pacific Digital Neurotherapeutics Market Revenue Share (%), by End User 2024 & 2032
- Figure 46: Asia Pacific Digital Neurotherapeutics Market Volume Share (%), by End User 2024 & 2032
- Figure 47: Asia Pacific Digital Neurotherapeutics Market Revenue (Million), by Country 2024 & 2032
- Figure 48: Asia Pacific Digital Neurotherapeutics Market Volume (Million), by Country 2024 & 2032
- Figure 49: Asia Pacific Digital Neurotherapeutics Market Revenue Share (%), by Country 2024 & 2032
- Figure 50: Asia Pacific Digital Neurotherapeutics Market Volume Share (%), by Country 2024 & 2032
- Figure 51: Middle East and Africa Digital Neurotherapeutics Market Revenue (Million), by Component 2024 & 2032
- Figure 52: Middle East and Africa Digital Neurotherapeutics Market Volume (Million), by Component 2024 & 2032
- Figure 53: Middle East and Africa Digital Neurotherapeutics Market Revenue Share (%), by Component 2024 & 2032
- Figure 54: Middle East and Africa Digital Neurotherapeutics Market Volume Share (%), by Component 2024 & 2032
- Figure 55: Middle East and Africa Digital Neurotherapeutics Market Revenue (Million), by Indication 2024 & 2032
- Figure 56: Middle East and Africa Digital Neurotherapeutics Market Volume (Million), by Indication 2024 & 2032
- Figure 57: Middle East and Africa Digital Neurotherapeutics Market Revenue Share (%), by Indication 2024 & 2032
- Figure 58: Middle East and Africa Digital Neurotherapeutics Market Volume Share (%), by Indication 2024 & 2032
- Figure 59: Middle East and Africa Digital Neurotherapeutics Market Revenue (Million), by End User 2024 & 2032
- Figure 60: Middle East and Africa Digital Neurotherapeutics Market Volume (Million), by End User 2024 & 2032
- Figure 61: Middle East and Africa Digital Neurotherapeutics Market Revenue Share (%), by End User 2024 & 2032
- Figure 62: Middle East and Africa Digital Neurotherapeutics Market Volume Share (%), by End User 2024 & 2032
- Figure 63: Middle East and Africa Digital Neurotherapeutics Market Revenue (Million), by Country 2024 & 2032
- Figure 64: Middle East and Africa Digital Neurotherapeutics Market Volume (Million), by Country 2024 & 2032
- Figure 65: Middle East and Africa Digital Neurotherapeutics Market Revenue Share (%), by Country 2024 & 2032
- Figure 66: Middle East and Africa Digital Neurotherapeutics Market Volume Share (%), by Country 2024 & 2032
- Figure 67: South America Digital Neurotherapeutics Market Revenue (Million), by Component 2024 & 2032
- Figure 68: South America Digital Neurotherapeutics Market Volume (Million), by Component 2024 & 2032
- Figure 69: South America Digital Neurotherapeutics Market Revenue Share (%), by Component 2024 & 2032
- Figure 70: South America Digital Neurotherapeutics Market Volume Share (%), by Component 2024 & 2032
- Figure 71: South America Digital Neurotherapeutics Market Revenue (Million), by Indication 2024 & 2032
- Figure 72: South America Digital Neurotherapeutics Market Volume (Million), by Indication 2024 & 2032
- Figure 73: South America Digital Neurotherapeutics Market Revenue Share (%), by Indication 2024 & 2032
- Figure 74: South America Digital Neurotherapeutics Market Volume Share (%), by Indication 2024 & 2032
- Figure 75: South America Digital Neurotherapeutics Market Revenue (Million), by End User 2024 & 2032
- Figure 76: South America Digital Neurotherapeutics Market Volume (Million), by End User 2024 & 2032
- Figure 77: South America Digital Neurotherapeutics Market Revenue Share (%), by End User 2024 & 2032
- Figure 78: South America Digital Neurotherapeutics Market Volume Share (%), by End User 2024 & 2032
- Figure 79: South America Digital Neurotherapeutics Market Revenue (Million), by Country 2024 & 2032
- Figure 80: South America Digital Neurotherapeutics Market Volume (Million), by Country 2024 & 2032
- Figure 81: South America Digital Neurotherapeutics Market Revenue Share (%), by Country 2024 & 2032
- Figure 82: South America Digital Neurotherapeutics Market Volume Share (%), by Country 2024 & 2032
List of Tables
- Table 1: Global Digital Neurotherapeutics Market Revenue Million Forecast, by Region 2019 & 2032
- Table 2: Global Digital Neurotherapeutics Market Volume Million Forecast, by Region 2019 & 2032
- Table 3: Global Digital Neurotherapeutics Market Revenue Million Forecast, by Component 2019 & 2032
- Table 4: Global Digital Neurotherapeutics Market Volume Million Forecast, by Component 2019 & 2032
- Table 5: Global Digital Neurotherapeutics Market Revenue Million Forecast, by Indication 2019 & 2032
- Table 6: Global Digital Neurotherapeutics Market Volume Million Forecast, by Indication 2019 & 2032
- Table 7: Global Digital Neurotherapeutics Market Revenue Million Forecast, by End User 2019 & 2032
- Table 8: Global Digital Neurotherapeutics Market Volume Million Forecast, by End User 2019 & 2032
- Table 9: Global Digital Neurotherapeutics Market Revenue Million Forecast, by Region 2019 & 2032
- Table 10: Global Digital Neurotherapeutics Market Volume Million Forecast, by Region 2019 & 2032
- Table 11: Global Digital Neurotherapeutics Market Revenue Million Forecast, by Component 2019 & 2032
- Table 12: Global Digital Neurotherapeutics Market Volume Million Forecast, by Component 2019 & 2032
- Table 13: Global Digital Neurotherapeutics Market Revenue Million Forecast, by Indication 2019 & 2032
- Table 14: Global Digital Neurotherapeutics Market Volume Million Forecast, by Indication 2019 & 2032
- Table 15: Global Digital Neurotherapeutics Market Revenue Million Forecast, by End User 2019 & 2032
- Table 16: Global Digital Neurotherapeutics Market Volume Million Forecast, by End User 2019 & 2032
- Table 17: Global Digital Neurotherapeutics Market Revenue Million Forecast, by Country 2019 & 2032
- Table 18: Global Digital Neurotherapeutics Market Volume Million Forecast, by Country 2019 & 2032
- Table 19: United States Digital Neurotherapeutics Market Revenue (Million) Forecast, by Application 2019 & 2032
- Table 20: United States Digital Neurotherapeutics Market Volume (Million) Forecast, by Application 2019 & 2032
- Table 21: Canada Digital Neurotherapeutics Market Revenue (Million) Forecast, by Application 2019 & 2032
- Table 22: Canada Digital Neurotherapeutics Market Volume (Million) Forecast, by Application 2019 & 2032
- Table 23: Mexico Digital Neurotherapeutics Market Revenue (Million) Forecast, by Application 2019 & 2032
- Table 24: Mexico Digital Neurotherapeutics Market Volume (Million) Forecast, by Application 2019 & 2032
- Table 25: Global Digital Neurotherapeutics Market Revenue Million Forecast, by Component 2019 & 2032
- Table 26: Global Digital Neurotherapeutics Market Volume Million Forecast, by Component 2019 & 2032
- Table 27: Global Digital Neurotherapeutics Market Revenue Million Forecast, by Indication 2019 & 2032
- Table 28: Global Digital Neurotherapeutics Market Volume Million Forecast, by Indication 2019 & 2032
- Table 29: Global Digital Neurotherapeutics Market Revenue Million Forecast, by End User 2019 & 2032
- Table 30: Global Digital Neurotherapeutics Market Volume Million Forecast, by End User 2019 & 2032
- Table 31: Global Digital Neurotherapeutics Market Revenue Million Forecast, by Country 2019 & 2032
- Table 32: Global Digital Neurotherapeutics Market Volume Million Forecast, by Country 2019 & 2032
- Table 33: Germany Digital Neurotherapeutics Market Revenue (Million) Forecast, by Application 2019 & 2032
- Table 34: Germany Digital Neurotherapeutics Market Volume (Million) Forecast, by Application 2019 & 2032
- Table 35: United Kingdom Digital Neurotherapeutics Market Revenue (Million) Forecast, by Application 2019 & 2032
- Table 36: United Kingdom Digital Neurotherapeutics Market Volume (Million) Forecast, by Application 2019 & 2032
- Table 37: France Digital Neurotherapeutics Market Revenue (Million) Forecast, by Application 2019 & 2032
- Table 38: France Digital Neurotherapeutics Market Volume (Million) Forecast, by Application 2019 & 2032
- Table 39: Italy Digital Neurotherapeutics Market Revenue (Million) Forecast, by Application 2019 & 2032
- Table 40: Italy Digital Neurotherapeutics Market Volume (Million) Forecast, by Application 2019 & 2032
- Table 41: Spain Digital Neurotherapeutics Market Revenue (Million) Forecast, by Application 2019 & 2032
- Table 42: Spain Digital Neurotherapeutics Market Volume (Million) Forecast, by Application 2019 & 2032
- Table 43: Rest of Europe Digital Neurotherapeutics Market Revenue (Million) Forecast, by Application 2019 & 2032
- Table 44: Rest of Europe Digital Neurotherapeutics Market Volume (Million) Forecast, by Application 2019 & 2032
- Table 45: Global Digital Neurotherapeutics Market Revenue Million Forecast, by Component 2019 & 2032
- Table 46: Global Digital Neurotherapeutics Market Volume Million Forecast, by Component 2019 & 2032
- Table 47: Global Digital Neurotherapeutics Market Revenue Million Forecast, by Indication 2019 & 2032
- Table 48: Global Digital Neurotherapeutics Market Volume Million Forecast, by Indication 2019 & 2032
- Table 49: Global Digital Neurotherapeutics Market Revenue Million Forecast, by End User 2019 & 2032
- Table 50: Global Digital Neurotherapeutics Market Volume Million Forecast, by End User 2019 & 2032
- Table 51: Global Digital Neurotherapeutics Market Revenue Million Forecast, by Country 2019 & 2032
- Table 52: Global Digital Neurotherapeutics Market Volume Million Forecast, by Country 2019 & 2032
- Table 53: China Digital Neurotherapeutics Market Revenue (Million) Forecast, by Application 2019 & 2032
- Table 54: China Digital Neurotherapeutics Market Volume (Million) Forecast, by Application 2019 & 2032
- Table 55: Japan Digital Neurotherapeutics Market Revenue (Million) Forecast, by Application 2019 & 2032
- Table 56: Japan Digital Neurotherapeutics Market Volume (Million) Forecast, by Application 2019 & 2032
- Table 57: India Digital Neurotherapeutics Market Revenue (Million) Forecast, by Application 2019 & 2032
- Table 58: India Digital Neurotherapeutics Market Volume (Million) Forecast, by Application 2019 & 2032
- Table 59: Australia Digital Neurotherapeutics Market Revenue (Million) Forecast, by Application 2019 & 2032
- Table 60: Australia Digital Neurotherapeutics Market Volume (Million) Forecast, by Application 2019 & 2032
- Table 61: South Korea Digital Neurotherapeutics Market Revenue (Million) Forecast, by Application 2019 & 2032
- Table 62: South Korea Digital Neurotherapeutics Market Volume (Million) Forecast, by Application 2019 & 2032
- Table 63: Rest of Asia Pacific Digital Neurotherapeutics Market Revenue (Million) Forecast, by Application 2019 & 2032
- Table 64: Rest of Asia Pacific Digital Neurotherapeutics Market Volume (Million) Forecast, by Application 2019 & 2032
- Table 65: Global Digital Neurotherapeutics Market Revenue Million Forecast, by Component 2019 & 2032
- Table 66: Global Digital Neurotherapeutics Market Volume Million Forecast, by Component 2019 & 2032
- Table 67: Global Digital Neurotherapeutics Market Revenue Million Forecast, by Indication 2019 & 2032
- Table 68: Global Digital Neurotherapeutics Market Volume Million Forecast, by Indication 2019 & 2032
- Table 69: Global Digital Neurotherapeutics Market Revenue Million Forecast, by End User 2019 & 2032
- Table 70: Global Digital Neurotherapeutics Market Volume Million Forecast, by End User 2019 & 2032
- Table 71: Global Digital Neurotherapeutics Market Revenue Million Forecast, by Country 2019 & 2032
- Table 72: Global Digital Neurotherapeutics Market Volume Million Forecast, by Country 2019 & 2032
- Table 73: GCC Digital Neurotherapeutics Market Revenue (Million) Forecast, by Application 2019 & 2032
- Table 74: GCC Digital Neurotherapeutics Market Volume (Million) Forecast, by Application 2019 & 2032
- Table 75: South Africa Digital Neurotherapeutics Market Revenue (Million) Forecast, by Application 2019 & 2032
- Table 76: South Africa Digital Neurotherapeutics Market Volume (Million) Forecast, by Application 2019 & 2032
- Table 77: Rest of Middle East and Africa Digital Neurotherapeutics Market Revenue (Million) Forecast, by Application 2019 & 2032
- Table 78: Rest of Middle East and Africa Digital Neurotherapeutics Market Volume (Million) Forecast, by Application 2019 & 2032
- Table 79: Global Digital Neurotherapeutics Market Revenue Million Forecast, by Component 2019 & 2032
- Table 80: Global Digital Neurotherapeutics Market Volume Million Forecast, by Component 2019 & 2032
- Table 81: Global Digital Neurotherapeutics Market Revenue Million Forecast, by Indication 2019 & 2032
- Table 82: Global Digital Neurotherapeutics Market Volume Million Forecast, by Indication 2019 & 2032
- Table 83: Global Digital Neurotherapeutics Market Revenue Million Forecast, by End User 2019 & 2032
- Table 84: Global Digital Neurotherapeutics Market Volume Million Forecast, by End User 2019 & 2032
- Table 85: Global Digital Neurotherapeutics Market Revenue Million Forecast, by Country 2019 & 2032
- Table 86: Global Digital Neurotherapeutics Market Volume Million Forecast, by Country 2019 & 2032
- Table 87: Brazil Digital Neurotherapeutics Market Revenue (Million) Forecast, by Application 2019 & 2032
- Table 88: Brazil Digital Neurotherapeutics Market Volume (Million) Forecast, by Application 2019 & 2032
- Table 89: Argentina Digital Neurotherapeutics Market Revenue (Million) Forecast, by Application 2019 & 2032
- Table 90: Argentina Digital Neurotherapeutics Market Volume (Million) Forecast, by Application 2019 & 2032
- Table 91: Rest of South America Digital Neurotherapeutics Market Revenue (Million) Forecast, by Application 2019 & 2032
- Table 92: Rest of South America Digital Neurotherapeutics Market Volume (Million) Forecast, by Application 2019 & 2032
Frequently Asked Questions
1. What is the projected Compound Annual Growth Rate (CAGR) of the Digital Neurotherapeutics Market?
The projected CAGR is approximately 19.50%.
2. Which companies are prominent players in the Digital Neurotherapeutics Market?
Key companies in the market include Akili Inc, AdvancedMD Inc, AppliedVR Inc, BigHealth, Blackrock Neurotech, Cognivive Inc, Neofect Co Ltd, Omada Health Inc, Neurotherapeutic Pediatric Therapies Inc, Mindmaze*List Not Exhaustive.
3. What are the main segments of the Digital Neurotherapeutics Market?
The market segments include Component, Indication, End User.
4. Can you provide details about the market size?
The market size is estimated to be USD 362.63 Million as of 2022.
5. What are some drivers contributing to market growth?
Rising Prevalence of Neurological Disorders; Growing Adoption of Digital Technology in Neurology Care.
6. What are the notable trends driving market growth?
The Multiple Sclerosis Segment is Expected to Hold Significant Market Share Over the Forecast Period.
7. Are there any restraints impacting market growth?
Rising Prevalence of Neurological Disorders; Growing Adoption of Digital Technology in Neurology Care.
8. Can you provide examples of recent developments in the market?
February 2024: The University of London's neurotherapeutics group launched the iTalkBetter app. This app provides speech therapy for people with language disorder aphasia, which has been found to improve their ability to talk significantly.
9. What pricing options are available for accessing the report?
Pricing options include single-user, multi-user, and enterprise licenses priced at USD 4750, USD 5250, and USD 8750 respectively.
10. Is the market size provided in terms of value or volume?
The market size is provided in terms of value, measured in Million and volume, measured in Million.
11. Are there any specific market keywords associated with the report?
Yes, the market keyword associated with the report is "Digital Neurotherapeutics Market," which aids in identifying and referencing the specific market segment covered.
12. How do I determine which pricing option suits my needs best?
The pricing options vary based on user requirements and access needs. Individual users may opt for single-user licenses, while businesses requiring broader access may choose multi-user or enterprise licenses for cost-effective access to the report.
13. Are there any additional resources or data provided in the Digital Neurotherapeutics Market report?
While the report offers comprehensive insights, it's advisable to review the specific contents or supplementary materials provided to ascertain if additional resources or data are available.
14. How can I stay updated on further developments or reports in the Digital Neurotherapeutics Market?
To stay informed about further developments, trends, and reports in the Digital Neurotherapeutics Market, consider subscribing to industry newsletters, following relevant companies and organizations, or regularly checking reputable industry news sources and publications.
Methodology
Step 1 - Identification of Relevant Samples Size from Population Database


Step 2 - Approaches for Defining Global Market Size (Value, Volume* & Price*)

Note*: In applicable scenarios
Step 3 - Data Sources
Primary Research
- Web Analytics
- Survey Reports
- Research Institute
- Latest Research Reports
- Opinion Leaders
Secondary Research
- Annual Reports
- White Paper
- Latest Press Release
- Industry Association
- Paid Database
- Investor Presentations

Step 4 - Data Triangulation
Involves using different sources of information in order to increase the validity of a study
These sources are likely to be stakeholders in a program - participants, other researchers, program staff, other community members, and so on.
Then we put all data in single framework & apply various statistical tools to find out the dynamic on the market.
During the analysis stage, feedback from the stakeholder groups would be compared to determine areas of agreement as well as areas of divergence
