

Key Insights
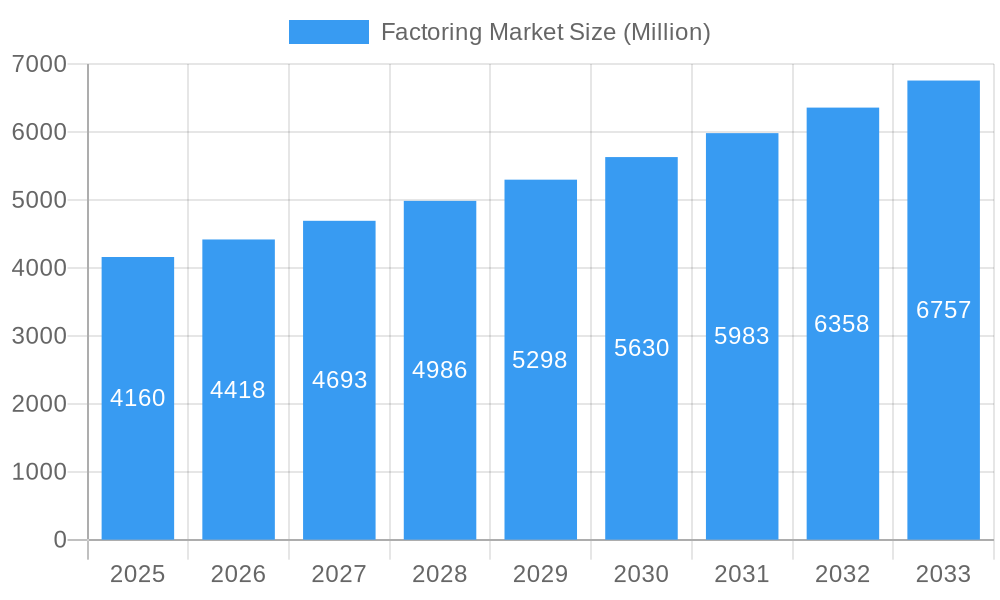
The global factoring market, valued at $4.16 billion in 2025, is projected to experience robust growth, exhibiting a Compound Annual Growth Rate (CAGR) of 6.05% from 2025 to 2033. This expansion is driven by several key factors. The increasing adoption of digital technologies within financial institutions is streamlining processes, reducing costs, and improving efficiency for businesses seeking financing solutions. Furthermore, the growing prevalence of e-commerce and cross-border trade necessitates faster and more reliable payment mechanisms, which factoring effectively provides. Small and medium-sized enterprises (SMEs), often facing challenges securing traditional financing, are increasingly turning to factoring to improve cash flow and facilitate business expansion. The expansion into emerging markets, where access to formal financial services remains limited, presents a substantial opportunity for growth in the factoring sector. Competitive advantages among providers are based on factors like technological sophistication, global reach, and specialized industry expertise. The market also benefits from favorable regulatory environments in certain regions that encourage the use of factoring as a financing option.
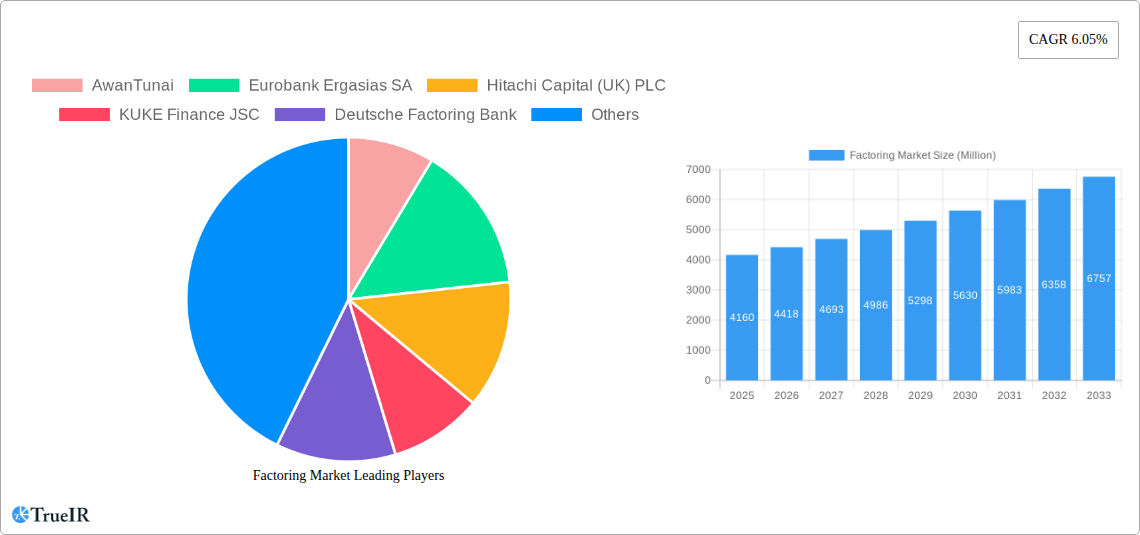
Factoring Market Market Size (In Billion)
However, several challenges persist. Economic downturns and fluctuations in interest rates can impact the demand for factoring services. Credit risk associated with factoring remains a concern, requiring robust risk management strategies by providers. Competition from alternative financing options, such as invoice discounting and peer-to-peer lending, adds pressure on market players to continuously innovate and offer competitive pricing and service packages. Regulatory compliance across various jurisdictions presents a complex landscape for global factoring companies, demanding ongoing adaptation and investment. Despite these challenges, the continued growth of e-commerce, globalization, and the evolving financial needs of SMEs suggest that the factoring market will maintain a positive growth trajectory throughout the forecast period. Key players, such as AwanTunai, Eurobank Ergasias SA, and Hitachi Capital (UK) PLC, are strategically positioned to capitalize on this growth, leveraging technological advancements and expanding their service offerings to retain their competitive edge.
Factoring Market Company Market Share
Factoring Market Report: A Comprehensive Analysis (2019-2033)
This dynamic report provides a deep dive into the Factoring Market, offering invaluable insights for investors, businesses, and industry professionals. With a comprehensive analysis spanning the period 2019-2033, this report leverages extensive data and expert analysis to illuminate current trends and predict future growth. Expect detailed breakdowns of market segments, competitive landscapes, key players, and significant industry milestones. The report utilizes a base year of 2025 and an estimated year of 2025, with a forecast period extending from 2025 to 2033, covering the historical period from 2019 to 2024. Discover the opportunities and challenges shaping this dynamic market and position your organization for success.
Factoring Market Structure & Competitive Landscape
The Factoring Market exhibits a moderately concentrated structure, with a handful of major players commanding significant market share. However, the market is dynamic, influenced by continuous innovation, evolving regulatory landscapes, and the emergence of alternative financial solutions. Mergers and acquisitions (M&A) activity is a significant factor shaping the competitive dynamics. While precise concentration ratios are xx for this report, qualitative analysis suggests a trend toward consolidation among larger players seeking economies of scale and expanded service offerings.
- Market Concentration: xx (Further research required for precise figures)
- Innovation Drivers: Fintech advancements, digitalization of processes, and specialized software solutions driving efficiency and accessibility.
- Regulatory Impacts: Varying regulations across jurisdictions impact market entry and operational costs. xx compliance needs represent a key challenge for smaller players.
- Product Substitutes: Traditional lending, invoice discounting, and alternative financing options pose competitive pressure.
- End-User Segmentation: The market caters to diverse industries, with varying needs and volumes, leading to specialized offerings for different sectors (e.g., SMEs, large corporations).
- M&A Trends: A significant number of M&A activities have been observed recently, with larger institutions acquiring smaller firms to expand their market reach and technological capabilities. The overall volume of M&A deals in the Factoring Market in the past 5 years is estimated at xx Million.
Factoring Market Market Trends & Opportunities
The Factoring Market is experiencing robust growth, driven by factors such as increasing demand for flexible financing solutions among SMEs, advancements in technology, and evolving consumer preferences for faster and more convenient payment options. The market is projected to experience a Compound Annual Growth Rate (CAGR) of xx% during the forecast period (2025-2033), reaching a market size of xx Million by 2033. This growth is fueled by various elements:
- Increased adoption of digital platforms and the use of AI and Machine Learning is streamlining operations, reducing processing times, and enhancing the efficiency of risk assessment.
- The growing preference for faster payment cycles among businesses is creating a significant demand for factoring services, contributing significantly to market growth.
- Expansion into new markets and geographical regions presents lucrative growth opportunities. The penetration rate in developing economies is projected to increase from xx% to xx% by 2033.
- The continuous innovation and introduction of new products and services by existing and emerging players is fostering competition and driving market growth.
- A constantly evolving regulatory environment in various markets presents both challenges and opportunities for market participants.
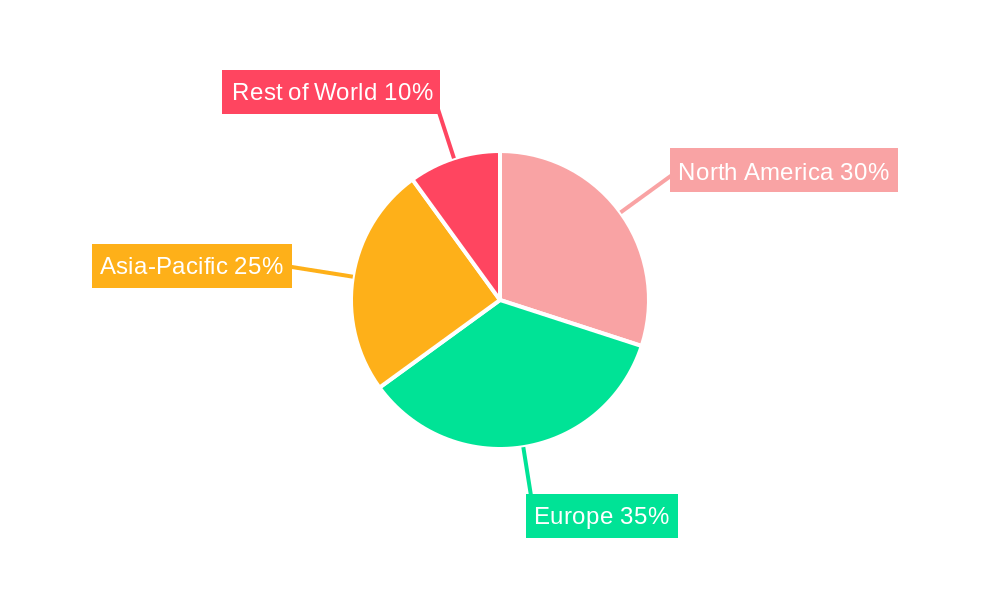
Dominant Markets & Segments in Factoring Market
While precise data on regional dominance requires further research (xx Million for total market value), initial observations suggest North America and Europe hold leading positions in the global Factoring Market. However, significant growth potential exists in Asia-Pacific and other emerging economies.
Key Growth Drivers:
- North America: Strong economic growth, robust SME sector, and advanced financial infrastructure.
- Europe: Well-established financial markets, favorable regulatory frameworks, and a high concentration of large corporations.
- Asia-Pacific: Rapid economic expansion, increasing entrepreneurial activity, and significant government support for SMEs.
Market Dominance Analysis: The dominance of specific regions is mainly driven by factors like economic growth, regulatory environment, and the level of financial development. More detailed analysis is needed to pinpoint precise market share for each region.
Factoring Market Product Analysis
Technological advancements are significantly reshaping the Factoring Market. The integration of AI and machine learning algorithms facilitates faster processing, improved risk assessment, and enhanced customer experience. Cloud-based solutions and mobile applications are boosting accessibility and convenience, while blockchain technology promises greater transparency and security. The market sees a move towards tailored products catering to specific industry needs, offering competitive advantages in terms of speed, cost, and ease of use.
Key Drivers, Barriers & Challenges in Factoring Market
Key Drivers: The increasing need for working capital among businesses, especially SMEs, coupled with technological advancements and shifting consumer preferences for swift payment options, are major drivers of market growth. Government initiatives aimed at supporting small businesses also contribute significantly.
Challenges & Restraints: Regulatory complexity, especially in cross-border transactions, can hinder growth. Supply chain disruptions and economic downturns impact demand, and intense competition among established players creates pressure on margins. The total cost of compliance with various regulations across regions is estimated to be xx Million annually.
Growth Drivers in the Factoring Market Market
Technological innovation remains a crucial driver, with fintech solutions streamlining processes and enhancing efficiency. Government policies supporting SME growth and economic expansion contribute significantly. The growing prevalence of e-commerce and the increased need for swift payment cycles further fuel market expansion.
Challenges Impacting Factoring Market Growth
Stringent regulatory frameworks and evolving compliance requirements impose significant costs and complexity. Economic downturns and supply chain disruptions create uncertainty and reduce demand. Intense competition from traditional banks and emerging fintech firms exerts pressure on pricing and profitability.
Key Players Shaping the Factoring Market Market
- AwanTunai
- Eurobank Ergasias SA
- Hitachi Capital (UK) PLC
- KUKE Finance JSC
- Deutsche Factoring Bank
- Deutsche Factoring Bank
- Barclays PLC
- BNP Paribas
- Mizuho Financial Group Inc
- RTS Financial Service Inc
- *List Not Exhaustive
Significant Factoring Market Industry Milestones
- November 2023: Eurobank's investment in Plum Fintech signals the increasing integration of fintech in the factoring sector.
- January 2023: The GE and KUKE partnership highlights the role of export credit agencies in supporting large-scale projects and demonstrates the growing importance of sustainable energy financing.
- October 2022: BNP Paribas' acquisition of Kantox reflects the growing trend of banks integrating fintech solutions to enhance their service offerings.
Future Outlook for Factoring Market Market
The Factoring Market is poised for continued expansion, driven by ongoing technological advancements, supportive government policies, and a growing demand for efficient financing solutions across diverse industries. Strategic partnerships and M&A activity will reshape the competitive landscape. The market is expected to reach xx Million by 2033, presenting significant growth opportunities for both established players and new entrants.
Factoring Market Segmentation
-
1. Provider
- 1.1. Banks
- 1.2. NBFCs
-
2. Enterprise Size
- 2.1. Large Enterprises
- 2.2. SMEs
-
3. Application
- 3.1. Domestic
- 3.2. International
-
4. End User
- 4.1. Construction
- 4.2. Manufacturing
- 4.3. Healthcare
- 4.4. Transportation and Logistics
- 4.5. Energy and Utilities
- 4.6. IT and Telecom
- 4.7. Staffing
- 4.8. Other En
Factoring Market Segmentation By Geography
-
1. North America
- 1.1. United States
- 1.2. Canada
- 1.3. Mexico
-
2. South America
- 2.1. Brazil
- 2.2. Argentina
- 2.3. Rest of South America
-
3. Europe
- 3.1. United Kingdom
- 3.2. Germany
- 3.3. France
- 3.4. Italy
- 3.5. Spain
- 3.6. Russia
- 3.7. Benelux
- 3.8. Nordics
- 3.9. Rest of Europe
-
4. Middle East & Africa
- 4.1. Turkey
- 4.2. Israel
- 4.3. GCC
- 4.4. North Africa
- 4.5. South Africa
- 4.6. Rest of Middle East & Africa
-
5. Asia Pacific
- 5.1. China
- 5.2. India
- 5.3. Japan
- 5.4. South Korea
- 5.5. ASEAN
- 5.6. Oceania
- 5.7. Rest of Asia Pacific
Factoring Market Regional Market Share
Geographic Coverage of Factoring Market
Factoring Market REPORT HIGHLIGHTS
| Aspects | Details |
|---|---|
| Study Period | 2020-2034 |
| Base Year | 2025 |
| Estimated Year | 2026 |
| Forecast Period | 2026-2034 |
| Historical Period | 2020-2025 |
| Growth Rate | CAGR of 6.05% from 2020-2034 |
| Segmentation |
|
Table of Contents
- 1. Introduction
- 1.1. Research Scope
- 1.2. Market Segmentation
- 1.3. Research Methodology
- 1.4. Definitions and Assumptions
- 2. Executive Summary
- 2.1. Introduction
- 3. Market Dynamics
- 3.1. Introduction
- 3.2. Market Drivers
- 3.2.1. Rising Adoption of Fintech Among SMEs is Driving Market Growth; Rising International Trade and Digitalization are Driving Market Growth
- 3.3. Market Restrains
- 3.3.1. Rising Adoption of Fintech Among SMEs is Driving Market Growth; Rising International Trade and Digitalization are Driving Market Growth
- 3.4. Market Trends
- 3.4.1. Banks have the Largest Market Share in the Factoring Market
- 4. Market Factor Analysis
- 4.1. Porters Five Forces
- 4.2. Supply/Value Chain
- 4.3. PESTEL analysis
- 4.4. Market Entropy
- 4.5. Patent/Trademark Analysis
- 5. Global Factoring Market Analysis, Insights and Forecast, 2020-2032
- 5.1. Market Analysis, Insights and Forecast - by Provider
- 5.1.1. Banks
- 5.1.2. NBFCs
- 5.2. Market Analysis, Insights and Forecast - by Enterprise Size
- 5.2.1. Large Enterprises
- 5.2.2. SMEs
- 5.3. Market Analysis, Insights and Forecast - by Application
- 5.3.1. Domestic
- 5.3.2. International
- 5.4. Market Analysis, Insights and Forecast - by End User
- 5.4.1. Construction
- 5.4.2. Manufacturing
- 5.4.3. Healthcare
- 5.4.4. Transportation and Logistics
- 5.4.5. Energy and Utilities
- 5.4.6. IT and Telecom
- 5.4.7. Staffing
- 5.4.8. Other En
- 5.5. Market Analysis, Insights and Forecast - by Region
- 5.5.1. North America
- 5.5.2. South America
- 5.5.3. Europe
- 5.5.4. Middle East & Africa
- 5.5.5. Asia Pacific
- 5.1. Market Analysis, Insights and Forecast - by Provider
- 6. North America Factoring Market Analysis, Insights and Forecast, 2020-2032
- 6.1. Market Analysis, Insights and Forecast - by Provider
- 6.1.1. Banks
- 6.1.2. NBFCs
- 6.2. Market Analysis, Insights and Forecast - by Enterprise Size
- 6.2.1. Large Enterprises
- 6.2.2. SMEs
- 6.3. Market Analysis, Insights and Forecast - by Application
- 6.3.1. Domestic
- 6.3.2. International
- 6.4. Market Analysis, Insights and Forecast - by End User
- 6.4.1. Construction
- 6.4.2. Manufacturing
- 6.4.3. Healthcare
- 6.4.4. Transportation and Logistics
- 6.4.5. Energy and Utilities
- 6.4.6. IT and Telecom
- 6.4.7. Staffing
- 6.4.8. Other En
- 6.1. Market Analysis, Insights and Forecast - by Provider
- 7. South America Factoring Market Analysis, Insights and Forecast, 2020-2032
- 7.1. Market Analysis, Insights and Forecast - by Provider
- 7.1.1. Banks
- 7.1.2. NBFCs
- 7.2. Market Analysis, Insights and Forecast - by Enterprise Size
- 7.2.1. Large Enterprises
- 7.2.2. SMEs
- 7.3. Market Analysis, Insights and Forecast - by Application
- 7.3.1. Domestic
- 7.3.2. International
- 7.4. Market Analysis, Insights and Forecast - by End User
- 7.4.1. Construction
- 7.4.2. Manufacturing
- 7.4.3. Healthcare
- 7.4.4. Transportation and Logistics
- 7.4.5. Energy and Utilities
- 7.4.6. IT and Telecom
- 7.4.7. Staffing
- 7.4.8. Other En
- 7.1. Market Analysis, Insights and Forecast - by Provider
- 8. Europe Factoring Market Analysis, Insights and Forecast, 2020-2032
- 8.1. Market Analysis, Insights and Forecast - by Provider
- 8.1.1. Banks
- 8.1.2. NBFCs
- 8.2. Market Analysis, Insights and Forecast - by Enterprise Size
- 8.2.1. Large Enterprises
- 8.2.2. SMEs
- 8.3. Market Analysis, Insights and Forecast - by Application
- 8.3.1. Domestic
- 8.3.2. International
- 8.4. Market Analysis, Insights and Forecast - by End User
- 8.4.1. Construction
- 8.4.2. Manufacturing
- 8.4.3. Healthcare
- 8.4.4. Transportation and Logistics
- 8.4.5. Energy and Utilities
- 8.4.6. IT and Telecom
- 8.4.7. Staffing
- 8.4.8. Other En
- 8.1. Market Analysis, Insights and Forecast - by Provider
- 9. Middle East & Africa Factoring Market Analysis, Insights and Forecast, 2020-2032
- 9.1. Market Analysis, Insights and Forecast - by Provider
- 9.1.1. Banks
- 9.1.2. NBFCs
- 9.2. Market Analysis, Insights and Forecast - by Enterprise Size
- 9.2.1. Large Enterprises
- 9.2.2. SMEs
- 9.3. Market Analysis, Insights and Forecast - by Application
- 9.3.1. Domestic
- 9.3.2. International
- 9.4. Market Analysis, Insights and Forecast - by End User
- 9.4.1. Construction
- 9.4.2. Manufacturing
- 9.4.3. Healthcare
- 9.4.4. Transportation and Logistics
- 9.4.5. Energy and Utilities
- 9.4.6. IT and Telecom
- 9.4.7. Staffing
- 9.4.8. Other En
- 9.1. Market Analysis, Insights and Forecast - by Provider
- 10. Asia Pacific Factoring Market Analysis, Insights and Forecast, 2020-2032
- 10.1. Market Analysis, Insights and Forecast - by Provider
- 10.1.1. Banks
- 10.1.2. NBFCs
- 10.2. Market Analysis, Insights and Forecast - by Enterprise Size
- 10.2.1. Large Enterprises
- 10.2.2. SMEs
- 10.3. Market Analysis, Insights and Forecast - by Application
- 10.3.1. Domestic
- 10.3.2. International
- 10.4. Market Analysis, Insights and Forecast - by End User
- 10.4.1. Construction
- 10.4.2. Manufacturing
- 10.4.3. Healthcare
- 10.4.4. Transportation and Logistics
- 10.4.5. Energy and Utilities
- 10.4.6. IT and Telecom
- 10.4.7. Staffing
- 10.4.8. Other En
- 10.1. Market Analysis, Insights and Forecast - by Provider
- 11. Competitive Analysis
- 11.1. Global Market Share Analysis 2025
- 11.2. Company Profiles
- 11.2.1 AwanTunai
- 11.2.1.1. Overview
- 11.2.1.2. Products
- 11.2.1.3. SWOT Analysis
- 11.2.1.4. Recent Developments
- 11.2.1.5. Financials (Based on Availability)
- 11.2.2 Eurobank Ergasias SA
- 11.2.2.1. Overview
- 11.2.2.2. Products
- 11.2.2.3. SWOT Analysis
- 11.2.2.4. Recent Developments
- 11.2.2.5. Financials (Based on Availability)
- 11.2.3 Hitachi Capital (UK) PLC
- 11.2.3.1. Overview
- 11.2.3.2. Products
- 11.2.3.3. SWOT Analysis
- 11.2.3.4. Recent Developments
- 11.2.3.5. Financials (Based on Availability)
- 11.2.4 KUKE Finance JSC
- 11.2.4.1. Overview
- 11.2.4.2. Products
- 11.2.4.3. SWOT Analysis
- 11.2.4.4. Recent Developments
- 11.2.4.5. Financials (Based on Availability)
- 11.2.5 Deutsche Factoring Bank
- 11.2.5.1. Overview
- 11.2.5.2. Products
- 11.2.5.3. SWOT Analysis
- 11.2.5.4. Recent Developments
- 11.2.5.5. Financials (Based on Availability)
- 11.2.6 Deutsche Factoring Bank
- 11.2.6.1. Overview
- 11.2.6.2. Products
- 11.2.6.3. SWOT Analysis
- 11.2.6.4. Recent Developments
- 11.2.6.5. Financials (Based on Availability)
- 11.2.7 Barclays PLC
- 11.2.7.1. Overview
- 11.2.7.2. Products
- 11.2.7.3. SWOT Analysis
- 11.2.7.4. Recent Developments
- 11.2.7.5. Financials (Based on Availability)
- 11.2.8 BNP Paribas
- 11.2.8.1. Overview
- 11.2.8.2. Products
- 11.2.8.3. SWOT Analysis
- 11.2.8.4. Recent Developments
- 11.2.8.5. Financials (Based on Availability)
- 11.2.9 Mizuho Financial Group Inc
- 11.2.9.1. Overview
- 11.2.9.2. Products
- 11.2.9.3. SWOT Analysis
- 11.2.9.4. Recent Developments
- 11.2.9.5. Financials (Based on Availability)
- 11.2.10 RTS Financial Service Inc *List Not Exhaustive
- 11.2.10.1. Overview
- 11.2.10.2. Products
- 11.2.10.3. SWOT Analysis
- 11.2.10.4. Recent Developments
- 11.2.10.5. Financials (Based on Availability)
- 11.2.1 AwanTunai
List of Figures
- Figure 1: Global Factoring Market Revenue Breakdown (Million, %) by Region 2025 & 2033
- Figure 2: Global Factoring Market Volume Breakdown (Trillion, %) by Region 2025 & 2033
- Figure 3: North America Factoring Market Revenue (Million), by Provider 2025 & 2033
- Figure 4: North America Factoring Market Volume (Trillion), by Provider 2025 & 2033
- Figure 5: North America Factoring Market Revenue Share (%), by Provider 2025 & 2033
- Figure 6: North America Factoring Market Volume Share (%), by Provider 2025 & 2033
- Figure 7: North America Factoring Market Revenue (Million), by Enterprise Size 2025 & 2033
- Figure 8: North America Factoring Market Volume (Trillion), by Enterprise Size 2025 & 2033
- Figure 9: North America Factoring Market Revenue Share (%), by Enterprise Size 2025 & 2033
- Figure 10: North America Factoring Market Volume Share (%), by Enterprise Size 2025 & 2033
- Figure 11: North America Factoring Market Revenue (Million), by Application 2025 & 2033
- Figure 12: North America Factoring Market Volume (Trillion), by Application 2025 & 2033
- Figure 13: North America Factoring Market Revenue Share (%), by Application 2025 & 2033
- Figure 14: North America Factoring Market Volume Share (%), by Application 2025 & 2033
- Figure 15: North America Factoring Market Revenue (Million), by End User 2025 & 2033
- Figure 16: North America Factoring Market Volume (Trillion), by End User 2025 & 2033
- Figure 17: North America Factoring Market Revenue Share (%), by End User 2025 & 2033
- Figure 18: North America Factoring Market Volume Share (%), by End User 2025 & 2033
- Figure 19: North America Factoring Market Revenue (Million), by Country 2025 & 2033
- Figure 20: North America Factoring Market Volume (Trillion), by Country 2025 & 2033
- Figure 21: North America Factoring Market Revenue Share (%), by Country 2025 & 2033
- Figure 22: North America Factoring Market Volume Share (%), by Country 2025 & 2033
- Figure 23: South America Factoring Market Revenue (Million), by Provider 2025 & 2033
- Figure 24: South America Factoring Market Volume (Trillion), by Provider 2025 & 2033
- Figure 25: South America Factoring Market Revenue Share (%), by Provider 2025 & 2033
- Figure 26: South America Factoring Market Volume Share (%), by Provider 2025 & 2033
- Figure 27: South America Factoring Market Revenue (Million), by Enterprise Size 2025 & 2033
- Figure 28: South America Factoring Market Volume (Trillion), by Enterprise Size 2025 & 2033
- Figure 29: South America Factoring Market Revenue Share (%), by Enterprise Size 2025 & 2033
- Figure 30: South America Factoring Market Volume Share (%), by Enterprise Size 2025 & 2033
- Figure 31: South America Factoring Market Revenue (Million), by Application 2025 & 2033
- Figure 32: South America Factoring Market Volume (Trillion), by Application 2025 & 2033
- Figure 33: South America Factoring Market Revenue Share (%), by Application 2025 & 2033
- Figure 34: South America Factoring Market Volume Share (%), by Application 2025 & 2033
- Figure 35: South America Factoring Market Revenue (Million), by End User 2025 & 2033
- Figure 36: South America Factoring Market Volume (Trillion), by End User 2025 & 2033
- Figure 37: South America Factoring Market Revenue Share (%), by End User 2025 & 2033
- Figure 38: South America Factoring Market Volume Share (%), by End User 2025 & 2033
- Figure 39: South America Factoring Market Revenue (Million), by Country 2025 & 2033
- Figure 40: South America Factoring Market Volume (Trillion), by Country 2025 & 2033
- Figure 41: South America Factoring Market Revenue Share (%), by Country 2025 & 2033
- Figure 42: South America Factoring Market Volume Share (%), by Country 2025 & 2033
- Figure 43: Europe Factoring Market Revenue (Million), by Provider 2025 & 2033
- Figure 44: Europe Factoring Market Volume (Trillion), by Provider 2025 & 2033
- Figure 45: Europe Factoring Market Revenue Share (%), by Provider 2025 & 2033
- Figure 46: Europe Factoring Market Volume Share (%), by Provider 2025 & 2033
- Figure 47: Europe Factoring Market Revenue (Million), by Enterprise Size 2025 & 2033
- Figure 48: Europe Factoring Market Volume (Trillion), by Enterprise Size 2025 & 2033
- Figure 49: Europe Factoring Market Revenue Share (%), by Enterprise Size 2025 & 2033
- Figure 50: Europe Factoring Market Volume Share (%), by Enterprise Size 2025 & 2033
- Figure 51: Europe Factoring Market Revenue (Million), by Application 2025 & 2033
- Figure 52: Europe Factoring Market Volume (Trillion), by Application 2025 & 2033
- Figure 53: Europe Factoring Market Revenue Share (%), by Application 2025 & 2033
- Figure 54: Europe Factoring Market Volume Share (%), by Application 2025 & 2033
- Figure 55: Europe Factoring Market Revenue (Million), by End User 2025 & 2033
- Figure 56: Europe Factoring Market Volume (Trillion), by End User 2025 & 2033
- Figure 57: Europe Factoring Market Revenue Share (%), by End User 2025 & 2033
- Figure 58: Europe Factoring Market Volume Share (%), by End User 2025 & 2033
- Figure 59: Europe Factoring Market Revenue (Million), by Country 2025 & 2033
- Figure 60: Europe Factoring Market Volume (Trillion), by Country 2025 & 2033
- Figure 61: Europe Factoring Market Revenue Share (%), by Country 2025 & 2033
- Figure 62: Europe Factoring Market Volume Share (%), by Country 2025 & 2033
- Figure 63: Middle East & Africa Factoring Market Revenue (Million), by Provider 2025 & 2033
- Figure 64: Middle East & Africa Factoring Market Volume (Trillion), by Provider 2025 & 2033
- Figure 65: Middle East & Africa Factoring Market Revenue Share (%), by Provider 2025 & 2033
- Figure 66: Middle East & Africa Factoring Market Volume Share (%), by Provider 2025 & 2033
- Figure 67: Middle East & Africa Factoring Market Revenue (Million), by Enterprise Size 2025 & 2033
- Figure 68: Middle East & Africa Factoring Market Volume (Trillion), by Enterprise Size 2025 & 2033
- Figure 69: Middle East & Africa Factoring Market Revenue Share (%), by Enterprise Size 2025 & 2033
- Figure 70: Middle East & Africa Factoring Market Volume Share (%), by Enterprise Size 2025 & 2033
- Figure 71: Middle East & Africa Factoring Market Revenue (Million), by Application 2025 & 2033
- Figure 72: Middle East & Africa Factoring Market Volume (Trillion), by Application 2025 & 2033
- Figure 73: Middle East & Africa Factoring Market Revenue Share (%), by Application 2025 & 2033
- Figure 74: Middle East & Africa Factoring Market Volume Share (%), by Application 2025 & 2033
- Figure 75: Middle East & Africa Factoring Market Revenue (Million), by End User 2025 & 2033
- Figure 76: Middle East & Africa Factoring Market Volume (Trillion), by End User 2025 & 2033
- Figure 77: Middle East & Africa Factoring Market Revenue Share (%), by End User 2025 & 2033
- Figure 78: Middle East & Africa Factoring Market Volume Share (%), by End User 2025 & 2033
- Figure 79: Middle East & Africa Factoring Market Revenue (Million), by Country 2025 & 2033
- Figure 80: Middle East & Africa Factoring Market Volume (Trillion), by Country 2025 & 2033
- Figure 81: Middle East & Africa Factoring Market Revenue Share (%), by Country 2025 & 2033
- Figure 82: Middle East & Africa Factoring Market Volume Share (%), by Country 2025 & 2033
- Figure 83: Asia Pacific Factoring Market Revenue (Million), by Provider 2025 & 2033
- Figure 84: Asia Pacific Factoring Market Volume (Trillion), by Provider 2025 & 2033
- Figure 85: Asia Pacific Factoring Market Revenue Share (%), by Provider 2025 & 2033
- Figure 86: Asia Pacific Factoring Market Volume Share (%), by Provider 2025 & 2033
- Figure 87: Asia Pacific Factoring Market Revenue (Million), by Enterprise Size 2025 & 2033
- Figure 88: Asia Pacific Factoring Market Volume (Trillion), by Enterprise Size 2025 & 2033
- Figure 89: Asia Pacific Factoring Market Revenue Share (%), by Enterprise Size 2025 & 2033
- Figure 90: Asia Pacific Factoring Market Volume Share (%), by Enterprise Size 2025 & 2033
- Figure 91: Asia Pacific Factoring Market Revenue (Million), by Application 2025 & 2033
- Figure 92: Asia Pacific Factoring Market Volume (Trillion), by Application 2025 & 2033
- Figure 93: Asia Pacific Factoring Market Revenue Share (%), by Application 2025 & 2033
- Figure 94: Asia Pacific Factoring Market Volume Share (%), by Application 2025 & 2033
- Figure 95: Asia Pacific Factoring Market Revenue (Million), by End User 2025 & 2033
- Figure 96: Asia Pacific Factoring Market Volume (Trillion), by End User 2025 & 2033
- Figure 97: Asia Pacific Factoring Market Revenue Share (%), by End User 2025 & 2033
- Figure 98: Asia Pacific Factoring Market Volume Share (%), by End User 2025 & 2033
- Figure 99: Asia Pacific Factoring Market Revenue (Million), by Country 2025 & 2033
- Figure 100: Asia Pacific Factoring Market Volume (Trillion), by Country 2025 & 2033
- Figure 101: Asia Pacific Factoring Market Revenue Share (%), by Country 2025 & 2033
- Figure 102: Asia Pacific Factoring Market Volume Share (%), by Country 2025 & 2033
List of Tables
- Table 1: Global Factoring Market Revenue Million Forecast, by Provider 2020 & 2033
- Table 2: Global Factoring Market Volume Trillion Forecast, by Provider 2020 & 2033
- Table 3: Global Factoring Market Revenue Million Forecast, by Enterprise Size 2020 & 2033
- Table 4: Global Factoring Market Volume Trillion Forecast, by Enterprise Size 2020 & 2033
- Table 5: Global Factoring Market Revenue Million Forecast, by Application 2020 & 2033
- Table 6: Global Factoring Market Volume Trillion Forecast, by Application 2020 & 2033
- Table 7: Global Factoring Market Revenue Million Forecast, by End User 2020 & 2033
- Table 8: Global Factoring Market Volume Trillion Forecast, by End User 2020 & 2033
- Table 9: Global Factoring Market Revenue Million Forecast, by Region 2020 & 2033
- Table 10: Global Factoring Market Volume Trillion Forecast, by Region 2020 & 2033
- Table 11: Global Factoring Market Revenue Million Forecast, by Provider 2020 & 2033
- Table 12: Global Factoring Market Volume Trillion Forecast, by Provider 2020 & 2033
- Table 13: Global Factoring Market Revenue Million Forecast, by Enterprise Size 2020 & 2033
- Table 14: Global Factoring Market Volume Trillion Forecast, by Enterprise Size 2020 & 2033
- Table 15: Global Factoring Market Revenue Million Forecast, by Application 2020 & 2033
- Table 16: Global Factoring Market Volume Trillion Forecast, by Application 2020 & 2033
- Table 17: Global Factoring Market Revenue Million Forecast, by End User 2020 & 2033
- Table 18: Global Factoring Market Volume Trillion Forecast, by End User 2020 & 2033
- Table 19: Global Factoring Market Revenue Million Forecast, by Country 2020 & 2033
- Table 20: Global Factoring Market Volume Trillion Forecast, by Country 2020 & 2033
- Table 21: United States Factoring Market Revenue (Million) Forecast, by Application 2020 & 2033
- Table 22: United States Factoring Market Volume (Trillion) Forecast, by Application 2020 & 2033
- Table 23: Canada Factoring Market Revenue (Million) Forecast, by Application 2020 & 2033
- Table 24: Canada Factoring Market Volume (Trillion) Forecast, by Application 2020 & 2033
- Table 25: Mexico Factoring Market Revenue (Million) Forecast, by Application 2020 & 2033
- Table 26: Mexico Factoring Market Volume (Trillion) Forecast, by Application 2020 & 2033
- Table 27: Global Factoring Market Revenue Million Forecast, by Provider 2020 & 2033
- Table 28: Global Factoring Market Volume Trillion Forecast, by Provider 2020 & 2033
- Table 29: Global Factoring Market Revenue Million Forecast, by Enterprise Size 2020 & 2033
- Table 30: Global Factoring Market Volume Trillion Forecast, by Enterprise Size 2020 & 2033
- Table 31: Global Factoring Market Revenue Million Forecast, by Application 2020 & 2033
- Table 32: Global Factoring Market Volume Trillion Forecast, by Application 2020 & 2033
- Table 33: Global Factoring Market Revenue Million Forecast, by End User 2020 & 2033
- Table 34: Global Factoring Market Volume Trillion Forecast, by End User 2020 & 2033
- Table 35: Global Factoring Market Revenue Million Forecast, by Country 2020 & 2033
- Table 36: Global Factoring Market Volume Trillion Forecast, by Country 2020 & 2033
- Table 37: Brazil Factoring Market Revenue (Million) Forecast, by Application 2020 & 2033
- Table 38: Brazil Factoring Market Volume (Trillion) Forecast, by Application 2020 & 2033
- Table 39: Argentina Factoring Market Revenue (Million) Forecast, by Application 2020 & 2033
- Table 40: Argentina Factoring Market Volume (Trillion) Forecast, by Application 2020 & 2033
- Table 41: Rest of South America Factoring Market Revenue (Million) Forecast, by Application 2020 & 2033
- Table 42: Rest of South America Factoring Market Volume (Trillion) Forecast, by Application 2020 & 2033
- Table 43: Global Factoring Market Revenue Million Forecast, by Provider 2020 & 2033
- Table 44: Global Factoring Market Volume Trillion Forecast, by Provider 2020 & 2033
- Table 45: Global Factoring Market Revenue Million Forecast, by Enterprise Size 2020 & 2033
- Table 46: Global Factoring Market Volume Trillion Forecast, by Enterprise Size 2020 & 2033
- Table 47: Global Factoring Market Revenue Million Forecast, by Application 2020 & 2033
- Table 48: Global Factoring Market Volume Trillion Forecast, by Application 2020 & 2033
- Table 49: Global Factoring Market Revenue Million Forecast, by End User 2020 & 2033
- Table 50: Global Factoring Market Volume Trillion Forecast, by End User 2020 & 2033
- Table 51: Global Factoring Market Revenue Million Forecast, by Country 2020 & 2033
- Table 52: Global Factoring Market Volume Trillion Forecast, by Country 2020 & 2033
- Table 53: United Kingdom Factoring Market Revenue (Million) Forecast, by Application 2020 & 2033
- Table 54: United Kingdom Factoring Market Volume (Trillion) Forecast, by Application 2020 & 2033
- Table 55: Germany Factoring Market Revenue (Million) Forecast, by Application 2020 & 2033
- Table 56: Germany Factoring Market Volume (Trillion) Forecast, by Application 2020 & 2033
- Table 57: France Factoring Market Revenue (Million) Forecast, by Application 2020 & 2033
- Table 58: France Factoring Market Volume (Trillion) Forecast, by Application 2020 & 2033
- Table 59: Italy Factoring Market Revenue (Million) Forecast, by Application 2020 & 2033
- Table 60: Italy Factoring Market Volume (Trillion) Forecast, by Application 2020 & 2033
- Table 61: Spain Factoring Market Revenue (Million) Forecast, by Application 2020 & 2033
- Table 62: Spain Factoring Market Volume (Trillion) Forecast, by Application 2020 & 2033
- Table 63: Russia Factoring Market Revenue (Million) Forecast, by Application 2020 & 2033
- Table 64: Russia Factoring Market Volume (Trillion) Forecast, by Application 2020 & 2033
- Table 65: Benelux Factoring Market Revenue (Million) Forecast, by Application 2020 & 2033
- Table 66: Benelux Factoring Market Volume (Trillion) Forecast, by Application 2020 & 2033
- Table 67: Nordics Factoring Market Revenue (Million) Forecast, by Application 2020 & 2033
- Table 68: Nordics Factoring Market Volume (Trillion) Forecast, by Application 2020 & 2033
- Table 69: Rest of Europe Factoring Market Revenue (Million) Forecast, by Application 2020 & 2033
- Table 70: Rest of Europe Factoring Market Volume (Trillion) Forecast, by Application 2020 & 2033
- Table 71: Global Factoring Market Revenue Million Forecast, by Provider 2020 & 2033
- Table 72: Global Factoring Market Volume Trillion Forecast, by Provider 2020 & 2033
- Table 73: Global Factoring Market Revenue Million Forecast, by Enterprise Size 2020 & 2033
- Table 74: Global Factoring Market Volume Trillion Forecast, by Enterprise Size 2020 & 2033
- Table 75: Global Factoring Market Revenue Million Forecast, by Application 2020 & 2033
- Table 76: Global Factoring Market Volume Trillion Forecast, by Application 2020 & 2033
- Table 77: Global Factoring Market Revenue Million Forecast, by End User 2020 & 2033
- Table 78: Global Factoring Market Volume Trillion Forecast, by End User 2020 & 2033
- Table 79: Global Factoring Market Revenue Million Forecast, by Country 2020 & 2033
- Table 80: Global Factoring Market Volume Trillion Forecast, by Country 2020 & 2033
- Table 81: Turkey Factoring Market Revenue (Million) Forecast, by Application 2020 & 2033
- Table 82: Turkey Factoring Market Volume (Trillion) Forecast, by Application 2020 & 2033
- Table 83: Israel Factoring Market Revenue (Million) Forecast, by Application 2020 & 2033
- Table 84: Israel Factoring Market Volume (Trillion) Forecast, by Application 2020 & 2033
- Table 85: GCC Factoring Market Revenue (Million) Forecast, by Application 2020 & 2033
- Table 86: GCC Factoring Market Volume (Trillion) Forecast, by Application 2020 & 2033
- Table 87: North Africa Factoring Market Revenue (Million) Forecast, by Application 2020 & 2033
- Table 88: North Africa Factoring Market Volume (Trillion) Forecast, by Application 2020 & 2033
- Table 89: South Africa Factoring Market Revenue (Million) Forecast, by Application 2020 & 2033
- Table 90: South Africa Factoring Market Volume (Trillion) Forecast, by Application 2020 & 2033
- Table 91: Rest of Middle East & Africa Factoring Market Revenue (Million) Forecast, by Application 2020 & 2033
- Table 92: Rest of Middle East & Africa Factoring Market Volume (Trillion) Forecast, by Application 2020 & 2033
- Table 93: Global Factoring Market Revenue Million Forecast, by Provider 2020 & 2033
- Table 94: Global Factoring Market Volume Trillion Forecast, by Provider 2020 & 2033
- Table 95: Global Factoring Market Revenue Million Forecast, by Enterprise Size 2020 & 2033
- Table 96: Global Factoring Market Volume Trillion Forecast, by Enterprise Size 2020 & 2033
- Table 97: Global Factoring Market Revenue Million Forecast, by Application 2020 & 2033
- Table 98: Global Factoring Market Volume Trillion Forecast, by Application 2020 & 2033
- Table 99: Global Factoring Market Revenue Million Forecast, by End User 2020 & 2033
- Table 100: Global Factoring Market Volume Trillion Forecast, by End User 2020 & 2033
- Table 101: Global Factoring Market Revenue Million Forecast, by Country 2020 & 2033
- Table 102: Global Factoring Market Volume Trillion Forecast, by Country 2020 & 2033
- Table 103: China Factoring Market Revenue (Million) Forecast, by Application 2020 & 2033
- Table 104: China Factoring Market Volume (Trillion) Forecast, by Application 2020 & 2033
- Table 105: India Factoring Market Revenue (Million) Forecast, by Application 2020 & 2033
- Table 106: India Factoring Market Volume (Trillion) Forecast, by Application 2020 & 2033
- Table 107: Japan Factoring Market Revenue (Million) Forecast, by Application 2020 & 2033
- Table 108: Japan Factoring Market Volume (Trillion) Forecast, by Application 2020 & 2033
- Table 109: South Korea Factoring Market Revenue (Million) Forecast, by Application 2020 & 2033
- Table 110: South Korea Factoring Market Volume (Trillion) Forecast, by Application 2020 & 2033
- Table 111: ASEAN Factoring Market Revenue (Million) Forecast, by Application 2020 & 2033
- Table 112: ASEAN Factoring Market Volume (Trillion) Forecast, by Application 2020 & 2033
- Table 113: Oceania Factoring Market Revenue (Million) Forecast, by Application 2020 & 2033
- Table 114: Oceania Factoring Market Volume (Trillion) Forecast, by Application 2020 & 2033
- Table 115: Rest of Asia Pacific Factoring Market Revenue (Million) Forecast, by Application 2020 & 2033
- Table 116: Rest of Asia Pacific Factoring Market Volume (Trillion) Forecast, by Application 2020 & 2033
Frequently Asked Questions
1. What is the projected Compound Annual Growth Rate (CAGR) of the Factoring Market?
The projected CAGR is approximately 6.05%.
2. Which companies are prominent players in the Factoring Market?
Key companies in the market include AwanTunai, Eurobank Ergasias SA, Hitachi Capital (UK) PLC, KUKE Finance JSC, Deutsche Factoring Bank, Deutsche Factoring Bank, Barclays PLC, BNP Paribas, Mizuho Financial Group Inc, RTS Financial Service Inc *List Not Exhaustive.
3. What are the main segments of the Factoring Market?
The market segments include Provider, Enterprise Size, Application, End User.
4. Can you provide details about the market size?
The market size is estimated to be USD 4.16 Million as of 2022.
5. What are some drivers contributing to market growth?
Rising Adoption of Fintech Among SMEs is Driving Market Growth; Rising International Trade and Digitalization are Driving Market Growth.
6. What are the notable trends driving market growth?
Banks have the Largest Market Share in the Factoring Market.
7. Are there any restraints impacting market growth?
Rising Adoption of Fintech Among SMEs is Driving Market Growth; Rising International Trade and Digitalization are Driving Market Growth.
8. Can you provide examples of recent developments in the market?
November 2023 - Eurobank SA ("Eurobank") disclosed its decision to purchase a minority interest in Plum Fintech Limited ("Plum"), an inventive fintech firm situated in the United Kingdom that provides a sophisticated money management application. Per the agreement's conditions, Eurobank will make an initial investment of EUR 5 million (USD 5.33 million) for its share in Plum, with an additional EUR 5 million (USD 5.33 million) to follow, contingent upon the satisfaction of specific requirements, in the future.
9. What pricing options are available for accessing the report?
Pricing options include single-user, multi-user, and enterprise licenses priced at USD 3800, USD 4500, and USD 5800 respectively.
10. Is the market size provided in terms of value or volume?
The market size is provided in terms of value, measured in Million and volume, measured in Trillion.
11. Are there any specific market keywords associated with the report?
Yes, the market keyword associated with the report is "Factoring Market," which aids in identifying and referencing the specific market segment covered.
12. How do I determine which pricing option suits my needs best?
The pricing options vary based on user requirements and access needs. Individual users may opt for single-user licenses, while businesses requiring broader access may choose multi-user or enterprise licenses for cost-effective access to the report.
13. Are there any additional resources or data provided in the Factoring Market report?
While the report offers comprehensive insights, it's advisable to review the specific contents or supplementary materials provided to ascertain if additional resources or data are available.
14. How can I stay updated on further developments or reports in the Factoring Market?
To stay informed about further developments, trends, and reports in the Factoring Market, consider subscribing to industry newsletters, following relevant companies and organizations, or regularly checking reputable industry news sources and publications.
Methodology
Step 1 - Identification of Relevant Samples Size from Population Database


Step 2 - Approaches for Defining Global Market Size (Value, Volume* & Price*)

Note*: In applicable scenarios
Step 3 - Data Sources
Primary Research
- Web Analytics
- Survey Reports
- Research Institute
- Latest Research Reports
- Opinion Leaders
Secondary Research
- Annual Reports
- White Paper
- Latest Press Release
- Industry Association
- Paid Database
- Investor Presentations

Step 4 - Data Triangulation
Involves using different sources of information in order to increase the validity of a study
These sources are likely to be stakeholders in a program - participants, other researchers, program staff, other community members, and so on.
Then we put all data in single framework & apply various statistical tools to find out the dynamic on the market.
During the analysis stage, feedback from the stakeholder groups would be compared to determine areas of agreement as well as areas of divergence