

Key Insights
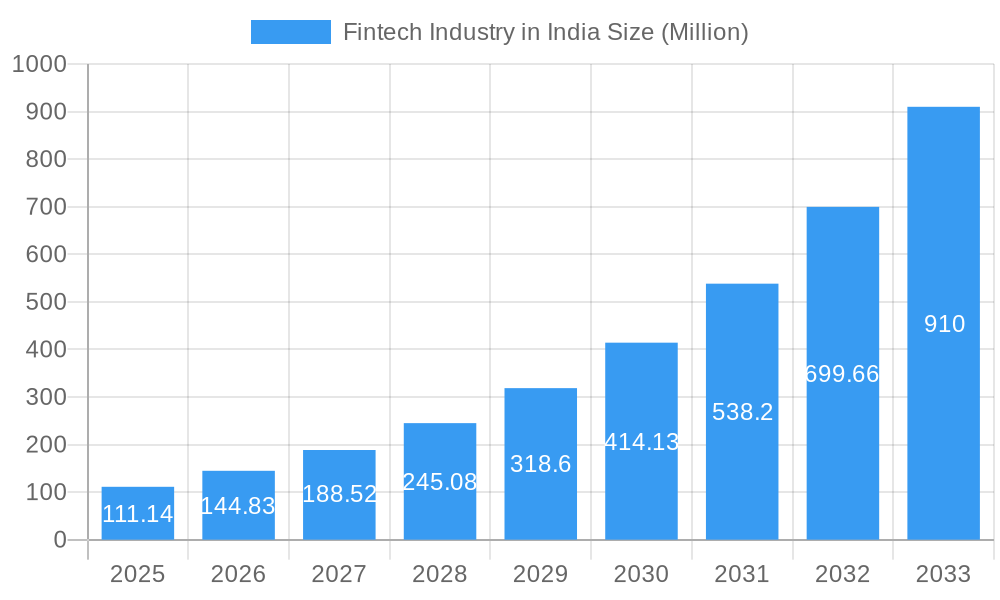
The Indian Fintech market, valued at $111.14 million in 2025, is experiencing explosive growth, projected to expand significantly over the forecast period (2025-2033) at a Compound Annual Growth Rate (CAGR) of 30.55%. This remarkable expansion is driven by several key factors. Firstly, India's burgeoning digital economy and increasing smartphone penetration are creating a fertile ground for Fintech adoption. A young, tech-savvy population readily embraces digital payment solutions and financial services, fueling demand. Secondly, government initiatives promoting digitalization and financial inclusion are further accelerating market growth. Initiatives like Aadhaar-based payments and the push for digital transactions are creating a more inclusive and efficient financial landscape. Thirdly, the increasing availability of affordable internet and mobile data has made Fintech services accessible to a wider population, even in remote areas. Finally, the innovative business models employed by Fintech companies, such as mobile-first solutions and personalized financial advice, are proving highly attractive to consumers.
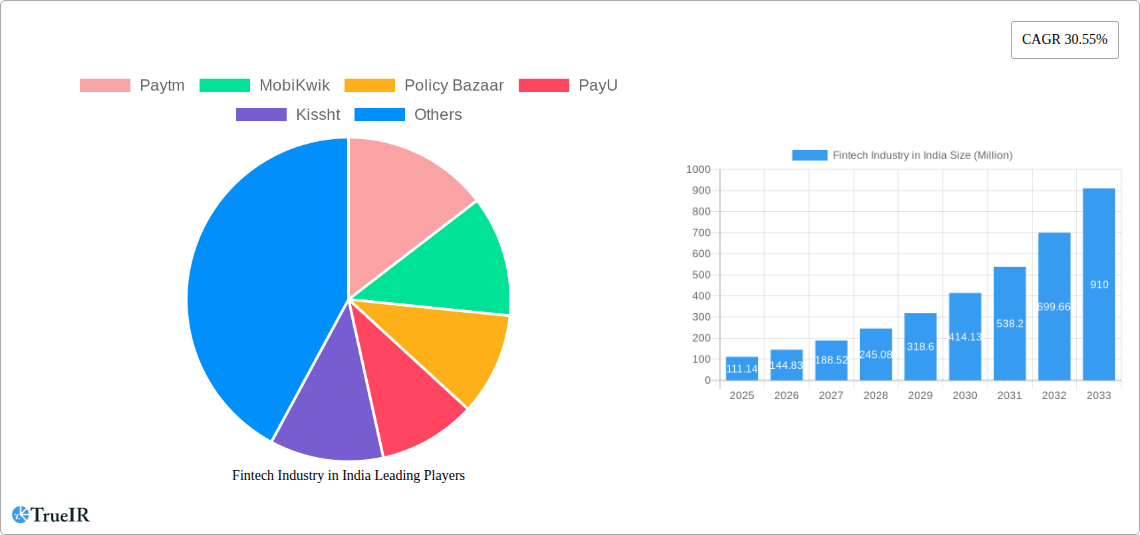
Fintech Industry in India Market Size (In Million)
However, challenges remain. Regulatory hurdles and the need for robust cybersecurity infrastructure are crucial aspects requiring attention. Maintaining consumer trust and addressing concerns about data privacy are also essential for sustainable growth. Competition within the market is intense, with established players like Paytm, PhonePe, and PolicyBazaar vying for market share alongside newer entrants. Despite these challenges, the long-term outlook for the Indian Fintech market remains exceptionally positive, with substantial opportunities for both established players and emerging companies. The market segmentation will likely evolve further, with specialized services catering to niche customer segments emerging in the coming years. The regional distribution of growth will also be a significant factor, with certain areas experiencing faster growth than others due to varying levels of digital penetration and economic development.
Fintech Industry in India Company Market Share
Fintech Industry in India: A Comprehensive Market Report (2019-2033)
This dynamic report provides a deep dive into the burgeoning Fintech industry in India, analyzing its market structure, competitive landscape, growth drivers, and future outlook. The study period covers 2019-2033, with 2025 as the base and estimated year. The forecast period spans 2025-2033, and the historical period encompasses 2019-2024. This report is crucial for investors, entrepreneurs, and industry stakeholders seeking to understand and capitalize on the immense opportunities within the Indian Fintech sector. The market is estimated to be worth xx Million in 2025, with a projected CAGR of xx% from 2025 to 2033.
Fintech Industry in India Market Structure & Competitive Landscape
The Indian Fintech market is characterized by a dynamic interplay of established players and disruptive startups. While market concentration is moderate, with a few dominant players, the landscape is intensely competitive. Innovation is a key driver, fueled by a young, tech-savvy population and increasing smartphone penetration. Regulatory changes, such as the introduction of the Digital Personal Data Protection Bill, significantly impact market dynamics. Product substitutes, particularly traditional banking services, still pose a challenge, while the emergence of open banking offers new opportunities.
The market is segmented by service type (payments, lending, insurance, wealth management etc.), target customer (individual, business), and geographic location. Mergers and acquisitions (M&A) activity is substantial, reflecting consolidation and expansion strategies among players. For example, in November 2022, CRED acquired CreditVidya, although the deal's financial details remain undisclosed. The estimated M&A volume for 2024 was xx Million, suggesting a healthy level of consolidation in the sector. Concentration ratios, while varying across segments, show a trend towards moderate consolidation, with the top 5 players controlling approximately xx% of the market in the payments segment.
- High Market Fragmentation: Despite the presence of large players, many smaller niche players exist.
- Strong Regulatory Influence: RBI guidelines and policy changes heavily influence market operations.
- Rapid Technological Advancements: Continuous innovation in AI, blockchain, and other technologies shapes the industry.
- Increasing Consumer Adoption: Digital financial inclusion is driving substantial growth.
Fintech Industry in India Market Trends & Opportunities
The Indian Fintech market exhibits phenomenal growth, driven by factors such as rising smartphone penetration, increasing internet usage, and government initiatives promoting digital financial inclusion. The market size is projected to reach xx Million by 2033, showing a remarkable CAGR of xx% during the forecast period. This growth is fueled by a shift towards digital payments, the expansion of lending platforms, and the increasing adoption of InsurTech solutions. Consumer preferences are leaning towards user-friendly interfaces, personalized services, and improved security features. The competitive dynamics involve both fierce competition among established players and the constant emergence of innovative startups. Market penetration rates for various Fintech services vary, with digital payments having the highest penetration while wealth management and InsurTech are still at relatively early stages.
Dominant Markets & Segments in Fintech Industry in India
The Indian Fintech market shows strong growth across various regions. However, urban centers and financially literate populations experience higher adoption rates. Key growth drivers include:
- Robust Digital Infrastructure: India's improving digital infrastructure supports the expansion of Fintech services.
- Favorable Government Policies: Government initiatives promoting digital payments and financial inclusion fuel growth.
- Rising Smartphone and Internet Penetration: Increased access to technology empowers a larger user base.
Market dominance is seen in the digital payments segment, led by players like PhonePe and Paytm. The lending segment is also experiencing significant growth, driven by both established financial institutions and innovative Fintech companies. The segments exhibiting the highest growth rates include digital lending and InsurTech.
Fintech Industry in India Product Analysis
Fintech product innovation is rapid, with a focus on improving user experience, enhancing security, and providing personalized financial services. Products ranging from mobile payment apps (Paytm, PhonePe) to digital lending platforms (Kissht, Shubh Loans) and investment apps (ET Money, Faircent) showcase technological advancements that cater to diverse consumer needs. These products' competitive advantages lie in their convenience, speed, and accessibility, catering to India’s growing digital-first consumer base.
Key Drivers, Barriers & Challenges in Fintech Industry in India
Key Drivers:
- Government Initiatives: Digital India and other government programs promote financial inclusion and digital adoption.
- Technological Advancements: AI, machine learning, and blockchain technology enhance service efficiency.
- Rising Mobile and Internet Penetration: Increased accessibility expands the potential customer base.
Challenges:
- Regulatory Uncertainty: Frequent regulatory changes create operational challenges and uncertainty.
- Cybersecurity Threats: Data breaches and fraud remain significant risks, impacting consumer trust.
- Digital Literacy Gap: Uneven digital literacy hinders wider adoption, particularly in rural areas. This gap reduces market penetration by an estimated xx%.
Growth Drivers in the Fintech Industry in India Market
The growth of the Indian Fintech market is primarily driven by increasing digital literacy, substantial smartphone penetration, and supportive government regulations encouraging digital transactions. Technological advancements, particularly in AI and machine learning, are also crucial in improving efficiency and personalization of services. Furthermore, the rising middle class and expanding financial needs fuel the demand for innovative financial solutions.
Challenges Impacting Fintech Industry in India Growth
Challenges include navigating complex regulatory frameworks, addressing cybersecurity risks, and managing the digital literacy gap. Competition from established players and the potential for fraud also pose significant barriers. Supply chain issues impacting technological infrastructure can also temporarily hinder growth.
Significant Fintech Industry in India Industry Milestones
- September 2023: PayU partnered with WhatsApp to enhance the Indian purchasing experience. This partnership is expected to significantly boost transaction volumes for PayU and increase the adoption of digital payments.
- November 2022: CRED acquired CreditVidya, demonstrating consolidation within the credit scoring and lending space. This acquisition signals a move towards a more integrated financial ecosystem in India.
Future Outlook for Fintech Industry in India Market
The Indian Fintech market is poised for continued exponential growth, driven by increasing digital adoption, supportive government policies, and the ongoing development of innovative financial technologies. Strategic opportunities lie in expanding financial inclusion to underserved populations, leveraging AI and machine learning for personalized services, and developing robust cybersecurity measures. The market's potential is immense, and a robust regulatory environment will be crucial to facilitating sustainable growth.
Fintech Industry in India Segmentation
-
1. Service Proposition
- 1.1. Money Transfer and Payments
- 1.2. Savings and Investments
- 1.3. Digital Lending and Lending Marketplaces
- 1.4. Online Insurance and Insurance Marketplaces
-
2. Application
- 2.1. E-Commerce
- 2.2. Utilities
- 2.3. Travel
Fintech Industry in India Segmentation By Geography
-
1. North America
- 1.1. United States
- 1.2. Canada
- 1.3. Mexico
-
2. South America
- 2.1. Brazil
- 2.2. Argentina
- 2.3. Rest of South America
-
3. Europe
- 3.1. United Kingdom
- 3.2. Germany
- 3.3. France
- 3.4. Italy
- 3.5. Spain
- 3.6. Russia
- 3.7. Benelux
- 3.8. Nordics
- 3.9. Rest of Europe
-
4. Middle East & Africa
- 4.1. Turkey
- 4.2. Israel
- 4.3. GCC
- 4.4. North Africa
- 4.5. South Africa
- 4.6. Rest of Middle East & Africa
-
5. Asia Pacific
- 5.1. China
- 5.2. India
- 5.3. Japan
- 5.4. South Korea
- 5.5. ASEAN
- 5.6. Oceania
- 5.7. Rest of Asia Pacific
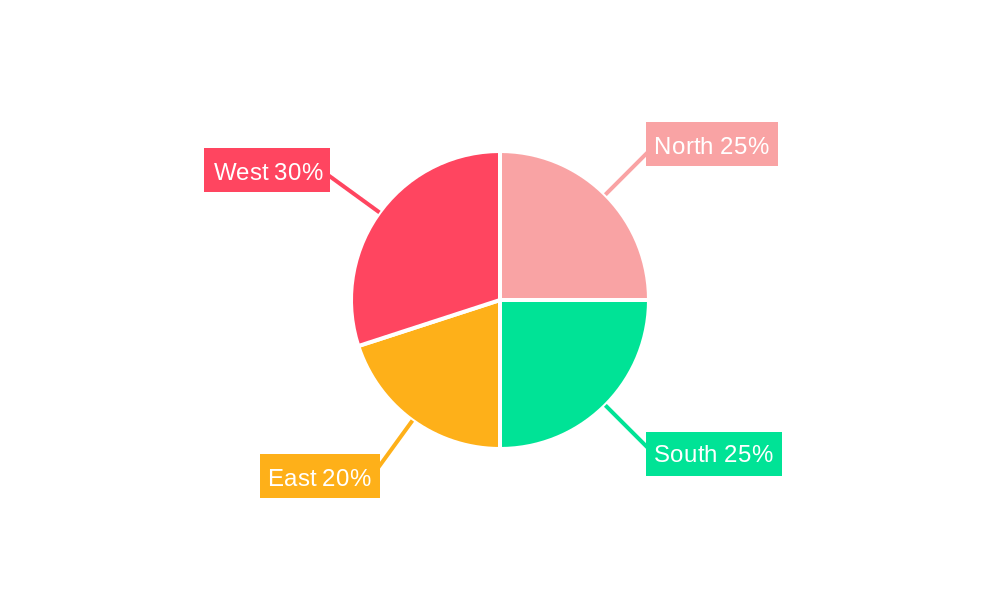
Fintech Industry in India Regional Market Share
Geographic Coverage of Fintech Industry in India
Fintech Industry in India REPORT HIGHLIGHTS
| Aspects | Details |
|---|---|
| Study Period | 2020-2034 |
| Base Year | 2025 |
| Estimated Year | 2026 |
| Forecast Period | 2026-2034 |
| Historical Period | 2020-2025 |
| Growth Rate | CAGR of 30.55% from 2020-2034 |
| Segmentation |
|
Table of Contents
- 1. Introduction
- 1.1. Research Scope
- 1.2. Market Segmentation
- 1.3. Research Objective
- 1.4. Definitions and Assumptions
- 2. Executive Summary
- 2.1. Market Snapshot
- 3. Market Dynamics
- 3.1. Market Drivers
- 3.2. Market Restrains
- 3.3. Market Trends
- 3.4. Market Opportunities
- 4. Market Factor Analysis
- 4.1. Porters Five Forces
- 4.1.1. Bargaining Power of Suppliers
- 4.1.2. Bargaining Power of Buyers
- 4.1.3. Threat of New Entrants
- 4.1.4. Threat of Substitutes
- 4.1.5. Competitive Rivalry
- 4.2. PESTEL analysis
- 4.3. BCG Analysis
- 4.3.1. Stars (High Growth, High Market Share)
- 4.3.2. Cash Cows (Low Growth, High Market Share)
- 4.3.3. Question Mark (High Growth, Low Market Share)
- 4.3.4. Dogs (Low Growth, Low Market Share)
- 4.4. Ansoff Matrix Analysis
- 4.5. Supply Chain Analysis
- 4.6. Regulatory Landscape
- 4.7. Current Market Potential and Opportunity Assessment (TAM–SAM–SOM Framework)
- 4.8. TIR Analyst Note
- 4.1. Porters Five Forces
- 5. Market Analysis, Insights and Forecast 2021-2033
- 5.1. Market Analysis, Insights and Forecast - by Service Proposition
- 5.1.1. Money Transfer and Payments
- 5.1.2. Savings and Investments
- 5.1.3. Digital Lending and Lending Marketplaces
- 5.1.4. Online Insurance and Insurance Marketplaces
- 5.2. Market Analysis, Insights and Forecast - by Application
- 5.2.1. E-Commerce
- 5.2.2. Utilities
- 5.2.3. Travel
- 5.3. Market Analysis, Insights and Forecast - by Region
- 5.3.1. North America
- 5.3.2. South America
- 5.3.3. Europe
- 5.3.4. Middle East & Africa
- 5.3.5. Asia Pacific
- 5.1. Market Analysis, Insights and Forecast - by Service Proposition
- 6. Global Fintech Industry in India Analysis, Insights and Forecast, 2021-2033
- 6.1. Market Analysis, Insights and Forecast - by Service Proposition
- 6.1.1. Money Transfer and Payments
- 6.1.2. Savings and Investments
- 6.1.3. Digital Lending and Lending Marketplaces
- 6.1.4. Online Insurance and Insurance Marketplaces
- 6.2. Market Analysis, Insights and Forecast - by Application
- 6.2.1. E-Commerce
- 6.2.2. Utilities
- 6.2.3. Travel
- 6.1. Market Analysis, Insights and Forecast - by Service Proposition
- 7. North America Fintech Industry in India Analysis, Insights and Forecast, 2020-2032
- 7.1. Market Analysis, Insights and Forecast - by Service Proposition
- 7.1.1. Money Transfer and Payments
- 7.1.2. Savings and Investments
- 7.1.3. Digital Lending and Lending Marketplaces
- 7.1.4. Online Insurance and Insurance Marketplaces
- 7.2. Market Analysis, Insights and Forecast - by Application
- 7.2.1. E-Commerce
- 7.2.2. Utilities
- 7.2.3. Travel
- 7.1. Market Analysis, Insights and Forecast - by Service Proposition
- 8. South America Fintech Industry in India Analysis, Insights and Forecast, 2020-2032
- 8.1. Market Analysis, Insights and Forecast - by Service Proposition
- 8.1.1. Money Transfer and Payments
- 8.1.2. Savings and Investments
- 8.1.3. Digital Lending and Lending Marketplaces
- 8.1.4. Online Insurance and Insurance Marketplaces
- 8.2. Market Analysis, Insights and Forecast - by Application
- 8.2.1. E-Commerce
- 8.2.2. Utilities
- 8.2.3. Travel
- 8.1. Market Analysis, Insights and Forecast - by Service Proposition
- 9. Europe Fintech Industry in India Analysis, Insights and Forecast, 2020-2032
- 9.1. Market Analysis, Insights and Forecast - by Service Proposition
- 9.1.1. Money Transfer and Payments
- 9.1.2. Savings and Investments
- 9.1.3. Digital Lending and Lending Marketplaces
- 9.1.4. Online Insurance and Insurance Marketplaces
- 9.2. Market Analysis, Insights and Forecast - by Application
- 9.2.1. E-Commerce
- 9.2.2. Utilities
- 9.2.3. Travel
- 9.1. Market Analysis, Insights and Forecast - by Service Proposition
- 10. Middle East & Africa Fintech Industry in India Analysis, Insights and Forecast, 2020-2032
- 10.1. Market Analysis, Insights and Forecast - by Service Proposition
- 10.1.1. Money Transfer and Payments
- 10.1.2. Savings and Investments
- 10.1.3. Digital Lending and Lending Marketplaces
- 10.1.4. Online Insurance and Insurance Marketplaces
- 10.2. Market Analysis, Insights and Forecast - by Application
- 10.2.1. E-Commerce
- 10.2.2. Utilities
- 10.2.3. Travel
- 10.1. Market Analysis, Insights and Forecast - by Service Proposition
- 11. Asia Pacific Fintech Industry in India Analysis, Insights and Forecast, 2020-2032
- 11.1. Market Analysis, Insights and Forecast - by Service Proposition
- 11.1.1. Money Transfer and Payments
- 11.1.2. Savings and Investments
- 11.1.3. Digital Lending and Lending Marketplaces
- 11.1.4. Online Insurance and Insurance Marketplaces
- 11.2. Market Analysis, Insights and Forecast - by Application
- 11.2.1. E-Commerce
- 11.2.2. Utilities
- 11.2.3. Travel
- 11.1. Market Analysis, Insights and Forecast - by Service Proposition
- 12. Competitive Analysis
- 12.1. Company Profiles
- 12.1.1 Paytm
- 12.1.1.1. Company Overview
- 12.1.1.2. Products
- 12.1.1.3. Company Financials
- 12.1.1.4. SWOT Analysis
- 12.1.2 MobiKwik
- 12.1.2.1. Company Overview
- 12.1.2.2. Products
- 12.1.2.3. Company Financials
- 12.1.2.4. SWOT Analysis
- 12.1.3 Policy Bazaar
- 12.1.3.1. Company Overview
- 12.1.3.2. Products
- 12.1.3.3. Company Financials
- 12.1.3.4. SWOT Analysis
- 12.1.4 PayU
- 12.1.4.1. Company Overview
- 12.1.4.2. Products
- 12.1.4.3. Company Financials
- 12.1.4.4. SWOT Analysis
- 12.1.5 Kissht
- 12.1.5.1. Company Overview
- 12.1.5.2. Products
- 12.1.5.3. Company Financials
- 12.1.5.4. SWOT Analysis
- 12.1.6 Shubh Loans
- 12.1.6.1. Company Overview
- 12.1.6.2. Products
- 12.1.6.3. Company Financials
- 12.1.6.4. SWOT Analysis
- 12.1.7 Lending Kart
- 12.1.7.1. Company Overview
- 12.1.7.2. Products
- 12.1.7.3. Company Financials
- 12.1.7.4. SWOT Analysis
- 12.1.8 Phonepe
- 12.1.8.1. Company Overview
- 12.1.8.2. Products
- 12.1.8.3. Company Financials
- 12.1.8.4. SWOT Analysis
- 12.1.9 Faircent
- 12.1.9.1. Company Overview
- 12.1.9.2. Products
- 12.1.9.3. Company Financials
- 12.1.9.4. SWOT Analysis
- 12.1.10 ET money**List Not Exhaustive
- 12.1.10.1. Company Overview
- 12.1.10.2. Products
- 12.1.10.3. Company Financials
- 12.1.10.4. SWOT Analysis
- 12.1.1 Paytm
- 12.2. Market Entropy
- 12.2.1 Company's Key Areas Served
- 12.2.2 Recent Developments
- 12.3. Company Market Share Analysis 2025
- 12.3.1 Top 5 Companies Market Share Analysis
- 12.3.2 Top 3 Companies Market Share Analysis
- 12.4. List of Potential Customers
- 13. Research Methodology
List of Figures
- Figure 1: Global Fintech Industry in India Revenue Breakdown (Million, %) by Region 2025 & 2033
- Figure 2: Global Fintech Industry in India Volume Breakdown (Billion, %) by Region 2025 & 2033
- Figure 3: North America Fintech Industry in India Revenue (Million), by Service Proposition 2025 & 2033
- Figure 4: North America Fintech Industry in India Volume (Billion), by Service Proposition 2025 & 2033
- Figure 5: North America Fintech Industry in India Revenue Share (%), by Service Proposition 2025 & 2033
- Figure 6: North America Fintech Industry in India Volume Share (%), by Service Proposition 2025 & 2033
- Figure 7: North America Fintech Industry in India Revenue (Million), by Application 2025 & 2033
- Figure 8: North America Fintech Industry in India Volume (Billion), by Application 2025 & 2033
- Figure 9: North America Fintech Industry in India Revenue Share (%), by Application 2025 & 2033
- Figure 10: North America Fintech Industry in India Volume Share (%), by Application 2025 & 2033
- Figure 11: North America Fintech Industry in India Revenue (Million), by Country 2025 & 2033
- Figure 12: North America Fintech Industry in India Volume (Billion), by Country 2025 & 2033
- Figure 13: North America Fintech Industry in India Revenue Share (%), by Country 2025 & 2033
- Figure 14: North America Fintech Industry in India Volume Share (%), by Country 2025 & 2033
- Figure 15: South America Fintech Industry in India Revenue (Million), by Service Proposition 2025 & 2033
- Figure 16: South America Fintech Industry in India Volume (Billion), by Service Proposition 2025 & 2033
- Figure 17: South America Fintech Industry in India Revenue Share (%), by Service Proposition 2025 & 2033
- Figure 18: South America Fintech Industry in India Volume Share (%), by Service Proposition 2025 & 2033
- Figure 19: South America Fintech Industry in India Revenue (Million), by Application 2025 & 2033
- Figure 20: South America Fintech Industry in India Volume (Billion), by Application 2025 & 2033
- Figure 21: South America Fintech Industry in India Revenue Share (%), by Application 2025 & 2033
- Figure 22: South America Fintech Industry in India Volume Share (%), by Application 2025 & 2033
- Figure 23: South America Fintech Industry in India Revenue (Million), by Country 2025 & 2033
- Figure 24: South America Fintech Industry in India Volume (Billion), by Country 2025 & 2033
- Figure 25: South America Fintech Industry in India Revenue Share (%), by Country 2025 & 2033
- Figure 26: South America Fintech Industry in India Volume Share (%), by Country 2025 & 2033
- Figure 27: Europe Fintech Industry in India Revenue (Million), by Service Proposition 2025 & 2033
- Figure 28: Europe Fintech Industry in India Volume (Billion), by Service Proposition 2025 & 2033
- Figure 29: Europe Fintech Industry in India Revenue Share (%), by Service Proposition 2025 & 2033
- Figure 30: Europe Fintech Industry in India Volume Share (%), by Service Proposition 2025 & 2033
- Figure 31: Europe Fintech Industry in India Revenue (Million), by Application 2025 & 2033
- Figure 32: Europe Fintech Industry in India Volume (Billion), by Application 2025 & 2033
- Figure 33: Europe Fintech Industry in India Revenue Share (%), by Application 2025 & 2033
- Figure 34: Europe Fintech Industry in India Volume Share (%), by Application 2025 & 2033
- Figure 35: Europe Fintech Industry in India Revenue (Million), by Country 2025 & 2033
- Figure 36: Europe Fintech Industry in India Volume (Billion), by Country 2025 & 2033
- Figure 37: Europe Fintech Industry in India Revenue Share (%), by Country 2025 & 2033
- Figure 38: Europe Fintech Industry in India Volume Share (%), by Country 2025 & 2033
- Figure 39: Middle East & Africa Fintech Industry in India Revenue (Million), by Service Proposition 2025 & 2033
- Figure 40: Middle East & Africa Fintech Industry in India Volume (Billion), by Service Proposition 2025 & 2033
- Figure 41: Middle East & Africa Fintech Industry in India Revenue Share (%), by Service Proposition 2025 & 2033
- Figure 42: Middle East & Africa Fintech Industry in India Volume Share (%), by Service Proposition 2025 & 2033
- Figure 43: Middle East & Africa Fintech Industry in India Revenue (Million), by Application 2025 & 2033
- Figure 44: Middle East & Africa Fintech Industry in India Volume (Billion), by Application 2025 & 2033
- Figure 45: Middle East & Africa Fintech Industry in India Revenue Share (%), by Application 2025 & 2033
- Figure 46: Middle East & Africa Fintech Industry in India Volume Share (%), by Application 2025 & 2033
- Figure 47: Middle East & Africa Fintech Industry in India Revenue (Million), by Country 2025 & 2033
- Figure 48: Middle East & Africa Fintech Industry in India Volume (Billion), by Country 2025 & 2033
- Figure 49: Middle East & Africa Fintech Industry in India Revenue Share (%), by Country 2025 & 2033
- Figure 50: Middle East & Africa Fintech Industry in India Volume Share (%), by Country 2025 & 2033
- Figure 51: Asia Pacific Fintech Industry in India Revenue (Million), by Service Proposition 2025 & 2033
- Figure 52: Asia Pacific Fintech Industry in India Volume (Billion), by Service Proposition 2025 & 2033
- Figure 53: Asia Pacific Fintech Industry in India Revenue Share (%), by Service Proposition 2025 & 2033
- Figure 54: Asia Pacific Fintech Industry in India Volume Share (%), by Service Proposition 2025 & 2033
- Figure 55: Asia Pacific Fintech Industry in India Revenue (Million), by Application 2025 & 2033
- Figure 56: Asia Pacific Fintech Industry in India Volume (Billion), by Application 2025 & 2033
- Figure 57: Asia Pacific Fintech Industry in India Revenue Share (%), by Application 2025 & 2033
- Figure 58: Asia Pacific Fintech Industry in India Volume Share (%), by Application 2025 & 2033
- Figure 59: Asia Pacific Fintech Industry in India Revenue (Million), by Country 2025 & 2033
- Figure 60: Asia Pacific Fintech Industry in India Volume (Billion), by Country 2025 & 2033
- Figure 61: Asia Pacific Fintech Industry in India Revenue Share (%), by Country 2025 & 2033
- Figure 62: Asia Pacific Fintech Industry in India Volume Share (%), by Country 2025 & 2033
List of Tables
- Table 1: Global Fintech Industry in India Revenue Million Forecast, by Service Proposition 2020 & 2033
- Table 2: Global Fintech Industry in India Volume Billion Forecast, by Service Proposition 2020 & 2033
- Table 3: Global Fintech Industry in India Revenue Million Forecast, by Application 2020 & 2033
- Table 4: Global Fintech Industry in India Volume Billion Forecast, by Application 2020 & 2033
- Table 5: Global Fintech Industry in India Revenue Million Forecast, by Region 2020 & 2033
- Table 6: Global Fintech Industry in India Volume Billion Forecast, by Region 2020 & 2033
- Table 7: Global Fintech Industry in India Revenue Million Forecast, by Service Proposition 2020 & 2033
- Table 8: Global Fintech Industry in India Volume Billion Forecast, by Service Proposition 2020 & 2033
- Table 9: Global Fintech Industry in India Revenue Million Forecast, by Application 2020 & 2033
- Table 10: Global Fintech Industry in India Volume Billion Forecast, by Application 2020 & 2033
- Table 11: Global Fintech Industry in India Revenue Million Forecast, by Country 2020 & 2033
- Table 12: Global Fintech Industry in India Volume Billion Forecast, by Country 2020 & 2033
- Table 13: United States Fintech Industry in India Revenue (Million) Forecast, by Application 2020 & 2033
- Table 14: United States Fintech Industry in India Volume (Billion) Forecast, by Application 2020 & 2033
- Table 15: Canada Fintech Industry in India Revenue (Million) Forecast, by Application 2020 & 2033
- Table 16: Canada Fintech Industry in India Volume (Billion) Forecast, by Application 2020 & 2033
- Table 17: Mexico Fintech Industry in India Revenue (Million) Forecast, by Application 2020 & 2033
- Table 18: Mexico Fintech Industry in India Volume (Billion) Forecast, by Application 2020 & 2033
- Table 19: Global Fintech Industry in India Revenue Million Forecast, by Service Proposition 2020 & 2033
- Table 20: Global Fintech Industry in India Volume Billion Forecast, by Service Proposition 2020 & 2033
- Table 21: Global Fintech Industry in India Revenue Million Forecast, by Application 2020 & 2033
- Table 22: Global Fintech Industry in India Volume Billion Forecast, by Application 2020 & 2033
- Table 23: Global Fintech Industry in India Revenue Million Forecast, by Country 2020 & 2033
- Table 24: Global Fintech Industry in India Volume Billion Forecast, by Country 2020 & 2033
- Table 25: Brazil Fintech Industry in India Revenue (Million) Forecast, by Application 2020 & 2033
- Table 26: Brazil Fintech Industry in India Volume (Billion) Forecast, by Application 2020 & 2033
- Table 27: Argentina Fintech Industry in India Revenue (Million) Forecast, by Application 2020 & 2033
- Table 28: Argentina Fintech Industry in India Volume (Billion) Forecast, by Application 2020 & 2033
- Table 29: Rest of South America Fintech Industry in India Revenue (Million) Forecast, by Application 2020 & 2033
- Table 30: Rest of South America Fintech Industry in India Volume (Billion) Forecast, by Application 2020 & 2033
- Table 31: Global Fintech Industry in India Revenue Million Forecast, by Service Proposition 2020 & 2033
- Table 32: Global Fintech Industry in India Volume Billion Forecast, by Service Proposition 2020 & 2033
- Table 33: Global Fintech Industry in India Revenue Million Forecast, by Application 2020 & 2033
- Table 34: Global Fintech Industry in India Volume Billion Forecast, by Application 2020 & 2033
- Table 35: Global Fintech Industry in India Revenue Million Forecast, by Country 2020 & 2033
- Table 36: Global Fintech Industry in India Volume Billion Forecast, by Country 2020 & 2033
- Table 37: United Kingdom Fintech Industry in India Revenue (Million) Forecast, by Application 2020 & 2033
- Table 38: United Kingdom Fintech Industry in India Volume (Billion) Forecast, by Application 2020 & 2033
- Table 39: Germany Fintech Industry in India Revenue (Million) Forecast, by Application 2020 & 2033
- Table 40: Germany Fintech Industry in India Volume (Billion) Forecast, by Application 2020 & 2033
- Table 41: France Fintech Industry in India Revenue (Million) Forecast, by Application 2020 & 2033
- Table 42: France Fintech Industry in India Volume (Billion) Forecast, by Application 2020 & 2033
- Table 43: Italy Fintech Industry in India Revenue (Million) Forecast, by Application 2020 & 2033
- Table 44: Italy Fintech Industry in India Volume (Billion) Forecast, by Application 2020 & 2033
- Table 45: Spain Fintech Industry in India Revenue (Million) Forecast, by Application 2020 & 2033
- Table 46: Spain Fintech Industry in India Volume (Billion) Forecast, by Application 2020 & 2033
- Table 47: Russia Fintech Industry in India Revenue (Million) Forecast, by Application 2020 & 2033
- Table 48: Russia Fintech Industry in India Volume (Billion) Forecast, by Application 2020 & 2033
- Table 49: Benelux Fintech Industry in India Revenue (Million) Forecast, by Application 2020 & 2033
- Table 50: Benelux Fintech Industry in India Volume (Billion) Forecast, by Application 2020 & 2033
- Table 51: Nordics Fintech Industry in India Revenue (Million) Forecast, by Application 2020 & 2033
- Table 52: Nordics Fintech Industry in India Volume (Billion) Forecast, by Application 2020 & 2033
- Table 53: Rest of Europe Fintech Industry in India Revenue (Million) Forecast, by Application 2020 & 2033
- Table 54: Rest of Europe Fintech Industry in India Volume (Billion) Forecast, by Application 2020 & 2033
- Table 55: Global Fintech Industry in India Revenue Million Forecast, by Service Proposition 2020 & 2033
- Table 56: Global Fintech Industry in India Volume Billion Forecast, by Service Proposition 2020 & 2033
- Table 57: Global Fintech Industry in India Revenue Million Forecast, by Application 2020 & 2033
- Table 58: Global Fintech Industry in India Volume Billion Forecast, by Application 2020 & 2033
- Table 59: Global Fintech Industry in India Revenue Million Forecast, by Country 2020 & 2033
- Table 60: Global Fintech Industry in India Volume Billion Forecast, by Country 2020 & 2033
- Table 61: Turkey Fintech Industry in India Revenue (Million) Forecast, by Application 2020 & 2033
- Table 62: Turkey Fintech Industry in India Volume (Billion) Forecast, by Application 2020 & 2033
- Table 63: Israel Fintech Industry in India Revenue (Million) Forecast, by Application 2020 & 2033
- Table 64: Israel Fintech Industry in India Volume (Billion) Forecast, by Application 2020 & 2033
- Table 65: GCC Fintech Industry in India Revenue (Million) Forecast, by Application 2020 & 2033
- Table 66: GCC Fintech Industry in India Volume (Billion) Forecast, by Application 2020 & 2033
- Table 67: North Africa Fintech Industry in India Revenue (Million) Forecast, by Application 2020 & 2033
- Table 68: North Africa Fintech Industry in India Volume (Billion) Forecast, by Application 2020 & 2033
- Table 69: South Africa Fintech Industry in India Revenue (Million) Forecast, by Application 2020 & 2033
- Table 70: South Africa Fintech Industry in India Volume (Billion) Forecast, by Application 2020 & 2033
- Table 71: Rest of Middle East & Africa Fintech Industry in India Revenue (Million) Forecast, by Application 2020 & 2033
- Table 72: Rest of Middle East & Africa Fintech Industry in India Volume (Billion) Forecast, by Application 2020 & 2033
- Table 73: Global Fintech Industry in India Revenue Million Forecast, by Service Proposition 2020 & 2033
- Table 74: Global Fintech Industry in India Volume Billion Forecast, by Service Proposition 2020 & 2033
- Table 75: Global Fintech Industry in India Revenue Million Forecast, by Application 2020 & 2033
- Table 76: Global Fintech Industry in India Volume Billion Forecast, by Application 2020 & 2033
- Table 77: Global Fintech Industry in India Revenue Million Forecast, by Country 2020 & 2033
- Table 78: Global Fintech Industry in India Volume Billion Forecast, by Country 2020 & 2033
- Table 79: China Fintech Industry in India Revenue (Million) Forecast, by Application 2020 & 2033
- Table 80: China Fintech Industry in India Volume (Billion) Forecast, by Application 2020 & 2033
- Table 81: India Fintech Industry in India Revenue (Million) Forecast, by Application 2020 & 2033
- Table 82: India Fintech Industry in India Volume (Billion) Forecast, by Application 2020 & 2033
- Table 83: Japan Fintech Industry in India Revenue (Million) Forecast, by Application 2020 & 2033
- Table 84: Japan Fintech Industry in India Volume (Billion) Forecast, by Application 2020 & 2033
- Table 85: South Korea Fintech Industry in India Revenue (Million) Forecast, by Application 2020 & 2033
- Table 86: South Korea Fintech Industry in India Volume (Billion) Forecast, by Application 2020 & 2033
- Table 87: ASEAN Fintech Industry in India Revenue (Million) Forecast, by Application 2020 & 2033
- Table 88: ASEAN Fintech Industry in India Volume (Billion) Forecast, by Application 2020 & 2033
- Table 89: Oceania Fintech Industry in India Revenue (Million) Forecast, by Application 2020 & 2033
- Table 90: Oceania Fintech Industry in India Volume (Billion) Forecast, by Application 2020 & 2033
- Table 91: Rest of Asia Pacific Fintech Industry in India Revenue (Million) Forecast, by Application 2020 & 2033
- Table 92: Rest of Asia Pacific Fintech Industry in India Volume (Billion) Forecast, by Application 2020 & 2033
Frequently Asked Questions
1. What is the projected Compound Annual Growth Rate (CAGR) of the Fintech Industry in India?
The projected CAGR is approximately 30.55%.
2. Which companies are prominent players in the Fintech Industry in India?
Key companies in the market include Paytm, MobiKwik, Policy Bazaar, PayU, Kissht, Shubh Loans, Lending Kart, Phonepe, Faircent, ET money**List Not Exhaustive.
3. What are the main segments of the Fintech Industry in India?
The market segments include Service Proposition, Application.
4. Can you provide details about the market size?
The market size is estimated to be USD 111.14 Million as of 2022.
5. What are some drivers contributing to market growth?
Increasing Demand for Digital Services; Rapid Advancement in Technology is Driving the Market.
6. What are the notable trends driving market growth?
Increase in Mobile Banking Payments is Surging the Growth of the Market.
7. Are there any restraints impacting market growth?
Increasing Demand for Digital Services; Rapid Advancement in Technology is Driving the Market.
8. Can you provide examples of recent developments in the market?
September 2023: PayU, an Indian payments company, partnered with WhatsApp to considerably improve Indians' purchasing experience.
9. What pricing options are available for accessing the report?
Pricing options include single-user, multi-user, and enterprise licenses priced at USD 3800, USD 4500, and USD 5800 respectively.
10. Is the market size provided in terms of value or volume?
The market size is provided in terms of value, measured in Million and volume, measured in Billion.
11. Are there any specific market keywords associated with the report?
Yes, the market keyword associated with the report is "Fintech Industry in India," which aids in identifying and referencing the specific market segment covered.
12. How do I determine which pricing option suits my needs best?
The pricing options vary based on user requirements and access needs. Individual users may opt for single-user licenses, while businesses requiring broader access may choose multi-user or enterprise licenses for cost-effective access to the report.
13. Are there any additional resources or data provided in the Fintech Industry in India report?
While the report offers comprehensive insights, it's advisable to review the specific contents or supplementary materials provided to ascertain if additional resources or data are available.
14. How can I stay updated on further developments or reports in the Fintech Industry in India?
To stay informed about further developments, trends, and reports in the Fintech Industry in India, consider subscribing to industry newsletters, following relevant companies and organizations, or regularly checking reputable industry news sources and publications.
Methodology
Step 1 - Identification of Relevant Samples Size from Population Database


Step 2 - Approaches for Defining Global Market Size (Value, Volume* & Price*)

Note*: In applicable scenarios
Step 3 - Data Sources
Primary Research
- Web Analytics
- Survey Reports
- Research Institute
- Latest Research Reports
- Opinion Leaders
Secondary Research
- Annual Reports
- White Paper
- Latest Press Release
- Industry Association
- Paid Database
- Investor Presentations

Step 4 - Data Triangulation
Involves using different sources of information in order to increase the validity of a study
These sources are likely to be stakeholders in a program - participants, other researchers, program staff, other community members, and so on.
Then we put all data in single framework & apply various statistical tools to find out the dynamic on the market.
During the analysis stage, feedback from the stakeholder groups would be compared to determine areas of agreement as well as areas of divergence